Abstract
The superiority of SPECT/CT over SPECT for 99mTc-sestamibi parathyroid imaging often is assumed to be due to improved lesion localization provided by the anatomic component (computed tomography) of the examination. It also is possible that this superiority may be related to the algorithms used for SPECT data reconstruction. The objective of this investigation was to determine the effect of SPECT reconstruction algorithms on the accuracy of MIBI SPECT/CT parathyroid imaging. We retrospectively analyzed preoperative MIBI SPECT/CT parathyroid imaging studies performed on 106 patients. SPECT data were reconstructed by filtered back projection (FBP) and by iterative reconstruction with corrections for collimator resolution recovery and attenuation (IRC). Two experienced readers independently graded lesion detection certainty on a 5-point scale without knowledge of each other’s readings, reconstruction methods, other test results or final diagnoses. All patients had surgical confirmation of the final diagnosis, including disease limited to the neck, and location and weight of excised lesion(s). There were 135 parathyroid lesions among the 106 patients. For FBP SPECT/CT and IRC SPECT/CT sensitivity was 76% and 90% (p = 0.003), specificity was 87% and 87% (p = 0.90), and accuracy was 83% and 88% (p = 0.04), respectively. Inter-rater agreement was significantly higher for IRC than for FBP (kappa = 0.76, “good agreement”, versus kappa = 0.58, “moderate agreement”, p < 0.0001). We conclude that the improved accuracy of MIBI SPECT/CT compared to MIBI SPECT for preoperative parathyroid lesion localization is due in part to the use of IRC for SPECT data reconstruction.
Keywords: Parathyroid, 99mTc-sestamibi, MIBI, SPECT/CT, iterative reconstruction, filtered back projection
Introduction
Published data demonstrate the added value of SPECT/CT for 99mTc-sestamibi (MIBI) parathyroid imaging by affording more precise lesion localization than SPECT alone, presumably by virtue of the anatomic component, i.e., computed tomography (CT) of the examination [1]. Phantom data suggest that for SPECT, iterative reconstruction is superior to FBP for detecting parathyroid lesions [2]. It is possible, therefore, that the superiority of SPECT/CT over SPECT may be due, at least in part, to the reconstruction algorithm applied to the SPECT data. When performed alone, SPECT data usually are reconstructed by filtered back projection (FBP) [3], whereas when performed as SPECT/CT, data typically are reconstructed by a combination of iterative reconstruction with attenuation and collimator resolution recovery corrections (IRC). The objective of this investigation, therefore, was to determine the effect of the reconstruction method on the accuracy of MIBI SPECT/CT parathyroid imaging. In order to eliminate CT as a variable, we compared the results of IRC SPECT/CT to the results of FBP SPECT/CT.
Materials and methods
Subjects
The Institutional Review Board waived informed consent for this HIPAA-compliant retrospective investigation. Inclusion criteria were: (1) biochemical evidence of primary hyperparathyroidism; (2) MIBI parathyroid SPECT/CT imaging; (3) surgery within four months after imaging; (4) surgical confirmation of final diagnosis, including number of lesions, lesion locations, and lesion weights; and (5) disease limited to the neck. One hundred six patients met the inclusion criteria: 87 females and 19 males (age = 59 ± 12 years; range 19-88 years).
Imaging protocol
A single SPECT/CT acquisition was performed approximately 30 minutes after injection of 1.11 GBq 99mTc-MIBI. MIBI is not an approved indication for parathyroid imaging, but nonetheless is widely used. Data were acquired using a dual-detector in-line-CT gamma camera system (“Infinia Hawkeye-4”, General Electric, Milwaukee, WI) equipped with low-energy high-resolution parallel-hole collimators. Depending on patient size, the imaging field of view extended, at a minimum, from the angle of the mandible to the base of the heart. Data were acquired as 128 × 128 matrices for 120 projections at 40 seconds/projection. Energy discrimination was accomplished with a 15% energy window centered on 140 keV. The CT component of the examination was acquired immediately after the SPECT component, without moving the patient, using a low-dose non-diagnostic 4-channel unit running at 140 kVp at 2.5 mA. The unit was set to acquire 5 mm thick slices in helical mode with a pitch of 1.9, rotating at 2.6 rpm. CT data were acquired into 512 × 512 matrices (pixel size = 0.6 mm) with a slice step of 2.4 mm. The CT scan required 2-3 minutes to complete; the total acquisition time for the SPECT/CT study was 45-47 minutes. Neither oral nor intravenous contrast was used.
Image processing
SPECT data were reconstructed by both FBP and IRC. FBP was performed using a Butterworth filter with cutoff = 0.3/cm and order 8, as previously described [4]. SPECT data were reconstructed by IRC using vendor provided ordered subset expectation maximization (OSEM) algorithms (16 subsets and 2 iterations) for bone SPECT; there are no recommendations specific for parathyroid SPECT.
The IRC algorithm included both collimator-specific resolution recovery corrections [5], and CT-attenuation corrections [6]. A Butterworth post filter was used (cutoff = 0.5/cm and order 10), as this was the recommendation by the manufacturer for bone SPECT.
CT data were reconstructed using a “standard” filter as per manufacturer recommendations for bone SPECT.
Image readings
For both reconstruction methods, two Nuclear Medicine physicians experienced in reading parathyroid SPECT/CT studies scored degree of confidence on spreadsheets for detecting a lesion in each of the four quadrants of the neck: right upper, right lower, left upper, and left lower [7,8]. Readers further characterized the lesion location as eutopic or ectopic. Initially all spreadsheet entries were 0 by default. Non-zero scores were entered only at the location of a perceived lesion. Readers read randomized studies in reading sessions separated from one another by at least 1 week to minimize bias.
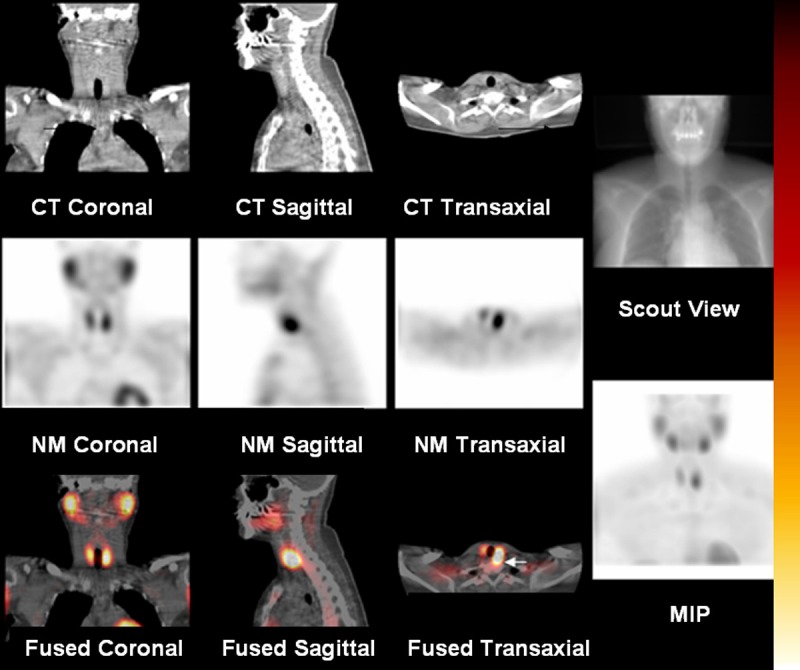
Each reading session consisted of 10-15 studies of the same SPECT/CT type, either FBP or IRC, chosen at random by an individual who was not one of the readers. Studies were read as all 3 orthogonal views displayed simultaneously together with a cinematic playback of maximum intensity projection (MIP) [9] (Figure 1). The two readers reviewed studies independently of one another, without knowledge of each other’s readings, reconstruction methods, other test results or final diagnosis. Focally increased activity outside the normal MIBI biodistribution was classified as positive for a parathyroid lesion. Images were graded on a 5-point scale: 0 = “normal”, 1 = “probably normal”, 2 = “equivocal”, 3 = “probably abnormal”, and 4 = “definitely abnormal”. A score of 0 (“normal”) indicated that no MIBI uptake outside the normal physiologic distribution of this radiopharmaceutical was identified, 2 (“equivocal”) meant that activity outside the normal physiologic distribution was questioned, and 4 (“definitely abnormal”) meant that MIBI uptake outside the normal distribution was definitely identified.
Figure 1.

1000 mg ectopic, retroesopahgeal, left superior parathyroid lesion, best appreciated on the axial fused image (arrow). For all readings, SPECT/CT images in all 3 orthogonal views were displayed simultaneously along with a cinematic playback of maximum intensity projection (MIP), CT images, and fused images.
Statistical analysis
Statistical analyses were performed using commercially available software (“Medcalc”, Version 7.5.0.0., Medcalc Software, Inc., Mariakerke, Belgium). Values are reported as means ± one standard deviation. Continuous variables were tested by the D’Agastino-Pearson test to determine if they were normally distributed. The paired or unpaired t-test, as appropriate, was used in comparing values between groups for continuous variables that were normally distributed; otherwise, the Wilcoxon test was used. Frequencies and percentages were used to characterize categorical variables. Chi-squared analysis of proportions compared ratios between subgroups. Rank correlation assessed relationships between continuous and discrete variables.
A FBP SPECT/CT reading that was equivocal (confidence score = 2) was considered to be accurately resolved by IR SPECT/CT if the confidence score became true negative (0-1) or true positive (3-4).
ROC analysis compared readings for each method versus surgical results. The ROC reading threshold that produced optimal accuracy (maximum ROC curve area) subsequently was used to dichotomize readings for each method. All accuracy, sensitivity, specificity, positive predictive value and negative predictive value results reported are for dichotomized readings. The same optimal ROC thresholds obtained for all lesions were applied in analyzing multi-gland disease (MGD) and single gland disease (SGD) subgroups, because it is not possible to know a priori before imaging how many lesions an individual patient has. Inter-rater agreement was assessed using the kappa statistic [10].
For all tests, except inter-rater agreement, results reported are the mean of the two readers’ scores. For all tests, probability (p) values < 0.05 were considered statistically significant.
Results
Final diagnoses
The interval between imaging and surgery was 37 ± 30 days (range: 3-120 days). There were 135 lesions among the 106 patients. Eighty-five lesions were eutopic and 50 were ectopic in location, including 25 in the retroesophageal region and 25 in the thyrothymic tract. Eighty-seven (82%) patients had SGD with a mean lesion weight of 921 ± 1,018 mg; 19 (18%) patients had MGD with 48 lesions with a mean lesion weight of 324 ± 513 mg, which was significantly less than that of SGD lesions (Wilcoxon p < 0.0001). MGD lesions were distributed as: 10 patients (9%) had two lesions of 389 ± 745 mg, 8 patients (8%) had three lesions of 326 ± 248 mg, and 1 patient (1%) had four lesions of 45 ± 37 mg. Lesion weights decreased progressively with increasing number of lesions (ρ = -0.49, p < 0.0001) in agreement with previous observations [11].
Imaging results
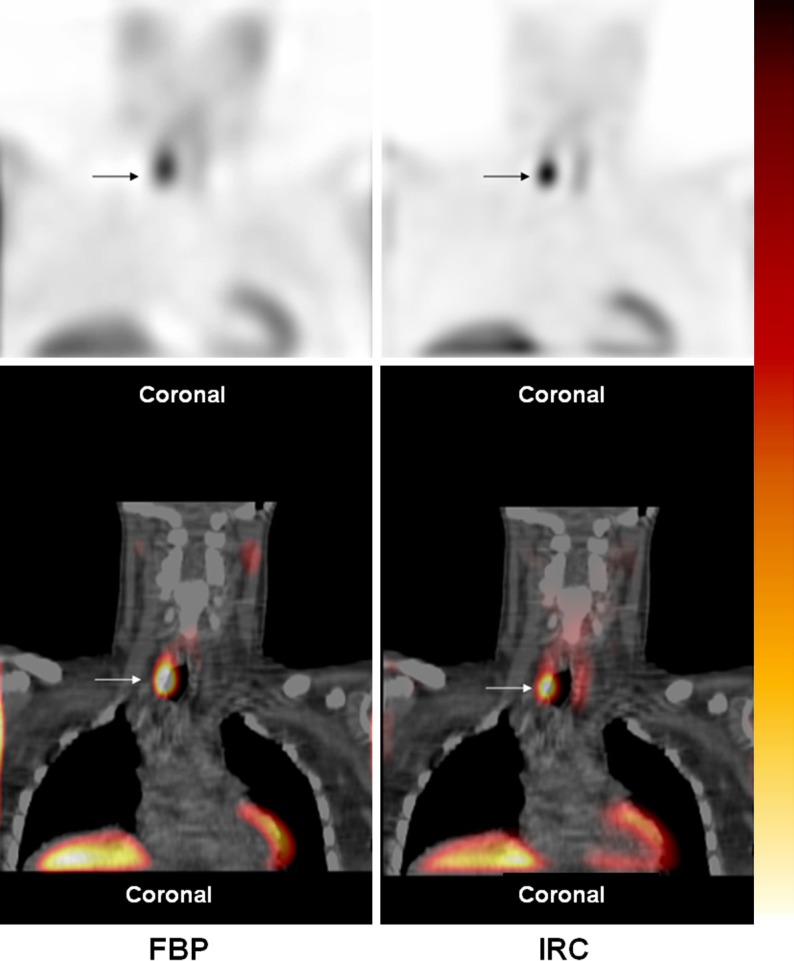
ROC analysis demonstrated significantly higher accuracy (area under the ROC curves) for IRC SPECT/CT than FBP SPECT/CT readings (93 ± 2% versus 86 ± 2%, p = 0.001). Using ROC thresholds to dichotomize readings, for all 135 lesions sensitivity, accuracy and negative predictive value were significantly higher for IRC SPECT/CT than for FBP SPECT/CT (Table 1). All parameters (sensitivity, specificity, accuracy, positive predictive value and negative predictive value) were higher for IRC SPECT/CT than FBP SPECT/CT for the 87 patients with SGD lesions (Figure 2; Table 2). Among the 19 patients with 48 MGD lesions, all parameters were higher, with sensitivity and accuracy significantly higher for IRC SPECT/CT than for FBP SPECT/CT (Table 2).
Table 1.
| FBP | IRC | p | |
|---|---|---|---|
| Sensitivity | 76% | 90%+ | 0.003 |
| Specificity | 87% | 87% | 0.90 |
| Accuracy | 83% | 88%+ | 0.04 |
| Positive predictive value | 73% | 77% | 0.48 |
| Negative predictive value | 89% | 95%+ | 0.01 |
FBC: Filtered back projection.
IRC: iterative reconstruction + resolution recovery + CT attenuation correction.
p < 0.05 versus FBP.
Figure 2.

900 mg right inferior parathyroid lesion (arrow) was scored as 4 (“definitely abnormal”) on both FBP and IRC SPECT/CT. Although the lesion is seen on the FBP SPECT/CT, it is much more clearly delineated on the IRC SPECT/CT. In contrast to FBP, IRC deblurs structures, concentrates activity towards the center of the lesion, and boosts counts interior to the body, effectively reducing background activity and increasing image contrast.
Table 2.
| Single gland disease (N = 87 lesions) | Multi-gland disease (N = 48 lesions) | |||||
|---|---|---|---|---|---|---|
|
| ||||||
| FBP | IRC | p | FBP | IRC | p | |
| Sensitivity | 92% | 99% | 0.59 | 52% | 75%+ | 0.03 |
| Specificity | 86% | 89% | 0.91 | 89% | 96% | 0.60 |
| Accuracy | 88% | 89% | 0.55 | 66% | 83%+ | 0.03 |
| Positive predictive value | 69% | 70% | 0.91 | 89% | 97% | 0.42 |
| Negative predictive value | 97% | 99% | 0.08 | 52% | 69% | 0.16 |
FBC: Filtered back projection.
IRC: iterative reconstruction + resolution recovery + CT attenuation correction.
p < 0.05 versus FBP.
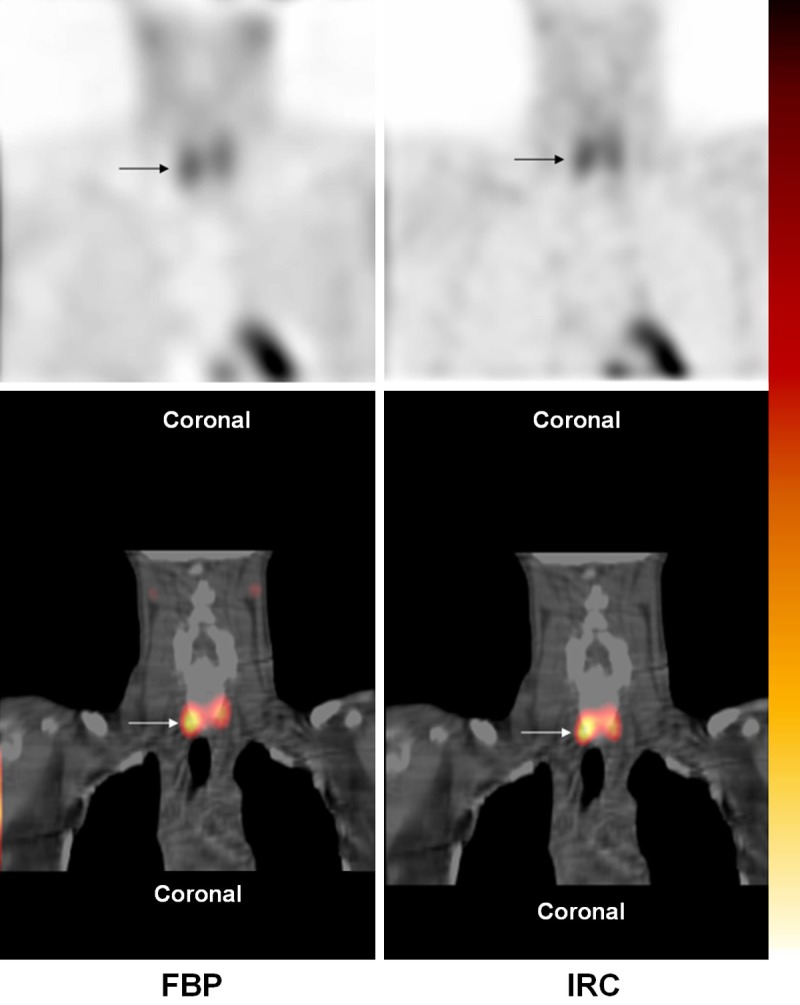
The number of equivocal scores was higher for FBP SPECT/CT than for IRC SPECT/CT (6.6% (28/424) versus 3.7% (16/424), p = 0.09) (Table 3). The number of equivocal scores was significantly higher for FBP SPECT/CT than for IRC SPECT/CT at sites with a parathyroid lesion (4.2% (18/424) versus 1.7% (7/424), p = 0.04), and was similar at sites with no lesion (2.4% (10/424) versus 2.1% (9/424), p = 0.95) (Table 3). All 28 equivocal FBP SPECT/CT scores were correctly scored by IRC SPECT/CT as positive or negative (Figure 3).
Table 3.
| FBP | IRC | |
|---|---|---|
| Total number of readings | 424 | 424 |
| Number of equivocal readings | 28 | 16 |
| Prevalence of equivocal readings | 6.6% | 3.8% |
| Lesions | 18 | 7 |
| Prevalence of equivocal readings in the presence of lesions | 4.2% | 1.7%+ |
| No lesion | 10 | 9 |
| Prevalence of equivocal readings in the absence of lesions | 2.4% | 2.1% |
FBC: Filtered back projection.
IRC: iterative reconstruction + resolution recovery + CT attenuation correction.
p < 0.05 versus FBP.
Figure 3.

720 mg right inferior parathyroid lesion (arrow) was scored as 2 (“equivocal”) on FBP SPECT/CT by both observers. On IRC SPECT/CT, one observer scored the lesion 3 (“probably abnormal”) and the other observer scored the lesion 4 (“definitely abnormal”).
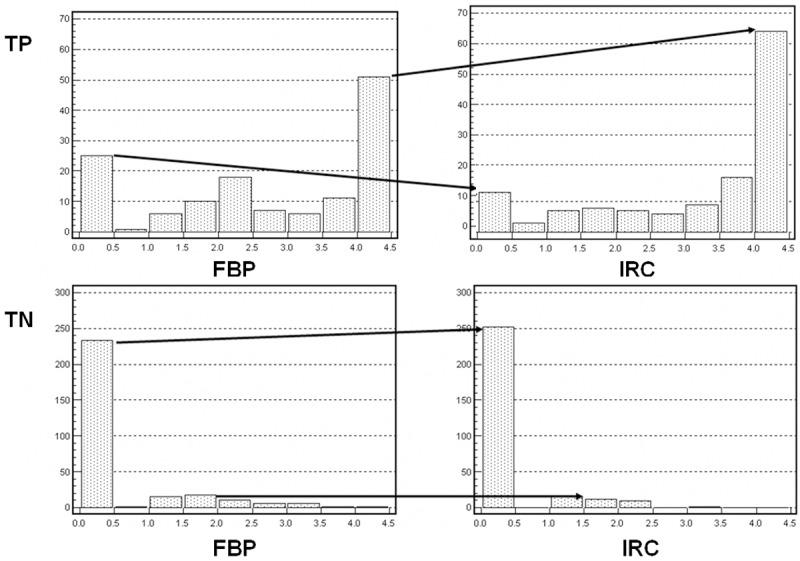
For all patients, at sites where a lesion was present FBP SPECT/CT scores were significantly lower than IRC SPECT/CT scores (2.49 ± 1.53 versus 2.93 ± 1.39, Wilcoxon p < 0.0001), while at sites where no lesion was present, FBP SPECT/CT scores were significantly higher than IRC SPECT/CT scores (0.33 ± 0.76 versus 0.19 ± 0.52, Wilcoxon p = 0.004) (Figure 4). In patients with SGD, at sites where a lesion was present FBP SPECT/CT scores were significantly lower than IRC SPECT/CT scores (3.09 ± 1.18 versus 3.58 ± 0.77, Wilcoxon p = 0.0005) and at sites where no lesion was present scores were significantly higher for FBP SPECT/CT than IRC SPECT/CT (0.35 ± 0.77 versus 0.20 ± 0.54, Wilcoxon p = 0.009).
Figure 4.

Shift in confidence scores for true positive (TP) and true negative (TN) readings for FBP SPECT/CT and IRC SPECT/CT readings. TP scores were higher and TN scores were lower for IRC SPECT/CT than for FBP SPECT/CT readings.
In patients with MGD, FBP SPECT/CT scores were significantly lower than IRC SPECT/CT scores at sites with lesions (1.39 ± 1.50 versus 1.75 ± 1.48, Wilcoxon p = 0.04) and lower, but not significantly, at sites without lesions (0.20 ± 0.60 versus 0.03 ± 0.19, Wilcoxon p = 0.25). For sites with lesions, scores were significantly lower for MGD than for SGD for FBP SPECT/CT (1.39 ± 1.50 versus 3.09 ± 1.18, Wilcoxon p < 0.0001), and for IRC SPECT/CT (1.75 ± 1.48 versus 3.58 ± 0.77, Wilcoxon p < 0.0001).
Inter-rater agreement was significantly higher for IRC SPECT/CT than for FBP SPECT/CT for all lesions (kappa = 0.76, “good agreement”, versus kappa = 0.58, “moderate agreement”, p < 0.0001), and for SGD lesions (kappa = 0.80, “good agreement”, versus kappa = 0.61, “moderate agreement”, p < 0.0001) [10]. Inter-rater agreement also was higher, but not significantly, for IRC SPECT/CT than for FBP SPECT/CT for MGD lesions (kappa = 0.57, “moderate agreement”, versus kappa = 0.44, “moderate agreement”, p = 0.29).
Discussion
One factor that accounts for the improved accuracy that SPECT/CT has brought to radionuclide imaging in general, and to MIBI parathyroid imaging specifically, is the more precise localization of radiopharmaceutical accumulation that the hybrid imaging technique provides [1]. The improved accuracy, however, may be related to other factors in addition to anatomic localization. When performed alone, SPECT data typically are reconstructed by FBP [2], whereas when performed as SPECT/CT, SPECT data typically are reconstructed by iterative reconstruction in combination with simultaneous corrections for multiple physical phenomena, including collimator resolution recovery corrections [5], and attenuation corrections [6]. As part of a larger phantom investigation of MIBI parathyroid imaging, 85 equivocal FBP SPECT MIBI studies were reprocessed using iterative reconstruction and re-reviewed. The investigators found that iteratively reconstructed SPECT data was significantly more accurate than data reconstructed with FBP (88 ± 6% versus 58 ± 6%, p < 0.0001) [3]. The results of our investigation are similar; IRC SPECT/CT was significantly more accurate than FBP SPECT/CT. Scores for positive readings were higher, and scores for negative readings were significantly lower, for IRC SPECT/CT than for FBP SPECT/CT. In addition, the number of lesions with equivocal scores was significantly lower with IRC SPECT/CT. These data indicate that reader confidence for both positive and negative interpretations increased with IRC SPECT/CT compared to FBP SPECT/CT.
The increase in reader confidence in image interpretation and the decrease in the number of equivocal scores with IRC SPECT/CT can be explained by the differences between FBP and IRC. FBP merely projects counts received at each projection back into the reconstruction space without regard to local count statistics. Iterative reconstruction takes into account the Poisson noise characteristics of SPECT data and suppresses reconstructed count variations in low count regions [12]. Iterative reconstruction concentrates activity in the vicinity of genuine lesions and suppresses background noise in regions without lesions [13]. The addition of resolution recovery and CT corrections further improves image quality compared to FBP [14]. Resolution recovery deblurs structures and concentrates activity towards the center of the lesion, while CT boosts counts interior to the body, effectively reducing background activity, thereby increasing image contrast (Figure 2). The combination of these effects likely contributes to the superior results obtained with IRC SPECT/CT in this investigation.
Although IRC SPECT/CT was superior to FBP SPECT/CT in patients with MGD, it was still significantly less accurate than in patients with SGD, which is consistent with what has been reported previously for MIBI parathyroid imaging. In a previous investigation, readers routinely assigned lower confidence scores to MGD lesions than to SGD lesions, even when both lesions were similar in weight and in the same location [11]. We hypothesize that radiopharmaceutical uptake in MGD lesions may be so low that it cannot be appreciated even with IRC.
Limitations
It may have been instructive to also process and interpret SPECT data in multiple ways to determine the individual contributions of CT- attenuation correction, iterative reconstruction, and collimator-specific resolution recovery, each by themselves in isolation. To do so, however, would have required at least four additional ways to process and interpret the SPECT data (i.e., iterative reconstruction alone, with and without CT, iterative reconstruction with resolution recovery but without CT, and iterative reconstruction + CT without resolution recovery). This was not practical for the current investigation. In view of the fact that all vendors now supply SPECT/CT reconstruction algorithms that include iterative reconstruction, resolution recovery and CT attenuation correction, it was most relevant to our investigation to examine data reconstruction methods that would most likely be used in actual clinical practice.
Conclusion
We conclude that the improved accuracy of MIBI parathyroid SPECT/CT compared to MIBI SPECT is due not only to improved lesion localization afforded by the CT component of the examination, but also, as our data show, to the use of IRC for reconstruction of the SPECT data.
Acknowledgements
The authors would like to thank Lenny X. Wang and Sara Goldgraben for their invaluable assistance in this investigation.
Disclosure of conflict of interest
The authors have no conflicts of interest to report.
References
- 1.Eslamy HK, Ziessman HA. Parathyroid scintigraphy in patients with primary hyperparathyroidism: 99mTc sestamibi SPECT and SPECT/CT. Radiographics. 2008;28:1461–1476. doi: 10.1148/rg.285075055. [DOI] [PubMed] [Google Scholar]
- 2.Nichols KJ, Tronco GG, Tomas MB, Kunjummen BD, Siripun L, Rini JN, Palestro CJ. Phantom experiments to improve parathyroid lesion localization. Med Phys. 2007;34:4792–4797. doi: 10.1118/1.2804553. [DOI] [PubMed] [Google Scholar]
- 3.Rubello D, Pelizzo MR, Boni G, Schiavo R, Vaggelli L, Villa G, Sandrucci S, Piotto A, Manca G, Marini P, Mariani G. Radioguided surgery of primary hyperparathyroidism using the low-dose 99mTc-sestamibi protocol: Multiinstitutional experience from the Italian study group on radioguided surgery and immunoscintigraphy (GISCRIS) J Nucl Med. 2005;46:220–226. [PubMed] [Google Scholar]
- 4.Nichols KJ, Tomas MB, Tronco GG, Rini JN, Kunjummen BD, Heller KS, Sznyter LA, Palestro CJ. Preoperative parathyroid scintigraphic lesion localization: accuracy of various types of readings. Radiology. 2008;248:221–232. doi: 10.1148/radiol.2481071066. [DOI] [PubMed] [Google Scholar]
- 5.Daou D, Pointurier I, Coaguila C, Vilain D, Benada AW, Lebtahi R, Fourme T, Slama M, Le Guludec D. Performance of OSEM and depth-dependent resolution recovery algorithms for the evaluation of global left ventricular function in 201Tl gated myocardial perfusion SPECT. J Nucl Med. 2003;44:155–162. [PubMed] [Google Scholar]
- 6.Zaidi H, Hasegawa B. Determination of the attenuation map in emission tomography. J Nucl Med. 2003;44:291–315. [PubMed] [Google Scholar]
- 7.Prommegger R, Wimmer G, Profanter C, Sauper T, Sieb M, Kovacs P, Bale R, Putzer D, Gabriel M, Margreiter R. Virtual neck exploration a new method for localizing abnormal parathyroid glands. Ann Surg. 2009;250:761–765. doi: 10.1097/SLA.0b013e3181bd906b. [DOI] [PubMed] [Google Scholar]
- 8.Patel CN, Salahudeen HM, Lansdown M, Scarsbrook AF. Clinical utility of ultrasound and 99mTc sestamibi SPECT/CT for preoperative localization of parathyroid adenoma in patients with primary hyperparathyroidism. Clin Radiol. 2010;65:278–287. doi: 10.1016/j.crad.2009.12.005. [DOI] [PubMed] [Google Scholar]
- 9.Gruden JF, Ouanounou S, Tigges S, Norris AD, Klausner TS. Incremental benefit of maximum-intensity-projection images on observer detection of small pulmonary nodules revealed by multidetector CT. AJR Am J Roentgenol. 2002;179:149–157. doi: 10.2214/ajr.179.1.1790149. [DOI] [PubMed] [Google Scholar]
- 10.Landis JR, Koch GG. The measurement of observer agreement for categorical data. Biometrics. 1977;33:159–174. [PubMed] [Google Scholar]
- 11.Nichols KJ, Tomas MB, Tronco GG, Palestro CJ. Sestamibi parathyroid scintigraphy in multi-gland disease. Nucl Med Commun. 2012;33:43–50. doi: 10.1097/MNM.0b013e32834bfeb1. [DOI] [PubMed] [Google Scholar]
- 12.Shepp A, Vardi Y. Maximum likelihood reconstruction for emission tomography. IEEE Trans Med Imaging. 1982;1:113–122. doi: 10.1109/TMI.1982.4307558. [DOI] [PubMed] [Google Scholar]
- 13.Gantet P, Payoux P, Celler A, Majorel C, Gourion D, Noll D, Esquerre JP. Iterative three-dimensional expectation maximization restoration of single photon emission computed tomography images: Application in striatal imaging. Med Phys. 2006;33:52–60. doi: 10.1118/1.2135908. [DOI] [PubMed] [Google Scholar]
- 14.Pan TS, Luo DS, Kohli V, King MA. Influence of OSEM, elliptical orbits and background activity on SPECT 3D resolution recovery. Phys Med Biol. 1997;42:2517–2529. doi: 10.1088/0031-9155/42/12/015. [DOI] [PubMed] [Google Scholar]


