

Abstract
Advanced colorectal cancer is characterized by uncontrolled growth and resistance against anti-cancer agents, including ErbB inhibitors. Recent data suggest that cancer stem cells (CSC) are particularly resistant. These cells may reside within a CD133+ fraction of the malignant cells. Using HCT116 cells we explored the role of CD133 and other CSC markers in drug resistance in colon cancer cells. CD133+ cells outnumbered CD133- cells over time in long-term culture. Both populations displayed the KRAS mutation 38G > A and an almost identical target profile, including EGFR/ErbB1, ErbB2, and ErbB4. Microarray analyses and flow cytometry identified CD26 as additional CSC marker co-expressed on CD133+ cells. However, knock-down of CD133 or CD26 did not affect short-term growth of HCT116 cells, and both cell-populations were equally resistant to various targeted drugs except irreversible ErbB inhibitors, which blocked growth and ERK1/2 phosphorylation in CD133- cells more efficiently than in CD133+ cells. Moreover, the MEK inhibitor AS703026 was found to overcome resistance against ErbB blockers in CD133+ cells. Together, CD133 and CD26 are markers of long-term growth and resistance to ErbB blockers in HCT116 cells, which may be mediated by constitutive ERK activity.
Keywords: Cancer stem cell, CD26, CD133, colon cancer, DPPIV, drug resistance, EGFR/ErbB, HCT116
Introduction
Colorectal cancer is a leading cause of morbidity and mortality in industrialized countries worldwide [1-4]. During the last decade, our knowledge about oncogene-dependent signaling and the mechanisms underlying progression of colorectal tumors has increased significantly, and has facilitated the development of novel anti-cancer agents [5-9]. These include conventional cytostatic drugs and molecular targeted drugs acting on various oncogenic kinases such as KIT, KDR, RAS, MEK or members of the EGF receptor (R) family [6-11]. Targeted drugs, including EGFR/ErbB blockers, have also been applied in combination with chemotherapy [7,10,12]. However, resistance against one or more drugs is still a challenge in the treatment of colon cancer patients, and the same holds true for other solid tumors. In colorectal cancer, the molecular mechanisms of resistance to anti-EGFR therapies are complex and are considered to be associated with mutations and hyperactivation of pro-oncogenic downstream effector molecules such as KRAS, BRAF or PIK3CA, or with inactivating mutations in tumor suppressor genes like PTEN [13]. Patients lacking mutations in pro-oncogenic genes have a higher probability to respond to EGFR-targeted therapy [13].
Numerous studies have shown that most if not all neoplasms are composed of two different fractions of cells - a partially differentiated population with limited capacity to divide and a second cell population exhibiting the capacity of unlimited proliferation and self-renewal, the so-called cancer stem cells (CSC) [14-17]. The ‘CSC-hypothesis’ predicts that therapy is curative only when eliminating all CSC in a given neoplasm [14-17]. Recent data suggest that colon CSC reside within the CD133+ fraction of the clone [18-21]. The CD133 antigen, also known as prominin-1 or AC133, is a glycoprotein expressed on various mesenchymal cells without known specific function [22,23]. However, recent data suggest that expression of CD133 on colon cancer cells is associated with drug resistance and with an increased metastatic potential [24-26]. The HCT116 cell line has been described as a useful model for studying the CD133+ CSC-phenotype in colon cancer cells [27-30]. In the present study, we used this cell line to study the role of CD133 in proliferation and survival of colon cancer cells and their resistance against ErbB-targeting drugs.
Materials and methods
Reagents
The irreversible EGFR(ErbB1)/ErbB2 inhibitor pelitinib (EKB-569) was kindly provided by Wyeth (Cambridge, MA, USA). The MEK inhibitor AS703026 was a kind gift from Dr. J. Ogden and Dr. M. Wolf (Merck Serono, Darmstadt, Germany). The irreversible pan-ErbB inhibitors canertinib (CI-1033) and afatinib (BIBW2992), the reversible EGFR inhibitor erlotinib, the reversible pan-ErbB inhibitor lapatinib, the reversible EGFR-blocker gefitinib, the PDGFR/VEGFR/FGFR-blocker sunitinib, the multi-kinase inhibitor sorafenib, the Abl/Src/Kit-antagonist dasatinib, the Bcr-Abl targeting nilotinib, the PDGFR/Kit/Abl specific imatinib, the reversible pan-ErbB inhibitor BMS-599626, the pan-Aurora inhibitor VX-680, the Hsp90 inhibitor 17-AAG, and the HDAC inhibitor vorinostat were purchased from ChemieTek (Indianapolis, IN, USA). A specification of monoclonal antibodies (mAbs) used in our study is shown in Table 1. RNeasy Mini Kit and HotStarTaq Master Mix Kit were obtained from QIAGEN (Hilden, Germany), First Strand cDNA Synthesis Kit from Roche-Applied-Science (Mannheim, Germany), and RT-PCR primers (MEK1, MEK2, CD133, β-actin) from Eurofins MWG Operon (Ebersberg, Germany). 3H-thymidine was purchased from Amersham (Buckinghamshire, UK) and the Vybrant MTT Cell Proliferation Assay Kit from Invitrogen (Carlsbad, CA, USA). Dulbecco’s Modified Eagle Medium (DMEM), phenol red-free Iscove’s MDM (IMDM), fetal calf serum (FCS), trypsin/EDTA, and L-glutamine were from Invitrogen (Carlsbad, CA, USA).
Table 1.
Monoclonal antibodies (mAb) and reactivity of bulk, CD133+ and CD133- HCT116 colon cancer cells
| mAb | Reactive Structure | CD | Source/Isotype | Fluorochrome | Manufacturer | Reactivity with HCT116* | ||
|---|---|---|---|---|---|---|---|---|
|
| ||||||||
| Bulk | CD133+** | CD133-** | ||||||
| L27 | B1 | 20 | m/IgG l | PE | BD-B | - | - | - |
| ML5 | Nectadrin | 24 | m/IgG2a | FITC | BD-B | - | - | - |
| M-A261 | DPP IV | 26 | m/IgG l | PE | BD-B | +++ | ++ | + |
| 581 | HPCA1 | 34 | m/IgG l | PE | BD-B | - | - | - |
| 515 | Pgp-1 | 44 | m/IgG l | PE | BD-B | ++++ | ++++ | ++++ |
| Hl30 | LCA | 45 | m/IgG l | FITC | BD-B | - | - | - |
| HI186 | Campath1 | 52 | m/IgG2b | PE | BioL | - | - | - |
| 487618 | CEA | 66e | m/IgG l | APC | R&D | ++++ | +++ | +++ |
| 5EIO | Thy1 | 90 | m/IgG l | FITC | BD-B | + | n.d. | n.d. |
| 166707 | Endoglin | 105 | m/IgG l | PE | R&D | +++ | +++ | ++ |
| LMM741 | G-CSFR | 114 | m/IgG l | PE | BD-B | + | + | + |
| 61708 | M-CSFR | 115 | m/IgG l | PE | R&D | - | - | - |
| 31916 | GM-CSFRα | 116 | m/IgG1 | PE | R&D | - | - | - |
| D2 | KIT | 117 | m/IgG l | PE | BD-B | - | - | - |
| 32703 | IL-3Rα | 123 | m/IgG l | PE | R&D | - | - | - |
| AC133 | AC133 | 133 | m/IgG l | PE | Mil-BT | +++*** | ++++ | - |
| BV10A4H2 | FLT-3 | 135 | m/IgG l | PE | BioL | + | - | - |
| 105902 | ALCAM | 166 | m/IgG l | PE | R&D | ++++ | ++++ | ++++ |
| MEM-260 | IRp60 | 300a | m/IgG l | PE | Abcam | - | - | - |
| 89106 | KDR | 309 | m/IgG l | PE | R&D | ++ | - | + |
| HEA-125 | EpCAM | 326 | m/IgG l | FITC | Mil-BT | ++++ | ++++ | ++++ |
| 95106 | MET | n.c. | m/IgG l | PE | R&D | ++++ | ++++ | ++++ |
| 33255 | IGF-lR | 221 | m/IgG l | PE | R&D | ++++ | ++++ | ++++ |
| 2A2 | LGR5 | n.c. | m/IgG1 | PE | Origene | + | + | + |
| EGFR-l | EGFR | n.c. | m/IgG2b | PE | BD-B | +++ | +++ | +++ |
| 191924 | ErbB2 | 340 | m/IgG2b | PE | R&D | +++ | +++ | +++ |
| 66223 | ErbB3 | n.c. | m/IgG1 | PE | R&D | +++ | +++ | +++ |
| 182818 | ErbB4 | n.c. | m/IgG2a | PE | R&D | + | + | ++ |
Score reactivity: ++++, 75.01-100% of cells positive; +++, 50.01-75% of cells positive; ++, 25.01-50% of cells positive; +, 10.01-25% of cells positive; -, 0-10% of cells reactive.
Sorted cells.
CD 133 was found to be expressed on a distinct subpopulation of bulk HCT116 cells.
APC, allophycocyanin; BD-B, Becton Dickinson Biosciences; Biol, BioLegend; FITC, fluorescein isothiocyanate; HPCA 1, human progenitor cell antigen-1; IGF, insulin-like growth factor; IL- 3, interleukin-3; LCA, leukocyte common antigen; Mil-BT, Miltenyi Biotec; n.c., not yet clustered; PE, phycoerythrin.
Culture of HCT116 cells
HCT116 human colon cancer cells were purchased from the German Resource Center for Biological Materials (Heidelberg, Germany). Cells were cultured in DMEM and 10% FCS and passaged using trypsin/EDTA. The identity of HCT116 was confirmed by flow cytometry and molecular investigations including short tandem repeat profiling [31], which was conducted at the German Resource Center for Biological Materials, and the presence of the KRAS 38G > A mutation was verified by DNA sequencing. Phenotyping and mutation analysis were repeated after multiple passages and after sorting into CD133+ and CD133- fractions.
Flow cytometry and cell sorting
HCT116 cells were stained with fluorochrome-conjugated mAbs directed against various cell surface antigens (Table 1). Antibody reactivity was determined by flow cytometry using a FACSCalibur (Becton Dickinson, San Diego, CA, USA) and FlowJo software (Tree Star, Ashland, OR, USA). Isotype-matched control antibodies were used in each experiment. CD133+ and CD133- HCT116 cells or CD26+ and CD26- HCT116 cells were purified by sorting on a FACSAria (BD Biosciences). The purity of sorted cells was up to 98%, and cell viability was > 90% in each case.
Reverse transcription PCR (RT-PCR)
PCR primers specific for MEK1, MEK2, AC133/CD133, and β-actin are given in Table 2. RT-PCR reactions were performed using First Strand cDNA Synthesis Kit and HotStarTaq Master Mix Kit as described [32].
Table 2.
PCR primers
| Protein | Orientation | Primer Sequence | PCR Product Length |
|---|---|---|---|
| MEK1 (MAP2K1) | Forward | 5’ AACTCTCCGTACATCGTGGG 3’ | |
| Reverse | 5’ GGCGACATGTAGGACCTTGT 3’ | 332 bp | |
| MEK2 (MAP2K2) | Forward | 5’ CGTACCTCCGAGAGAAGCAC 3’ | |
| Reverse | 5’ GGCAAAATCCACTTCTTCCA 3’ | 596 bp | |
| CD133 | Forward | 5’ TCAGGATTTTGCTGCTTGTG 3’ | |
| Reverse | 5’ GCAGTATCTAGAGCGGTGGC 3’ | 480 bp | |
| β-actin | Forward | 5’ ATGGATGATGATATCGCCGCG 3’ | |
| Reverse | 5’ CTAGAAGCATTTGCGGTGGACGATGGAGGGGCC 3’ | 1020 bp |
MAP2K1, mitogen-activated protein kinase 2 kinase 1; MAP2K2, mitogen-activated protein kinase 2 kinase 1; MEK, MAP/ERK kinase.
Proliferation assays
HCT116 cells (bulk and fractions) were incubated with various concentrations (0.001-10 µM) of ErbB inhibitors or other drugs at 37°C for 48 or 72 hours. Cell survival was analyzed using the Vybrant MTT Cell Proliferation Assay Kit following the recommendation of the manufacturer (Invitrogen Molecular Probes) [33]. Synthesis of DNA was determined by measuring 3H-thymidine uptake as reported [34]. In select experiments, combinations of pelitinib and AS703026 were applied (fixed ratio of drug concentrations) before measuring proliferation of HCT116 cells. Drug-interactions (additive versus synergistic) were determined by calculating combination index (CI) values using Calcusyn software (Calcusyn; Biosoft, Ferguson, MO). A CI value of 1 indicates an additive effect and CI values below 1 synergistic drug actions. In a separate set of experiments, DNA synthesis was determined by a BrdU colorimetric immunoassay according to the manufacturer’s instructions (Roche-Applied-Science, Mannheim, Germany). All experiments were performed in triplicates.
Analysis of apoptosis and cell cycle progression
Unfractionated HCT116 cells and sorted fractions (CD133+ versus CD133- and CD26+ versus CD26-) were incubated with various concentrations of ErbB inhibitors (0.001-10 µM) for 48 or 72 hours and apoptosis was determined by staining externalized membrane phosphatidylserine with annexin V-FITC (BenderMedSystems, Vienna, Austria) or by labeling active caspase-3 with a PE-conjugated mAb (BD Biosciences). In addition, cell cycle distribution was determined using the DNA binding fluorochrome propidium iodide and labeled cells were analyzed by flow cytometry on a FACSCalibur (Becton Dickinson).
RNA interference-mediated knockdown of CD133 and CD26
Cells (24 × 103/cm2) were transfected with siRNA using siLentFectTM Lipid Reagent (Bio-Rad Laboratories, Hercules, USA) following the manufacturer’s protocol. Cells were incubated for 72 hours with 20 nM CD133 siRNA (sc-42820; Santa Cruz Biotechnology, Santa Cruz, CA) or 20 nM scramble control siRNA (sc-37007) at 37°C and 5% CO2. For knockdown of CD26, a pLKO.1 clone containing an shRNA targeting human CD26 (5’-GACTGAAGTTATACTCCTTAA-3’) was obtained from Open Biosystems (Huntsville, AL). Recombinant VSV-G pseudotyped lentiviruses were produced as described [35]. Cells were transduced in the presence of polybrene (7 µg/ml) and selected with puromycin (2 µg/ml) for 48 hours. Knockdown of CD133 and CD26 was confirmed by flow cytometry.
Western blot analysis
For cell signaling analyses, unfractionated or sorted (CD133+ and CD133-) HCT116 cells were starved in serum-free medium (24 hours) and then exposed to pelitinib (5 µM), canertinib (10 µM), afatinib (10 µM), or 0.1% DMSO as solvent control at 37°C for 6 hours. Cells were then challenged for 5 minutes with 100 ng/ml recombinant human EGF (Sigma, St. Louis, MO, USA) and 1 nM recombinant human heregulin 1 (HRG 1; Thermo Fisher Scientific, Fremont, CA, USA). Proteins (30 µg/lane) were then subjected to Western blotting as described [36] using antibodies against EGFR, phospho-EGFR(Tyr1068), AKT, phospho-AKT(Ser473), phospho-ERK1/2, S6, phospho-S6(Ser240/244) (Cell Signaling Technology, Danvers, MA, USA), ErbB2, phospho-ErbB2(Tyr1248), actin, (Santa Cruz Biotechnology, Santa Cruz, CA, USA), and ERK1/2 (Upstate Biotechnology, Lake Placid, NY or Santa Cruz: sc-93). Secondary antibodies were peroxidase-tagged donkey-anti-rabbit (Promega, Madison, WI, USA), donkey-anti-goat IgG (Santa Cruz Biotechnology), goat anti-rabbit IgG (Cell Signaling Technology), or peroxidase-labeled donkey anti-goat IgG (Santa Cruz Biotechnology).
Gene chip experiments
To define mRNA expression patterns in CD133+ and CD133- HCT116 cells, DNA microarray analyses were performed using genome-wide human U133 2.0 plus GeneChips (Affymetrix, Santa Clara, CA) as described according to manufacturer’s protocols (https://www.affymetrix.com). Robust Multichip Average signal extraction and normalization were done as reported (http://www.bioconductor.org/) [37]. Changes in mRNA expression levels were calculated as mRNA ratio between CD133+ and CD133- HCT116 cells. mRNA expression data are available at Gene Expression Omnibus: http://www.ncbi.nlm.nih.gov/geo/query/acc.cgi?acc=GSE33504S and http://www.ncbi.nlm.nih.gov/geo/query/acc.cgi?acc=GSE38049. Statistical analyses were performed with R-Bioconductor [38]. For annotation, R-packages hugene10st.db_1.0.2 and hugene10stv1cdf_1.0.0 were used. For these analyses, we filtered genes with an expression level greater than log2 (100) in at least 2 of 6 samples and an inter-quartile range > 0.3. To assess differentially expressed genes we used moderated paired t-tests with empirical Bayes shrinkage of the standard errors (R-package: limma). To detect statistical significant pathways, gene set enrichment analysis was performed with R-package sigPathway. In pathway analyses, we focused on genes involved in cell growth and drug resistance.
Results
CD133+ HCT116 cells outnumber CD133- HCT116 cells in culture
As determined by flow cytometry, HCT116 cells are composed of a CD133+ and a CD133- cell population (Figure 1A). The differential expression of CD133 in sorted cell fractions was confirmed by RT-PCR and gene chip analysis. After serial passage, CD133+ cells were found to outnumber CD133- cells in long-term culture (Figure 1B). Even when sorted for CD133- cells, minute amounts of residual CD133+ cells (typically <5%) were outnumbering CD133- cells over time (Figure 1C). Surprisingly, in short-term culture, CD133+ and CD133- cells did not show differences in cell viability, proliferation rate or cell cycle distribution. Consequently, we wondered whether CD133+ cells may secrete an inhibitory factor that suppresses growth of CD133- cells. However, supernatants obtained from CD133+ cells did not affect the growth of CD133- cells (not shown).
Figure 1.
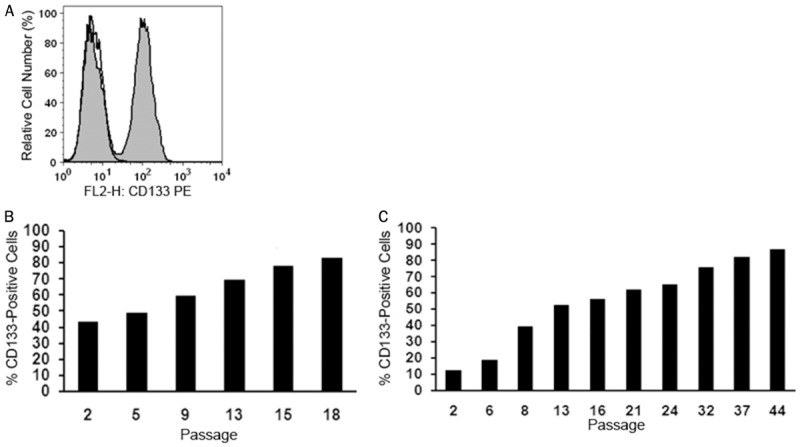
Long-term growth advantage of CD133+ HCT116 colon cancer cells. (A) Immunofluorescent labeling for CD133 followed by flow cytometry clearly distinguished a CD133+ from a CD133- cell population (grey histogram). An isotype-matched non-immune antibody was used as negative control (open histogram). Unfractionated cells (B) and sorted CD133- cells (C) were subcultured for the indicated number of passages and the proportion of outgrowing CD133+ cells was determined over time by flow cytometry in each cell population.
Target protein expression in CD133+ and CD133- cells
Flow cytometry revealed that CD133+ and CD133- fractions (purity 90-98%) exhibit essentially the same cell surface membrane phenotype. Both cell subsets were found to express various tissue-specific and stem cell-related receptor antigens, including CD44, CD166 (ALCAM) and CD326 (EpCAM). In addition, both fractions stained positive for major drug targets, including EGFR (ErbB1), ErbB2, ErbB3, ErbB4, c-MET, and IGFR-1 (Table 1). Moreover, DNA sequencing identified mutant KRAS (38G > A) in both CD133+ and CD133- cells. Altogether, no obvious differences in target expression profiles were detected between CD133+ and CD133- HCT116 cells.
Comparative gene expression analysis of CD133+ and CD133- cells
We next screened for differentially expressed genes by global analysis of mRNA transcripts in CD133+ and CD133- HCT116 cells. Using DNA microarrays we found that CD133+ cells express markedly higher levels of various marker genes, including CD26, when comparing to CD133-cells (Table 4A). The differential expression of CD133 and CD26 was also detected at the protein level using flow cytometry (Table 1). Moreover, comparative pathway analyses on DNA microarrays revealed distinct expression of growth-regulatory, cell communication and motility pathways (Tables 3, 4 and 5) as a function of the presence/absence of CD133, corroborating recent data published by Botchkina et al [39].
Table 4.
Top 10 upregulated and top 10 downregulated genes in CD133+ relative to CD133- HCT116 cells
| A. Top 10 Upregulated Genes | |||
|
| |||
| Gene Symbol | Gene Name | Log Fold Change | P-Value |
|
| |||
| PROM1 | prominin 1 | 2.8 | 0.0106 |
| EHF | ets homologous factor | 2.3 | 0.0106 |
| NRIP1 | nuclear receptor interacting protein 1 | 2.2 | 0.0114 |
| GPR110 | G protein-coupled receptor 110 | 1.7 | 0.0188 |
| IL18 | interleukin 18 (interferon-gamma-inducing factor) | 1.6 | 0.0114 |
| DPP4 | dipeptidyl-peptidase 4 (CD26, adenosine deaminase complexing protein 2) | 1.4 | 0.0114 |
| SEMA3A | sema domain, immunoglobulin domain (Ig), short basic domain, secreted, (semaphorin) 3A | 1.4 | 0.0114 |
| 7A5 | putative binding protein 7a5 | 1.4 | 0.0114 |
| LOC390345 | similar to ribosomal protein L10 | 1.3 | 0.0188 |
| SNORA22 | small nucleolar RNA, H/ACA box 22 | 1.3 | 0.0396 |
|
| |||
| B. Top 10 Downregulated Genes | |||
|
| |||
| Gene Symbol | Gene Name | Log Fold Change | P-Value |
|
| |||
| SLC2A3 | solute carrier family 2 (facilitated glucose transporter), member 3 | -1.7 | 0.0167 |
| ODZ3 | odz, odd Oz/ten-m homolog 3 (Drosophila) | -1.7 | 0.0106 |
| PEG10 | paternally expressed 10 | -1.5 | 0.0114 |
| MAP1B | microtubule-associated protein 1B | -1.4 | 0.0106 |
| GLIS3 | GLIS family zinc finger 3 | -1.4 | 0.0188 |
| CTGF | connective tissue growth factor | -1.3 | 0.0352 |
| THBS1 | thrombospondin 1 | -1.3 | 0.0210 |
| SEMA3C | sema domain, immunoglobulin domain (Ig), short basic domain, secreted, (semaphorin) 3C | -1.2 | 0.0377 |
| RBM24 | RNA binding motif protein 24 | -1.2 | 0.0210 |
| CDK6 | cyclin-dependent kinase 6 | -1.1 | 0.0114 |
Expression of mRNA levels in CD133+ cells compared to CD133- cells (methods and details are described in the text). Gene symbols and gene names (according to the Affymetrix hugene1.0-chip) are given as well as the log-fold change [log(mean group CD133+) minus log(mean group CD133-)] and the corresponding P-value of the t-test (adjusted for multiplicity using the method of Benjamini and Hochberg) of the top 10 up- and downregulated genes. A P-value <0.05 is indicating a significant difference between CD133+ and CD133- cells.
Table 3.
Major pathways upregulated in CD133+ relative to CD133- HCT116 cells
| Gene Set Category | Pathway | Set Size* | Percent Up† | NTk q-value†† | NEk q-value††† |
|---|---|---|---|---|---|
| GO:0006928 | cell motility | 25 | 40 | 0.0000 | 0.0000 |
| GO:0051674 | localization of cell | 25 | 40 | 0.0000 | 0.0000 |
| GO:0040011 | locomotion | 25 | 40 | 0.0000 | 0.0000 |
| KEGG:04510 | Focal adhesion | 35 | 23 | 0.0000 | 0.0000 |
| KEGG:04810 | Regulation of actin cytoskeleton | 28 | 32 | 0.0000 | 0.0000 |
| SuperArray | Insulin Signaling Pathway | 21 | 29 | 0.0000 | 0.0000 |
| GO:0000902 | cellular morphogenesis | 39 | 46 | 0.0000 | 0.0000 |
| GO:0030246 | carbohydrate binding | 29 | 38 | 0.0000 | 0.0000 |
| GO:0008092 | cytoskeletal protein binding | 60 | 42 | 0.0000 | 0.0000 |
| GO:0040007 | growth | 37 | 46 | 0.0000 | 0.0000 |
| GO:0003779 | actin binding | 38 | 39 | 0.0000 | 0.0000 |
| GO:0007167 | enzyme linked receptor protein signaling pathway | 22 | 50 | 0.0230 | 0.0000 |
| GO:0001558 | regulation of cell growth | 24 | 50 | 0.0000 | 0.0000 |
| GO:0040008 | regulation of growth | 27 | 52 | 0.0000 | 0.0000 |
| SuperArray | Nitric Oxide | 26 | 31 | 0.0230 | 0.0000 |
| GO:0030695 | GTPase regulator activity | 39 | 41 | 0.0000 | 0.7791 |
| SuperArray | EGF / PDGF Signaling Pathway | 24 | 25 | 0.0000 | 0.7791 |
| SuperArray | Hypoxia Signaling Pathway | 24 | 38 | 0.0381 | 0.0000 |
| GO:0008361 | regulation of cell size | 30 | 47 | 0.0000 | 0.7791 |
| GO:0016049 | cell growth | 30 | 47 | 0.0000 | 0.7791 |
| SuperArray | Breast Cancer / Estrogen Receptor Signaling | 29 | 34 | 0.0741 | 0.0000 |
| GO:0004857 | enzyme inhibitor activity | 25 | 48 | 0.0881 | 0.0000 |
| GO:0007243 | protein kinase cascade | 52 | 40 | 0.0381 | 0.0000 |
| GO:0015629 | actin cytoskeleton | 23 | 57 | 0.0488 | 0.0000 |
| GO:0009966 | regulation of signal transduction | 46 | 43 | 0.0488 | 0.0000 |
| SuperArray | G-Protein Coupled Receptors Signaling PathwayFinder | 22 | 41 | 0.0881 | 0.0000 |
| GO:0005578 | extracellular matrix (sensu Metazoa) | 23 | 22 | 0.0000 | 1.0000 |
| GO:0031012 | extracellular matrix | 23 | 22 | 0.0000 | 1.0000 |
| GO:0006066 | alcohol metabolism | 58 | 64 | 0.0000 | 1.0000 |
| GO:0006820 | anion transport | 21 | 33 | 0.0938 | 0.0000 |
| GO:0005996 | monosaccharide metabolism | 39 | 69 | 0.0256 | 1.0000 |
| GO:0006006 | glucose metabolism | 28 | 71 | 0.0256 | 1.0000 |
| GO:0015077 | monovalent inorganic cation transporter activity | 26 | 85 | 0.0256 | 1.0000 |
| GO:0019318 | hexose metabolism | 38 | 68 | 0.0256 | 1.0000 |
| GO:0031410 | cytoplasmic vesicle | 20 | 55 | 0.1017 | 0.0000 |
| GO:0016810 | hydrolase activity, acting on carbon-nitrogen (but not peptide) bonds | 20 | 50 | 0.1649 | 0.0000 |
| GO:0030529 | ribonucleoprotein complex | 138 | 79 | 0.0256 | 1.0000 |
Expression of mRNA levels in CD133+ cells compared to CD133- cells (methods and details are described in the text).
Set Size: Number of genes included in the pathway;
Percent Up: Percent upregulated genes in the pathway;
NTk q-value: A multiplicity adjusted P-value <0.05 indicates that the genes in a gene set do not show the same pattern of associations with the group labels compared with the rest of the genes;
NEk q-value: A multiplicity adjusted q-value <0.05 indicates that the gene set contains genes whose expression levels are associated with the group.
Table 5.
Comparative pathway analysis of expression of growth regulatory genes in CD133+ as opposed to CD133- HCT116 cells
| Gene Symbol | Gene Name | Mean CD133+ | Mean CD133- | StDev CD133+ | StDev CD133- | P-Value |
|---|---|---|---|---|---|---|
| ACTL6A | actin-like 6A | 8.2 | 8.1 | 0.3 | 0.4 | 0.6729 |
| CAMK2D | calcium/calmodulin-dependent protein kinase (CaM kinase) II delta | 7.9 | 8.4 | 0.2 | 0.3 | 0.1264 |
| CTGF | connective tissue growth factor | 7.0 | 8.3 | 0.1 | 0.6 | 0.0622 |
| IGFBP4 | insulin-like growth factor binding protein 4 | 6.4 | 6.4 | 0.2 | 0.3 | 0.8422 |
| IGFBP6 | insulin-like growth factor binding protein 6 | 8.3 | 8.8 | 0.2 | 0.3 | 0.0894 |
| CYR61 | cysteine-rich, angiogenic inducer, 61 | 8.5 | 9.5 | 0.1 | 0.2 | 0.0059 |
| QSOX1 | quiescin Q6 sulfhydryl oxidase 1 | 8.3 | 8.2 | 0.5 | 0.4 | 0.7980 |
| SHC1 | SHC (Src homology 2 domain containing) transforming protein 1 | 8.7 | 9.0 | 0.1 | 0.1 | 0.0124 |
| YEATS4 | YEATS domain containing 4 | 8.2 | 7.9 | 0.3 | 0.4 | 0.4214 |
| LTBP4 | latent transforming growth factor beta binding protein 4 | 8.0 | 8.1 | 0.4 | 0.4 | 0.7153 |
| BLZF1 | basic leucine zipper nuclear factor 1 (JEM-1) | 8.0 | 7.9 | 0.3 | 0.3 | 0.8172 |
| RUVBL1 | RuvB-like 1 (E. coli) | 9.1 | 8.8 | 0.3 | 0.4 | 0.4854 |
| SOCS1 | suppressor of cytokine signaling 1 | 6.8 | 6.7 | 0.1 | 0.3 | 0.4293 |
| SOCS2 | suppressor of cytokine signaling 2 | 6.7 | 6.6 | 0.2 | 0.3 | 0.4856 |
| ENOX2 | ecto-NOX disulfide-thiol exchanger 2 | 6.5 | 6.3 | 0.3 | 0.3 | 0.5228 |
| BRD8 | bromodomain containing 8 | 7.2 | 7.5 | 0.2 | 0.4 | 0.2988 |
| TMEM97 | transmembrane protein 97 | 9.3 | 9.5 | 0.2 | 0.3 | 0.6351 |
| CRIM1 | cysteine rich transmembrane BMP regulator 1 (chordin-like) | 8.5 | 9.3 | 0.2 | 0.4 | 0.0360 |
| ING3 | inhibitor of growth family, member 3 | 7.0 | 7.0 | 0.3 | 0.4 | 0.9326 |
| SOCS4 | suppressor of cytokine signaling 4 | 6.6 | 6.4 | 0.3 | 0.5 | 0.5587 |
| BTG1 | B-cell translocation gene 1, anti-proliferative | 8.4 | 8.7 | 0.4 | 0.3 | 0.4571 |
| PPP2CA | protein phosphatase 2 (formerly 2A), catalytic subunit, alpha isoform | 9.9 | 9.9 | 0.3 | 0.3 | 0.8012 |
| PPP2R1B | protein phosphatase 2 (formerly 2A), regulatory subunit A, beta isoform | 8.2 | 8.2 | 0.2 | 0.2 | 0.9676 |
| RB1 | retinoblastoma 1 (including osteosarcoma) | 8.0 | 8.2 | 0.3 | 0.3 | 0.5369 |
Expression of mRNA levels in CD133+ cells compared to CD133- cells (methods and details are described in the text). Gene symbols and gene names (according to the Affymetrix human gene1.0 chip) are given as well as the mean values of the CD133+ and CD133- cells and the corresponding standard deviations (StDev). Furthermore, the P-values of the t-test to compare CD133+ to CD133- cells for each gene are shown. A P-value <0.05 indicates a significant difference between CD133+ and CD133- cells.
Irreversible ErbB inhibitors block the growth of CD133- but not of CD133+ cells
Despite the large spectrum of recognized targets (see Materials and methods for details), most of the drugs applied in this study failed to induce significant growth inhibition in unfractionated HCT116 cells, indicating pronounced drug resistance in this cell model. Nevertheless, inhibitors that bind to and interfere with ErbB receptor function in an irreversible manner, such as pelitinib, canertinib, and afatinib, effectively blocked cell growth when applied in concentrations ≥ 1 µM. The dose-dependent decline of cell numbers, evidenced by MTT assay (Figure 2A), correlated closely with diminished DNA synthesis determined by BrdU incorporation or 3H-thymidine uptake (not shown). In contrast, flow cytometry analyses using annexin V or an antibody against activated caspase-3 failed to detect programmed cell death. These data suggest that irreversible ErbB blockers cause cell growth arrest rather than apoptosis in HCT116 cells. Remarkably, CD133- cells proved to be more sensitive to these ErbB inhibitors than CD133+ cells (Figure 2B and 2C).
Figure 2.
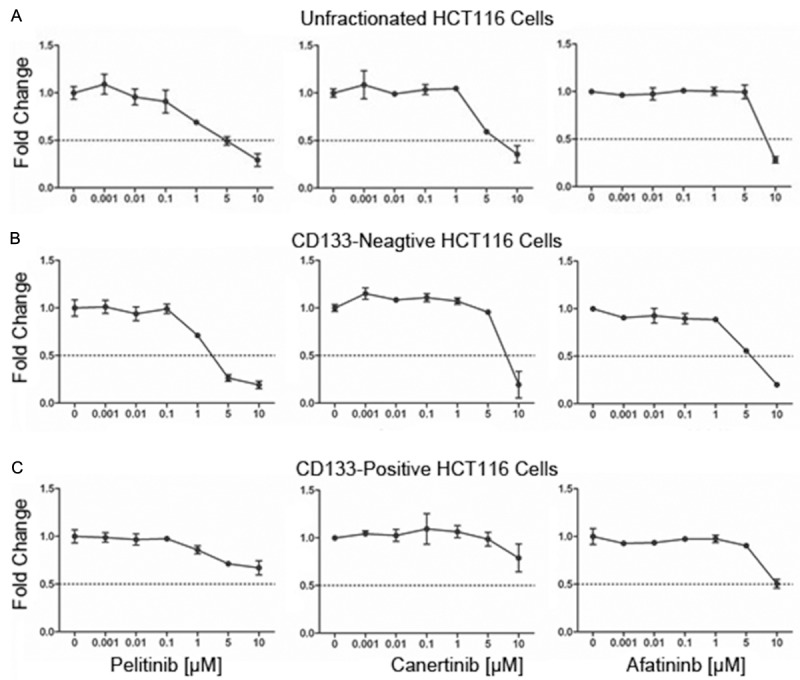
CD133+ HCT116 colon cancer cells are less sensitive to growth inhibition by the irreversible ErbB inhibitors pelitinib, canertinib, and afatinib as determined by MTT assay. Unfractionated (A), sorted CD133- (B) or CD133+ cells (C) were incubated for 72 hours with indicated concentrations of pelitinib, canertinib or afatinib. In vehicle control (0.1% DMSO), optical density, which is proportional to cell number, has been arbitrarily set at 1 and values from treated cultures have been related to control and are given as ‘fold change’. Means ± SD, n = 3.
Effects of knockdown of CD133 or CD26 on cell growth and on the sensitivity against ErbB-inhibitory drugs
The obtained data suggested an association between CD133 expression and resistance against ErbB blockers. Surprisingly, siRNA-mediated knockdown of CD133 expression in CD133+ cells (Figure 3A) did not affect the growth rate of the cells (Figure 3B) nor did it decrease the resistance against pelitinib, canertinib or afatinib relative to control siRNA-transfected CD133+ cells (Figure 3C) suggesting that other proteins co-expressed with CD133 such as CD26 may confer inhibitor resistance in CD133+ cells. However, specific knockdown of CD26, which is typically co-expressed in CD133+ HCT116 cells (Figure 4A), failed to alter the growth rate (not shown) or the sensitivity of the cells against irreversible ErbB antagonists (Figure 4B) indicating that yet other still unidentified differentially activated genes must confer ErbB drug resistance in CD133+ cells. The efficacy of CD133 or CD26 knockdown was confirmed by flow cytometry (Figures 3A and 4A) and Western blotting (not shown), respectively.
Figure 3.
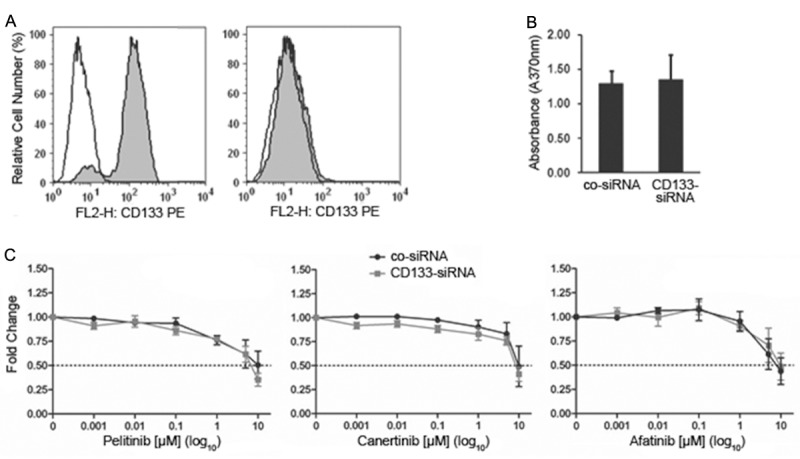
Knockdown of CD133 in CD133+ HCT116 colon cancer cells does not affect cell growth and ErbB drug resistance. (A) Flow cytometry analysis revealed that sorted CD133+ cells transfected with a non-targeting control siRNA retain high levels of CD133 (left panel), whereas a CD133-targeting siRNA causes complete knockdown of CD133 (right panel). (B) Growth of the sorted CD133+ cell population transfected either with non-targeting control siRNA (co-siRNA) or with CD133 siRNA was determined by BrdU colorimetric incorporation assay. (C) Sorted CD133+ cells transfected with non-targeting control siRNA (co-siRNA) or with CD133 siRNA were incubated for 72 hours with the indicated concentrations of the irreversible ErbB inhibitors pelitinib, canertinib or afatinib and then subjected to an MTT assay. In vehicle control (0.1% DMSO), optical density, which is proportional to cell number, has been arbitrarily set at 1 and values from treated cultures have been related to control and are given as ‘fold change’. Means ± SD, n = 3.
Figure 4.
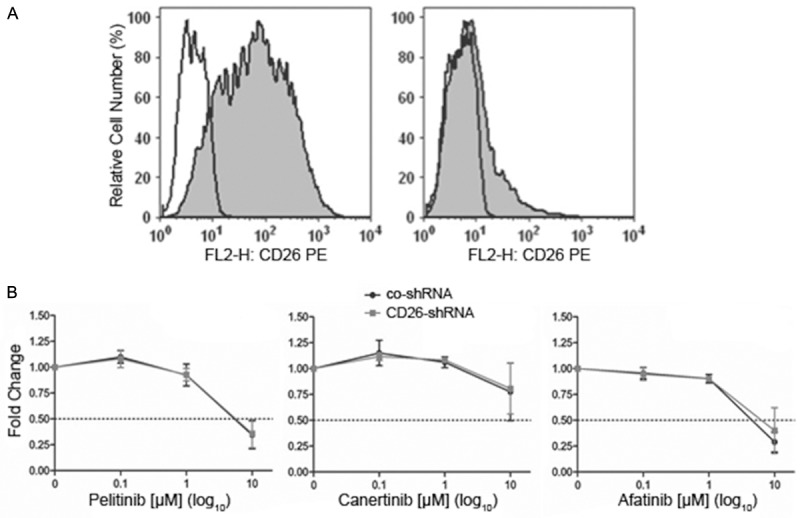
Knockdown of CD26 in CD133+ HCT116 colon cancer cells does not affect cell growth and ErbB drug resistance. (A) Flow cytometry analysis revealed that introduction of a non-targeting control shRNA into CD133+ cells does not lower the expression of CD26 (left panel), whereas a CD26-targeting shRNA causes strong downregulation of CD26 (right panel). (B) Sorted CD133+ cells transfected with non-targeting control shRNA (co-shRNA) or with CD26 shRNA were incubated for 72 hours with the indicated concentrations of the irreversible ErbB inhibitors pelitinib, canertinib or afatinib and then subjected to an MTT assay. In vehicle control (0.1% DMSO), optical density, which is proportional to cell number, has been arbitrarily set at 1 and values from treated cultures have been related to control and are given as ‘fold change’. Means ± SD, n = 3.
Effects of irreversible ErbB inhibitors on the phosphorylation of ErbB receptors and downstream effectors in CD133+ and CD133- cells
Western blot analyses revealed that pelitinib, canertinib and afatinib efficiently abrogated phosphorylation of EGFR (ErbB1), ErbB2, AKT and S6 in unfractionated as well as in CD133+ and CD133- cells. In contrast, phosphorylation of ERK1,2 was only blocked in the ErbB drug sensitive CD133- fraction, but not in the ErbB drug resistant CD133+ nor in the unfractionated cell population (Figure 5). Therefore, in the latter two less responsive cell populations, ErbB drug-dependent growth inhibition appears primarily mediated through silencing of the ErbB/RAS/PI3K/AKT/mTOR pathway, whereas in the more sensitive CD133- cells not only this pathway but also ErbB/RAS/MAPK signaling gets abrogated by the drugs, which may reinforce the antiproliferative response. Thus, the MAPK cascade may harbor crucial markers for the differential ErbB drug response of CD133- versus CD133+ cells.
Figure 5.
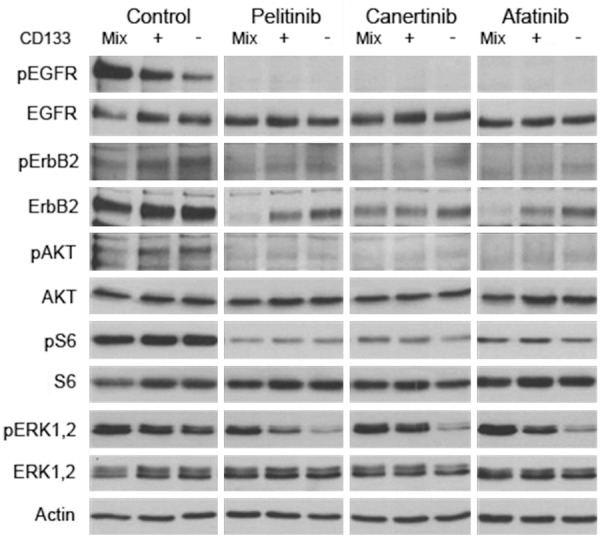
Effects of a 24-hours exposure of bulk HCT116 colon cancer cells (Mix) and of sorted CD133+ or CD133- cells to the irreversible ErbB inhibitors pelitinib, canertinib, or afatinib on the expression of phosphorylated (p) and total forms of EGFR, ErbB2, AKT, S6, and ERK1,2 as determined by Western blot analysis. Note that ErbB inhibitors lower pERK1/2 levels specifically in ErbB drug sensitive CD133- cells, but not in bulk or in CD133+ cells.
The MEK inhibitor AS703026 induces cell growth arrest and overcomes ErbB inhibitor resistance
Since RAS downstream signaling via MAPK, in addition to PI3K, appears crucial for HCT116 cell growth we wondered whether co-silencing of ErbB and MAPK may be able to restore ErbB drug sensitivity in resistant CD133+ cells. Accordingly, the MEK inhibitor AS703026 was found to block growth of all HCT116 cell populations irrespective of expression of CD133 or CD26 (Figure 6A). Most importantly, however, this MEK inhibitor combined with an ErbB antagonist induced synergistic growth inhibition (Figure 6B). These data suggest that the MAPK pathway may harbor crucial markers for ErbB drug resistance in CD133+ HCT116 cells and that MEK-inhibition is a promising approach to overcome ErbB drug resistance in RAS-transformed colon cancer (stem) cells.
Figure 6.
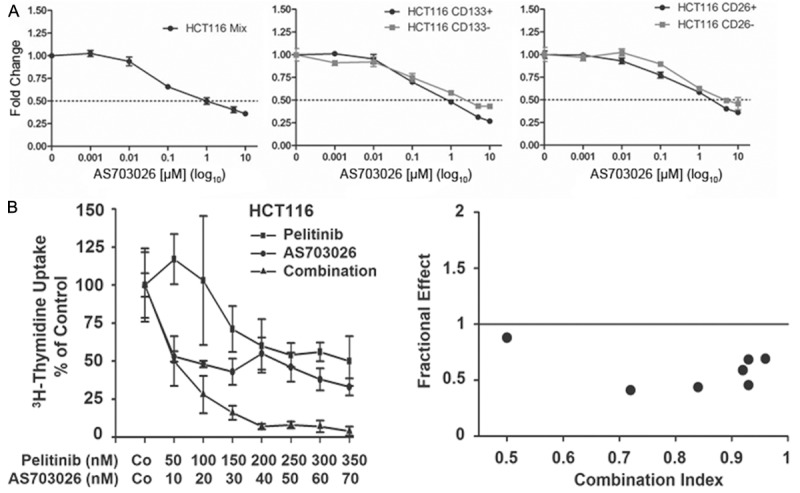
Effect of the MEK inhibitor AS703026 on the growth and the ErbB drug resistance of HCT116 colon cancer cells. (A) Unfractionated (left panel, Mix), sorted CD133+ and CD133- (middle panel), and sorted CD26+ and CD26- cells (right panel) were incubated for 72 hours with the indicated concentrations of AS703026 and then subjected to an MTT assay. In vehicle control (0.1% DMSO), optical density, which is proportional to cell number, has been arbitrarily set at 1 and values from treated cultures have been related to control and are given as ‘fold change’. Means ± SD, n = 3. (B) Bulk cells were incubated with the indicated concentrations of pelitinib, AS703026 or a combination of both drugs held at a fixed concentration-ratio of 5:1 for 48 hours and DNA synthesis was measured by 3H-thymidine uptake. Results are expressed as percent of control and represent the mean ± SD of triplicate determinations (left panel). Moreover, the combination index for exposure to pelitinib along with AS703026 is given (right panel). An index of <1 indicates synergistic drug interaction.
Discussion
Primary and acquired resistance against conventional and molecular targeted drugs is a major obstacle for successful treatment of colon cancer. Resistance of a subset of colorectal cancers to anti-EGFR therapy is associated with alterations in downstream effectors of the EGFR pathway including KRAS, BRAF, PIK3CA or PTEN [13]. However, not all alterations in RAS are necessarily associated with EGFR drug resistance. In metastatic colorectal cancer we recently identified a mutation in KRAS (p.G13D) that confers sensitivity to the EGFR blocking antibody cetuximab [40]. There is preclinical and clinical evidence suggesting that multiple tumor-specific features and molecular lesions contribute to drug resistance. Therefore, accessory lesions may act together with constitutively active RAS to yield a more resistant phenotype. It is thus of particular importance to identify additional mechanisms of drug resistance.
Colon cancer stem cells may reside within the CD133+ cell population [18-20]. In agreement with previous data we demonstrate that expression of CD133 (prominin-1) is associated with a long-term growth advantage of HCT116 cells relative to cells lacking this transmembrane glycoprotein [27-30]. In contrast, in short-term bioassays we were unable to define any gain in growth and survival of CD133+ versus CD133- cells. Both cell subsets invariably express hyperactivated mutant KRAS (38G > A) and are characterized by an almost identical repertoire of membrane proteins. Consequently, we hypothesized that small modifications in multiple gene sets and pathways may cause subtle functional differences in CD133+ cells that orchestrate to produce a robust long-term growth advantage in these cells. Accordingly, gene array analyses revealed several pathways related to cell growth and motility being upregulated in CD133+ HCT116 cells relative to CD133- cells. In contrast, no major differences in expression of drug resistance genes were found. Moreover, major drug targets including the EGFR/ErbB family (EGFR or ErbB1, ErbB2, ErbB3 and ErbB4) were expressed independently of CD133. Here we examined the anti-cancer efficacy of various reversible and irreversible ErbB blockers in cultures of HCT116 cells. While the reversible drugs erlotinib, gefitinib, lapatinib, and BMS599626 were not effective, irreversible ErbB blockers such as pelitinib, canertinib and afatinib dose-dependently reduced growth of HCT116 cells. Interestingly, CD133- cells were found to be more sensitive to growth inhibition by irreversible blockers than CD133+ and unfractionated HCT116 cells. Thus, it was tempting to speculate that CD133 is associated with resistance against irreversible ErbB drugs. Unexpectedly, however, genetic knock-down of CD133 failed to reestablish sensitivity in CD133+ cells. This data suggests that yet unidentified accessory factors that have been co-selected during enrichment of CD133+ cells may confer ErbB drug resistance. Accordingly, we observed that CD133+ cells invariably overexpress CD26, which has recently been proposed as a marker for metastatic and drug-resistant colorectal cancer cells [41]. Unfortunately, however, knock-down of CD26 in CD133+ cells also failed to restore drug sensitivity arguing for yet other mechanisms of resistance. Moreover, phosphorylation of AKT and S6 was found to persist in all drug-treated HCT116 cell populations irrespective of CD133 expression as demonstrated by Western blot analysis. Notably, however, we observed specific downregulation of phosphorylated ERK1/2 in drug-sensitive CD133-, but not in resistant CD133+ or unfractionated cells. This indicates that constitutive MAPK hyperactivation obviously promotes ErbB drug resistance in CD133+ cells. These findings imply that subtle differences in the circuitry of ErbB, KRAS, RAF and PI3K, particularly at the bifurcation of RAS towards RAF or PI3K, do exist between CD133- and CD133+ cells and that this disparity contributes to relative resistance against ErbB kinase inhibitors. Specifically, in cells lacking CD133, RAS proteins are obviously less autonomous and dominant (i.e. more dependent on activation through upstream receptors) in activating downstream RAF, MEK and ERK1,2 than in cells expressing CD133. However, the definitive molecular link of CD133 with RAS has yet to be identified.
Since activation of ERK appears associated with ErbB drug resistant growth of HCT116 cells, we wondered whether abrogation of ERK activity may overcome resistance against ErbB blockers. Given as single drug, AS703026 - an inhibitor of the upstream kinase MEK - was found to block HCT116 cell growth even in ErbB inhibitor resistant CD133+ cells. Intriguingly, this compound was found to synergistically cooperate with irreversible ErbB antagonists in growth control and can overcome ErbB drug resistance in HCT116 cells. In conclusion, we present evidence demonstrating that expression of the cancer stem cell marker CD133 is associated with growth advantage and resistance against irreversible ErbB inhibitors in colon cancer (stem) cells, which can be overcome by concurrent blockade of MEK signaling.
Acknowledgements
We like to thank Alexander Selzer and Regina Hoffmann for skillful technical assistance. This study was in part supported by a Cancer Stem Cell Grant of the Medical University of Vienna, a Research Grant from Merck-Serono (Darmstadt-Germany) and a research grant of Merck Austria.
Disclosure of conflict of interest
ES and PV were supported by a research grant from Merck.
References
- 1.Hegde SR, Sun W, Lynch JP. Systemic and targeted therapy for advanced colon cancer. Expert Rev Gastroenterol Hepatol. 2008;2:135–149. doi: 10.1586/17474124.2.1.135. [DOI] [PubMed] [Google Scholar]
- 2.Gralow J, Ozols RF, Bajorin DF, Cheson BD, Sandler HM, Winer EP, Bonner J, Demetri GD, Curran W Jr, Ganz PA, Kramer BS, Kris MG, Markman M, Mayer RJ, Raghavan D, Ramsey S, Reaman GH, Sawaya R, Schuchter LM, Sweetenham JW, Vahdat LT, Davidson NE, Schilsky RL, Lichter AS American Society of Clinical Oncology. Clinical cancer advances 2007: major research advances in cancer treatment, prevention, and screening-a report from the American Society of Clinical Oncology. J. Clin. Oncol. 2008;26:313–325. doi: 10.1200/JCO.2007.15.4088. [DOI] [PubMed] [Google Scholar]
- 3.Jemal A, Siegel R, Ward E, Murray T, Xu J, Thun MJ. Cancer statistics, 2007. CA Cancer J Clin. 2007;57:43–66. doi: 10.3322/canjclin.57.1.43. [DOI] [PubMed] [Google Scholar]
- 4.Wils J. Adjuvant treatment of colon cancer: past, present and future. J Chemother. 2007;19:115–122. doi: 10.1179/joc.2007.19.2.115. [DOI] [PubMed] [Google Scholar]
- 5.Jass JR. Pathogenesis of colorectal cancer. Surg Clin North Am. 2002;82:891–904. doi: 10.1016/s0039-6109(02)00047-6. [DOI] [PubMed] [Google Scholar]
- 6.Reidy D, Saltz L. Targeted strategies in the treatment of metastatic colon cancer. J Natl Compr Canc Netw. 2007;5:983–990. doi: 10.6004/jnccn.2007.0082. [DOI] [PubMed] [Google Scholar]
- 7.Linardou H, Dahabreh IJ, Kanaloupiti D, Siannis F, Bafaloukos D, Kosmidis P, Papadimitriou CA, Murray S. Assessment of somatic KRAS mutations as a mechanism associated with resistance to EGFR-targeted agents: a systematic review and meta-analysis of studies in advanced non-small-cell lung cancer and metastatic colorectal cancer. Lancet Oncol. 2008;9:962–972. doi: 10.1016/S1470-2045(08)70206-7. [DOI] [PubMed] [Google Scholar]
- 8.Grothey A, Galanis E. Targeting angiogenesis: progress with anti-VEGF treatment with large molecules. Nat Rev Clin Oncol. 2009;6:507–518. doi: 10.1038/nrclinonc.2009.110. [DOI] [PubMed] [Google Scholar]
- 9.Köhne CH, Lenz HJ. Chemotherapy with targeted agents for the treatment of metastatic colorectal cancer. Oncologist. 2009;14:478–488. doi: 10.1634/theoncologist.2008-0202. [DOI] [PubMed] [Google Scholar]
- 10.Cohen DJ, Hochster HS. Update on clinical data with regimens inhibiting angiogenesis and epidermal growth factor receptor for patients with newly diagnosed metastatic colorectal cancer. Clin Colorectal Cancer. 2007;7(Suppl 1):S21–S27. doi: 10.3816/ccc.2008.s.004. [DOI] [PubMed] [Google Scholar]
- 11.Yamatodani T, Ekblad L, Kjellen E, Johnsson A, Mineta H, Wennerberg J. Epidermal growth factor receptor status and persistent activation of Akt and p44/42 MAPK pathways correlate with the effect of cetuximab in head and neck and colon cancer cell lines. J Cancer Res Clin Oncol. 2009;135:395–402. doi: 10.1007/s00432-008-0475-2. [DOI] [PMC free article] [PubMed] [Google Scholar]
- 12.Jiang Y, Kimchi ET, Staveley-O’Carroll KF, Cheng H, Ajani JA. Assessment of KRAS mutation: a step toward personalized medicine for patients with colorectal cancer. Cancer. 2009;115:3609–3617. doi: 10.1002/cncr.24434. [DOI] [PubMed] [Google Scholar]
- 13.Bardelli A, Siena S. Molecular mechanisms of resistance to cetuximab and panitumumab in colorectal cancer. J. Clin. Oncol. 2010;28:1254–1261. doi: 10.1200/JCO.2009.24.6116. [DOI] [PubMed] [Google Scholar]
- 14.Reya T, Morrison SJ, Clarke MF, Weissman IL. Stem cells, cancer, and cancer stem cells. Nature. 2001;414:105–111. doi: 10.1038/35102167. [DOI] [PubMed] [Google Scholar]
- 15.Dalerba P, Cho RW, Clarke MF. Cancer stem cells: models and concepts. Annu Rev Med. 2007;58:267–284. doi: 10.1146/annurev.med.58.062105.204854. [DOI] [PubMed] [Google Scholar]
- 16.Ailles LE, Weissman IL. Cancer stem cells in solid tumors. Curr Opin Biotechnol. 2007;18:460–466. doi: 10.1016/j.copbio.2007.10.007. [DOI] [PubMed] [Google Scholar]
- 17.Schulenburg A, Ulrich-Pur H, Thurnher D, Erovic B, Florian S, Sperr WR, Kalhs P, Marian B, Wrba F, Zielinski CC, Valent P. Neoplastic stem cells: a novel therapeutic target in clinical oncology. Cancer. 2006;107:2512–2520. doi: 10.1002/cncr.22277. [DOI] [PubMed] [Google Scholar]
- 18.Ricci-Vitiani L, Lombardi DG, Pilozzi E, Biffoni M, Todaro M, Peschle C, De Maria R. Identification and expansion of human colon-cancer-initiating cells. Nature. 2007;445:111–115. doi: 10.1038/nature05384. [DOI] [PubMed] [Google Scholar]
- 19.O’Brien CA, Pollett A, Gallinger S, Dick JE. A human colon cancer cell capable of initiating tumour growth in immunodeficient mice. Nature. 2007;445:106–110. doi: 10.1038/nature05372. [DOI] [PubMed] [Google Scholar]
- 20.Shmelkov SV, Butler JM, Hooper AT, Hormigo A, Kushner J, Milde T, St Clair R, Baljevic M, White I, Jin DK, Chadburn A, Murphy AJ, Valenzuela DM, Gale NW, Thurston G, Yancopoulos GD, D’Angelica M, Kemeny N, Lyden D, Rafii S. CD133 expression is not restricted to stem cells, and both CD133+ and CD133- metastatic colon cancer cells initiate tumors. J Clin Invest. 2008;118:2111–2120. doi: 10.1172/JCI34401. [DOI] [PMC free article] [PubMed] [Google Scholar]
- 21.Haraguchi N, Ohkuma M, Sakashita H, Matsuzaki S, Tanaka F, Mimori K, Kamohara Y, Inoue H, Mori M. CD133+CD44+ population efficiently enriches colon cancer initiating cells. Ann Surg Oncol. 2008;15:2927–2933. doi: 10.1245/s10434-008-0074-0. [DOI] [PubMed] [Google Scholar]
- 22.Fargeas CA, Huttner WB, Corbeil D. Nomenclature of prominin-1 (CD133) splice variants - an update. Tissue Antigens. 2007;69:602–606. doi: 10.1111/j.1399-0039.2007.00825.x. [DOI] [PubMed] [Google Scholar]
- 23.Mizrak D, Brittan M, Alison MR. CD133: molecule of the moment. J Pathol. 2008;214:3–9. doi: 10.1002/path.2283. [DOI] [PubMed] [Google Scholar]
- 24.Horst D, Kriegl L, Engel J, Kirchner T, Jung A. CD133 expression is an independent prognostic marker for low survival in colorectal cancer. Br J Cancer. 2008;99:1285–1289. doi: 10.1038/sj.bjc.6604664. [DOI] [PMC free article] [PubMed] [Google Scholar]
- 25.LaBarge MA, Bissell MJ. Is CD133 a marker of metastatic colon cancer stem cells? J Clin Invest. 2008;118:2021–2024. doi: 10.1172/JCI36046. [DOI] [PMC free article] [PubMed] [Google Scholar]
- 26.Saigusa S, Tanaka K, Toiyama Y, Yokoe T, Okugawa Y, Ioue Y, Miki C, Kusunoki M. Correlation of CD133, OCT4, and SOX2 in rectal cancer and their association with distant recurrence after chemoradiotherapy. Ann Surg Oncol. 2009;16:3488–3498. doi: 10.1245/s10434-009-0617-z. [DOI] [PubMed] [Google Scholar]
- 27.Dittfeld C, Dietrich A, Peickert S, Hering S, Baumann M, Grade M, Ried T, Kunz-Schughart LA. CD133 expression is not selective for tumor-initiating or radioresistant cell populations in the CRC cell lines HCT-116. Radiother Oncol. 2009;92:353–361. doi: 10.1016/j.radonc.2009.06.034. [DOI] [PubMed] [Google Scholar]
- 28.Yeung TM, Gandhi SC, Wilding JL, Muschel R, Bodmer WF. Cancer stem cells from colorectal cancer-derived cell lines. Proc Natl Acad Sci U S A. 2010;107:3722–3727. doi: 10.1073/pnas.0915135107. [DOI] [PMC free article] [PubMed] [Google Scholar]
- 29.Kai K, Nagano O, Sugihara E, Arima Y, Sampetrean O, Ishimoto T, Nakanishi M, Ueno NT, Iwase H, Saya H. Maintenance of HCT116 colon cancer cell line conforms to a stochastic model but not a cancer stem cell model. Cancer Sci. 2009;100:2275–2282. doi: 10.1111/j.1349-7006.2009.01318.x. [DOI] [PMC free article] [PubMed] [Google Scholar]
- 30.Fang DD, Kim YJ, Lee CN, Aggarwal S, McKinnon K, Mesmer D, Norton J, Birse CE, He T, Ruben SM, Moore PA. Expansion of CD133(+) colon cancer cultures retaining stem cell properties to enable cancer stem cell target discovery. Br J Cancer. 2010;102:1265–1275. doi: 10.1038/sj.bjc.6605610. [DOI] [PMC free article] [PubMed] [Google Scholar]
- 31.Masters JR, Thomson JA, Daly-Burns B, Reid YA, Dirks WG, Packer P, Toji LH, Ohno T, Tanabe H, Arlett CF, Kelland LR, Harrison M, Virmani A, Ward TH, Ayres KL, Debenham PG. Short tandem repeat profiling provides an international reference standard for human cell lines. Proc Natl Acad Sci U S A. 2001;98:8012–8017. doi: 10.1073/pnas.121616198. [DOI] [PMC free article] [PubMed] [Google Scholar]
- 32.Vales A, Kondo R, Aichberger KJ, Mayerhofer M, Kainz B, Sperr WR, Sillaber C, Jäger U, Valent P. Myeloid leukemias express a broad spectrum of VEGF receptors including neuropilin- 1 (NRP-1) and NRP-2. Leuk Lymphoma. 2007;48:1997–2007. doi: 10.1080/10428190701534424. [DOI] [PubMed] [Google Scholar]
- 33.Mosmann T. Rapid colorimetric assay for cellular growth and survival: application to proliferation and cytotoxicity assays. J Immunol Methods. 1983;65:55–63. doi: 10.1016/0022-1759(83)90303-4. [DOI] [PubMed] [Google Scholar]
- 34.Aichberger KJ, Mayerhofer M, Krauth MT, Skvara H, Florian S, Sonneck K, Akgul C, Derdak S, Pickl WF, Wacheck V, Selzer E, Monia BP, Moriggl R, Valent P, Sillaber C. Identification of mcl-1 as a BCR/ABL-dependent target in chronic myeloid leukemia (CML): evidence for cooperative antileukemic effects of imatinib and mcl-1 antisense oligonucleotides. Blood. 2005;105:3303–3311. doi: 10.1182/blood-2004-02-0749. [DOI] [PubMed] [Google Scholar]
- 35.Mayerhofer M, Gleixner KV, Mayerhofer J, Hoermann G, Jaeger E, Aichberger KJ, Ott RG, Greish K, Nakamura H, Derdak S, Samorapoompichit P, Pickl WF, Sexl V, Esterbauer H, Schwarzinger I, Sillaber C, Maeda H, Valent P. Targeting of heat shock protein 32 (Hsp32)/heme oxygenase-1 (HO-1) in leukemic cells in chronic myeloid leukemia: a novel approach to overcome resistance against imatinib. Blood. 2008;111:2200–2210. doi: 10.1182/blood-2006-11-055723. [DOI] [PubMed] [Google Scholar]
- 36.Grunt TW, Puckmair K, Tomek K, Kainz B, Gaiger A. An EGF receptor inhibitor induces RAR-beta expression in breast and ovarian cancer cells. Biochem Biophys Res Commun. 2005;329:1253–1259. doi: 10.1016/j.bbrc.2005.02.104. [DOI] [PubMed] [Google Scholar]
- 37.Bilban M, Haslinger P, Prast J, Klinglmüller F, Woelfel T, Haider S, Sachs A, Otterbein LE, Desoye G, Hiden U, Wagner O, Knöfler M. Identification of novel trophoblast invasion- related genes: heme oxygenase-1 controls motility via peroxisome proliferator- activated receptor gamma. Endocrinology. 2009;150:1000–1013. doi: 10.1210/en.2008-0456. [DOI] [PMC free article] [PubMed] [Google Scholar]
- 38.Gentleman RC, Carey VJ, Bates DM, Bolstad B, Dettling M, Dudoit S, Ellis B, Gautier L, Ge Y, Gentry J, Hornik K, Hothorn T, Huber W, Iacus S, Irizarry R, Leisch F, Li C, Maechler M, Rossini AJ, Sawitzki G, Smith C, Smyth G, Tierney L, Yang JY, Zhang J. Bioconductor: open software development for computational biology and bioinformatics. Genome Biol. 2004;5:R80. doi: 10.1186/gb-2004-5-10-r80. [DOI] [PMC free article] [PubMed] [Google Scholar]
- 39.Botchkina IL, Rowehl RA, Rivadeneira DE, Karpeh MS Jr, Crawford H, Dufour A, Ju J, Wang Y, Leyfman Y, Botchkina GI. Phenotypic populations of metastatic colon cancer stem cells: genomic analysis. Cancer Genomics Proteomics. 2009;6:19–29. [PubMed] [Google Scholar]
- 40.Modest DP, Reinacher-Schick A, Stintzing S, Giessen C, Tannapfel A, Laubender RP, Brodowicz T, Knittelfelder R, Vrbanec D, Schmiegel W, Heinemann V, Zielinski CC. Cetuximab-based or bevacizumab-based first-line treatment in patients with KRAS p. G13D-mutated metastatic colorectal cancer: a pooled analysis. Anticancer Drugs. 2012;23:666–673. doi: 10.1097/CAD.0b013e328352ff1d. [DOI] [PubMed] [Google Scholar]
- 41.Pang R, Law WL, Chu AC, Poon JT, Lam CS, Chow AK, Ng L, Cheung LW, Lan XR, Lan HY, Tan VP, Yau TC, Poon RT, Wong BC. A population of CD26+ cancer stem cells with metastatic capacity in human colorectal cancer. Cell Stem Cell. 2010;6:603–615. doi: 10.1016/j.stem.2010.04.001. [DOI] [PubMed] [Google Scholar]