Abstract
Autophagy plays a protective role in colorectal carcinoma. Arginine ADP-ribosyltransferase 1 (ART1) is an important mono-ADP-ribose transferase, which has been shown to play a role in biological processes such as proliferation and invasion of cancer cells. Interestingly, the role of ART1 in the regulation of autophagy is still not clear. We examined effects of overexpression or knockdown of ART1 by lentiviral transfection on starvation-induced autophagy of colon carcinoma CT26 cell lines in vivo and in vitro. The formation of autophagosome was detected by electron microscopy, acridine orange staining and expression of LC3 B. The molecular contributions of ART1 in regulation of autophagy were detected by western blotting or by co-immunoprecipitation. Additionally, inhibitors were used to study further the signaling pathway of ART1 in the regulation of autophagy. CCK8 assay, plate cloning assay, soft agar assay, examination of subcutaneous transplanted carcinoma in BALB/c mice, flow cytometry and Hoechst33342 staining were used to assess survival and apoptotic ability when starvation-induced autophagy modulated by ART1 was inhibited by 3-MA. Overexpression of ART1 promoted starvation-induced autophagy, which related to increases in the expression of Rac1, NF-κB, PARP-1, LKB1 and p-AMPK and a decrease in the expression of p-P70S6K. Correspondingly, knockdown of ART1 caused the opposite effects. ART1 also interacted with integrin α7. Additionally, changes of protein expressions were further validated following inhibition of Rac1 and PARP-1 in the starvation-induced ART1-GFP CT26 cells. Inhibition of ART1-stimulated starvation-induced autophagy restrained the growth and promoted apoptosis. ART1 is thus relevant in starvation-induced autophagy in colorectal carcinoma and may play essential roles in therapeutic anticancer strategies.
Keywords: Autophagy, colon carcinoma, ART1, proliferation, apoptosis
Introduction
Macroautophagy (autophagy) is a process by which cellular contents are wrapped in double-membrane vesicle structures and are degraded by lysosomes to maintain the balance of re-use and degradation of cellular components [1,2]. Starvation, hypoxia, low energy, acidity and other mechanisms can boost autophagy. During autophagy, light chain 3 (LC3A) is cleaved and further binds to phosphatidylethanolamine to generate a LC3-phosphatidylethanolamine conjugate (LC3B). LC3B reflects the degree of autophagy in the cell [3]. Autophagy has been reported to participate in multiple pathophysiological processes, such as inflammation, cell survival and regulation of growth of tumors [4]. However, the detailed mechanisms underlying regulation of autophagy in different cancers remain elusive.
Studies of autophagy in different cancers reveal conflicting results [5]. Autophagy contributes to survival, metastasis and resistance of tumor cells to therapy. Autophagy devours harmful metabolites, recycles products in the cell and also helps tumor cells to survive under poorly vascularized conditions. Cells in the center of tumors, which lack nutrition for rapid growth, are more autophagic than are cells in the margins of tumors [6]. Yang et al. showed that autophagy is increased in pancreatic cancer and that proliferation of pancreatic cancer cells (PDAC cells) was diminished when autophagy was inhibited [7]. However, autophagy can remove damaged proteins and dysfunctional organelles, preventing chromosomal instability resulting from damage by reactive oxygen species (ROS), hence preventing tumorigenesis [8]. It has been observed that the level of autophagy rises under nutritional stress in colorectal carcinoma and that this elevation contributes to the aggressive nature of the cells. However, the factors that influence and regulate of starvation-induced autophagy have not been investigated.
Mono-ADP-ribosylation, a post-translational modification of proteins, is a process that transfers a single ADP-ribose from substrate nicotinamide adenine dinucleotide (NAD+) to specific amino-acids (e.g. His, Cys, Arg, Lys) in the target proteins proteins [9,10]. There are seven sub-types of ADP-ribosyltransferase enzymes (ARTs), which catalyze mono-ADP-ribosylation. ART1, an arginine-specific ADP-ribosyltransferase which exists in humans, mice and rats [11], has been reported to catalyze the modification (mono-ADP-ribosylation) of target proteins, such as integrin α7, human neutrophil peptide-1 (HNP-1), fibroblast growth factor-2 (FGF-2) and platelet-derived growth factor-BB (PDGF-BB). These target proteins are involved in a variety of processes, including inflammation, angiogenesis and cellular proliferation [12-15]. However, information on the role of ART1 in cancer is scarce. In our previous studies, we have verified that the expression of ART1 in hepatocellular carcinoma (HCC) and colorectal carcinoma correlates positively with expression of integrin α7 and poly (ADP-ribose) polymerase (PARP-1), respectively [16,17]. However, silencing of ART1 inhibits proliferation and promotes apoptosis in CT26 murine colon adenocarcinoma cells [18]. ART1 appears to be involved in several biological processes in cancer.
Mammalian target of rapamycin (mTOR), a crucial negative regulator of autophagy, regulates the level of phosphorylation of downstream p70S6K to participate in autophagy. PARP-1/LKB/AMPK and Rac1 signal pathways both play important roles in regulating the activity of mTOR. However, it is not known whether ART1 can affect starvation-induced autophagy in colon carcinoma or if the process might involve PARP-1/LKB/AMPK or Rac1 pathways.
To determine the effect of ART1 on starvation-induced autophagy in colon carcinoma in this study, we separately overexpressed and silenced ART1 in CT26 cells using lentivirus transfection. Autophagosomes and specific mark proteins of autophagy were detected, reflecting the influence of ART1 in starvation-induced autophagy. An inhibitor of autophagy, 3-methyladenine (3-MA), was used to estimate the effect of starvation-induced autophagy regulated by ART1 on apoptosis and proliferation of colon carcinoma cells. Given the relevance of pathway in starvation-induced autophagy, inhibitors of Rac1 or PARP-1 were used to help to unveil the molecular mechanism of ART1 on starvation-induced autophagy.
Materials and methods
Cells and culture conditions
The murine colon adenocarcinoma cell line, CT26, was kindly provided by Professor Wei YQ (Sichuan University, Chengdu, China). The cell-culture medium for this cell line included RPMI 1640 medium (Hyclone, Logan, UT, USA) containing 10% fetal calf serum (Sijiqing, Hangzhou, China) and 1% penicillin/streptomycin (Hyclone). The culture conditions of the incubator were set to 37°C and 5% CO2. When there were sufficient cells, the culture medium was replaced with D-Hanks solution and incubated for 12 h to induce autophagy.
Cell transfection
Lentivirus-based short hairpin RNA (shRNA) vector and lentivirus-based cDNA targeting the ART1 gene were constructed by Genechem (Shanghai, China). Our previous studies have verified the effectiveness of transfection using lentiviruses in CT26 cells [17,19].
Experimental groups in our study
The experimental groups included ART1 silencing in CT26 cells with transfected lentivirus ART1-shRNA (ART1-shRNA group) and ART1 overexpression in CT26 cells with transfected GFP-ART1 (GFP-ART1 group). Untransfected CT26 cells (untransfected group) and lentivirus-based empty vector transfected CT26 cells (vector group) were categorized as control groups.
Detection of autophagic vacuoles by electron microscopy
Cells (> 106) were digested with 0.25% tyrisin (Hyclone) and transferred into 1.5 mL Eppendorf (EP) tubes. After centrifugation at 1200 rpm, the supernatant was discarded. The aggregates of cells were fixed with 2.5% glutaraldehyde for 2 h, washed thrice with 0.1 M PBS and fixed with 1% osmium tetroxide for 2 h. The cells were then dehydrated with graded ethanol and acetone and embedded in epoxy resin. Specimens were cut into 60 nm ultra-thin sections and stained with lead citrate. The sections were examined with a transmission electron microscope (Hitachi-7500, Hitachi Tokyo, Japan).
Acridine orange (AO) staining
CT26 cells adhering to glass cover slips were fixed with 95% ethanol for 5 min and then were stained with 1 mg/L Acridine Orange dye liquor (Sigma) for 5 min. Cells were then detected by fluorescence microscopy (NIKON TE2000, Tokyo, Japan). The Fl3-height of flow cytometry was used to analyze AO stained cells which were obtained by similar procedure as indicated above. 105 CT26 cells in each group were collected, washed twice with PBS and stained with 0.5 mg/L AO for 5 min. After centrifugation, the supernatant was discarded and the stained cells were washed twice with PBS before analysis by flow cytometry.
RT-PCR
Oligonucleotide primers of LC3A, LC3B and β-actin were designed and produced by Sangon Biotech Company (Shanghai, China). The sequences of primers were as follows: LC3A, 5’CTACGCCTCCCAAGAAACCT3’ (F) and 5’CACATCTCTGCCTAATCCACTG3’ (R); LC3B, 5’GTTACCATACGCCCTTCTGC3’ (F) and 5’CTGTTGCTGTTGTCCTCACA3’ (R); β-actin, 5’GTCCCTCACCCTCCCAAAAG3’ (F) and 5’GCTGCCTCAACACCTCAACCC3’ (R). The total RNA of each group was extracted by TRIzol reagent (Takara, Dalian, China). Reverse transcription was used the BioRT cDNA first strand synthesis kit (BioerTechonolgy, Hangzhou, China) and was carried out at room temperature for 10 min, 52°C for 45 min and at 95°C for 5 min. Amplifications were done using the following reaction conditions: 94°C for 90 sec; 30 cycles at 95°C for 30 sec, 60°C for 30 sec and 72°C for 25 sec per 1 kb; 1 cycle at 72°C for 5 min using 2 × Taq master mix (Novoprotein, Suzhou, China). RT-PCR products were electrophoresed in 2% agarose gels (Genview, Tallahassee, FL, USA).
Western blot analysis
Cells were scraped into 1.5 mL EP tubes and were dissolved with lysis buffer on ice for 20 min. Lysis buffer (Beyotime, Shanghai, China) was used to lyse cells. The supernatant of lysates were collected after centrifugation at 12000 rpm at 4°C for 5 min. The concentrations of protein were measured with bicinchoninic acid (BCA) protein assay kit (Beyotime). Nuclear protein extracts were isolated using a nuclear and cytoplasmic protein extraction Kit (Beyotime). Proteins (20 mg) were loaded in each lane of 6% or 10% polyacrylamide gels (SDS-PAGE) and the proteins were separated by gel electrophoresis at a constant voltage. Proteins were transferred onto polyvinylidene fluoride membranes (Biosharp, Hefei, China) and then blocked with 5% skimmed milk or 5% bovine serum albumin (BSA) for 1 h. Polyvinylidene fluoride membranes were incubated with primary antibodies against Rac1, LC3A/B (Proteinthech, Chicago, IL, USA), p-AMPK, p-p70s6k, NF-κB and histone-H2B (Bioworld Technology, MN, USA), LKB1 and β-actin (Boster, Wuhan, China) at 4°C overnight. The membranes were further incubated with peroxidase-conjugated anti-rabbit or mouse immunoglobulin G for 2 h at room temperature. The blots were finally washed with Tris-buffered saline Tween and the immuno-reactive proteins were detected with a gel imaging analysis system (Bio-Rad, Hercules, CA, USA) after being visualized with BeyoECL plus (Beyotime). Optical density values were analyzed with Quantity one software (Bio-Rad). Similar protein extraction and Western blot methods were followed for GFP-ART1 cells with a water-soluble inhibitor of PARP-1 5-aminoisoquinolinone (100 uM) (5-AIQ) (a kind gift from Professor Michael D. Threadgill, University of Bath, Bath, UK) or NSC23766 (100 uM) (an inhibitor of Rac1, Selleckchem, Houston, TX, USA) in order to investigate the roles of Rac1 and PARP-1 in starvation-induced autophagy modulated by ART1.
Co-immunoprecipitation assay
Cells were lysed in RIPA buffer (Beyotime) for 15 min on ice. The lysates were centrifuged at 14000 rpm at 4°C for 15 min and the supernatants containing the relevant proteins were collected and were incubated with ART1 primary antibody (1:200 dilution; Santa Cruz Biotechnology, Santa Cruz, CA, USA) at room temperature for 2 h. To capture the antibody-analyte complex, 100 µL protein A + G agarose (Beyotime) was incubated with the supernatants at 4°C overnight. Agarose-antibody-analyte complexes, which were harvested by centrifugation at 14000 rpm for 5 sec, were washed thrice with PBS and recovered in 1 × SDS-PAGE buffer in a boiling water bath for 5 min. The immunoprecipitates were analyzed by Western blotting with antibodies against ART1 and integrin α7 (1:400 dilution; Bioss, Beijing, China).
Cell counting Kit-8 (CCK-8) assay
100 μL of GFP-ART1 CT26 cell suspensions (5 × 10³ cells/well) in logarithmic phase were distributed in quadruplicate in 96-well plates. 100 µL of culture medium was pipetted into the wells of 96-well plates as a blank control group. The plates were kept in an incubator at 37°C under 5% CO2 for 24 h. The culture medium was changed to D-Hanks, then, 3-MA was added to each well at the following concentrations; 3-MA 0 mM, 1 mM, 3 mM, 5 mM and 7 mM. After 12 h, 10 μL of Cell Counting Kit-8 solution (CCK-8, Dojindo, Kumamoto, Japan) was added to each well and the plates were incubated for 1 h. The optical density (OD) was measured using a microplate reader (Bio-Tek, Hercules, CA, USA) at 450 nm. The procedure was carried out thrice, to obtain the mean of collected readings. The percentage of inhibition of proliferation was calculated by (1-mean OD for drug group/mean OD for control group) × 100%.
Trypan blue dying
Cell suspensions, which were treated with different concentrations of 3-MA during the CCK-8 assay, were mixed with 0.4% Trypan blue dye solution in the ratio of 9:1. Dead cells were coloured blue and were counted under microscope within 3 min. The fraction was calculated by dividing the number of dead cells with total number of cells.
Flow cytometric analysis of cell apoptosis
Cells were seeded in 6-well plates overnight. Cells in the ART1-GFP group were treated with 3-MA (5 mM) after the cell-culture medium was changed to D-Hanks solution. GFP-ART1 CT26 cells without treatment with 3-MA were used as a control group. Cells were collected with 0.25% trypsin, washed twice with PBS, suspended in binding buffer and incubated with PE-conjugated Annexin-V and 7-AAD (TiajinSungene Biotech, Tianjing, China) at room temperature for 30 min in the absence of light. The percentage of apoptotic cells was detected by flow cytometry (FACSVantage SE, Becton Dickinson and Company, Franklin Lakes, NJ, USA).
Hoechst33342 staining
1 × 10⁵ GFP-ART1 cells were seeded in each well of 6-well plates, treated with 3-MA (5 mM) and cultured in D-Hanks solution. GFP-ART1 CT26 cells without treatment with 3-MA were used as a control group. Cells were washed twice with PBS and then trypsinized. The cells were further suspended in 50 µL PBS with 5 µL Hoechst 33342 (Boyotime) without exposure to lightat room temperature for 30 min. The formation of apoptotic bodies in cells was observed with a fluorescent microscope (Olympus BX51, Tokyo, Japan) and the percentage of apoptotic cells was calculated with the formula: apoptotic percentage (AR)% = [apoptotic cells (A)/total cell count (T)] × 100.
Soft agar assay
Culture dishes (6 cm) were paved by mixing equal parts of 1.2% agarose with 1640 culture medium containing 20% FBS for standby application. GFP-ART1 CT26 cells were seeded in the mixture composed of 0.7% agarose and culture medium which was spread on the earlier standby application culture dish. GFP-ART1 CT26 cells, which were pretreated by starvation and 3-MA (5 mM) for 12 h before seeding, were set as the experimental group. GFP-ART1CT26 cells which were only pretreated with starvation were set as the control group. After the agarose had gelled at room temperature, the cells were cultured for 14 d in an incubator. The numbers of cells cloned were counted using an inverted microscope. The cloning efficiency was calculated with the number of cell cloned divided by the number of cells seeded.
Plate cloning assay
Five hundred GFP-ART1CT26 cells were seeded in 6 cm culture dishes. The procedure used for pre-treatment GFP-ART1 CT26 cells was similar to that of the soft agar assay. The cell culture dishes were gently shaken and were kept in an incubator until visible cell cloning appeared. The supernatant was discarded and the cells were fixed with 4% formaldehyde for 20 min and later stained with crystal violet dye for 5 min. A camera in macro mode was used to obtain the images. The calculation of cloning efficiency was estimated for the soft agar assay.
Subcutaneous tumor model in BALB/c mice
To detect whether the molecules of interest had the same effect in vivo in accordance in vitro, four groups of CT26 cells (2 × 10⁶) were injected into the right flanks of BALB/c mice. After being fed for 19 d, mice were fasted for 24 h and then sacrificed. The CT26 carcinoma, which had been grown subcutaneously in the mice, was harvested. The total proteins were isolated from these excised tumors and the proteins of interest were investigated by Western blotting.
To study the role of autophagy up-regulated by ART1 on the growth of colon carcinoma under starvation-induced in vivo, GFP-ART1 CT26 cells were injected into the right flanks of BALB/c mice. Until the tumors grew to the size of 0.5-1.1 cm3 (about 10 d after injection), mice were injected intraperitoneally with 3-MA (34 mg/kg dissolved in 100 µl menstruum) 4 times every 5 d; this represented the experimental group [20]. Mice which were intraperitoneally injected with 100 µl menstruum without 3-MA were set as the control group. The mice were fasted for 24 h after injection with 3-MA. The sizes of the tumors were measured and the volumes were calculated using the following formula (V = ab2/2; a, the longest diameter; b, the shortest diameter). The weights of the subcutaneously transplanted tumors were measured when mice were sacrificed on the 35th day.
Statistical analysis
The above experiments were all replicated thrice. Values were presentedas mean ± standard deviation (SD) (x̅ ± s). The differences between each group were analyzed with one-way ANOVA or student’s t-test, using SPSS 19.0 software (SPSS, Chicago, IL, USA). P-value < 0.05 indicated statistically significant differences.
Results
Autophagy is elevated in GFP-ART1 CT26 cells under starvation-induced conditions
For identifying the formation of autophagy, an electron microscope was used to observe the autophagosomes in CT26 cells, which were segmented into four groups according to the level of ART1. In each group, autophagosome were not observed in the absence of starvation (Figure 1A). After starvation, GFP-ART1 CT26 cells displayed some autophagosomes, which were more numerous than in the untransfected and the vector control CT26 cells. Autophagosomes were not observed in the ART1-shRNA group and many apoptotic cells were detected (Figure 1B). The autophagosome, an acid vesicular organelle, appears red when stained with AO and the fluorescence intensity correlates with its acidity. There was no obvious red fluorescence in each group whenCT26 cells were not starved (Figure 1C). After starvation treatments, red fluorescence was detected in cells. The red fluorescence intensity in the GFP-ART1 group was higher than in other groups. By contrast, the red fluorescence was lower in the ART1-shRNA group, compared to other groups (Figure 1D). Comparison of the intensity of the red fluorescence with flow cytometry showed that the red fluorescence was stronger in the starvation-induced GFP-ART1 group and weaker in the starvation-induced ART1-shRNA group (P < 0.01), compared with control groups (Figure 1E).
Figure 1.
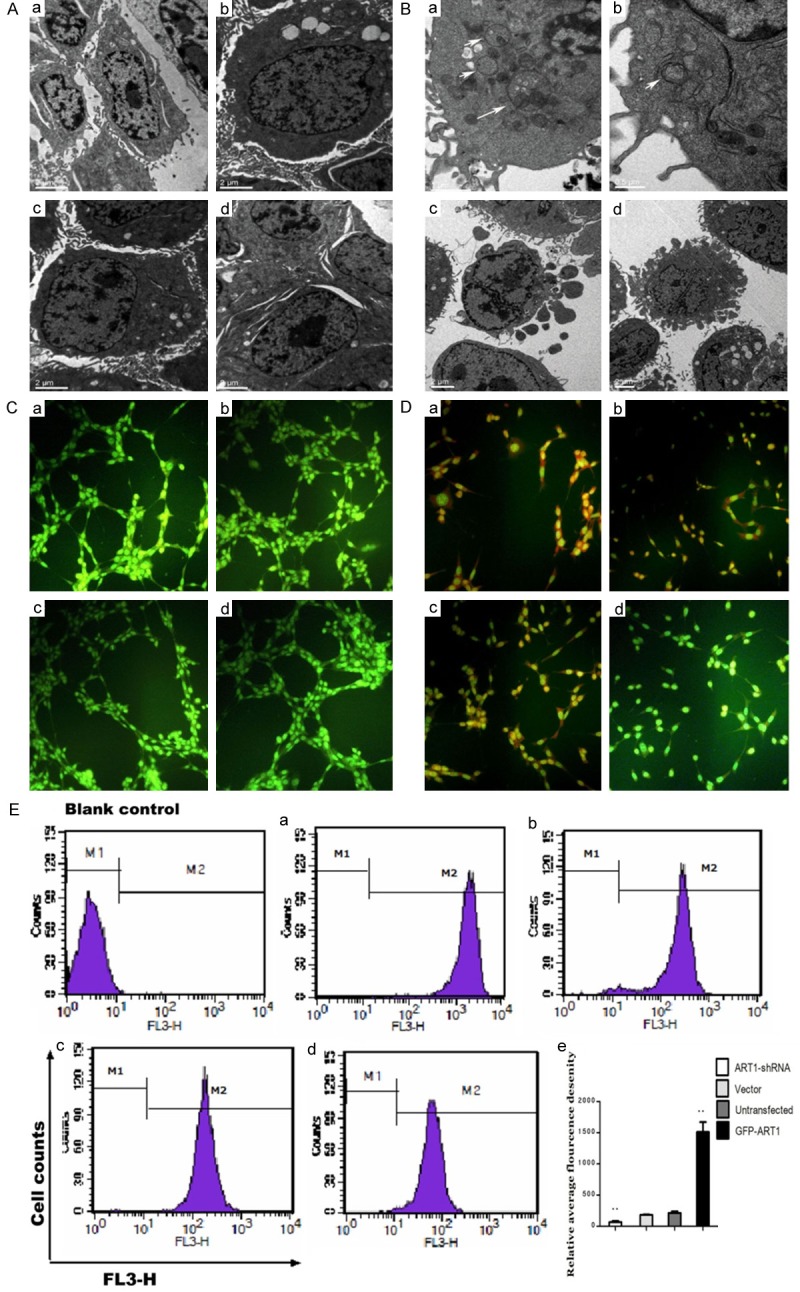
The formation of autophgosome in starvation-induced CT26 cells. Autophagosome in CT26 cells which were untreated with starvation (A) or treated with starvation (B) observed with electron microscope. The white arrow denotes the autophagosome. In acridine orange staining, CT26 cells which were untreated with starvation only show green fluorescence (C); Starvation-induced CT26 cells show red fluorescence in GFP-ART1 group, Vector group, Untransfected group and ART1-shRNA group (D). The red fluorescence intensity was detected with flow cytometric analysis, and results show that red fluorescence intensity in GFP-ART1 group higher but in ART1-shRNA group lower than it in vector group and untransfected group (**P < 0.01) (E). a: GFP-ART1 group; b: Untransfected group; c: Vector group; d: ART1-shRNA group.
The protein and mRNA levels of the autophagy marker protein LC3B were measured by Western blotting or RT-PCR, respectively, to assess the autophagy level under starvation-induced conditions. Both mRNA and protein levels of LC3B increased in the starvation-induced GFP-ART1 group and decreased in starvation-induced ART1-shRNA group, compared with control groups in vitro and in vivo, respectively (P < 0.05) (Figure 2A-H).
Figure 2.
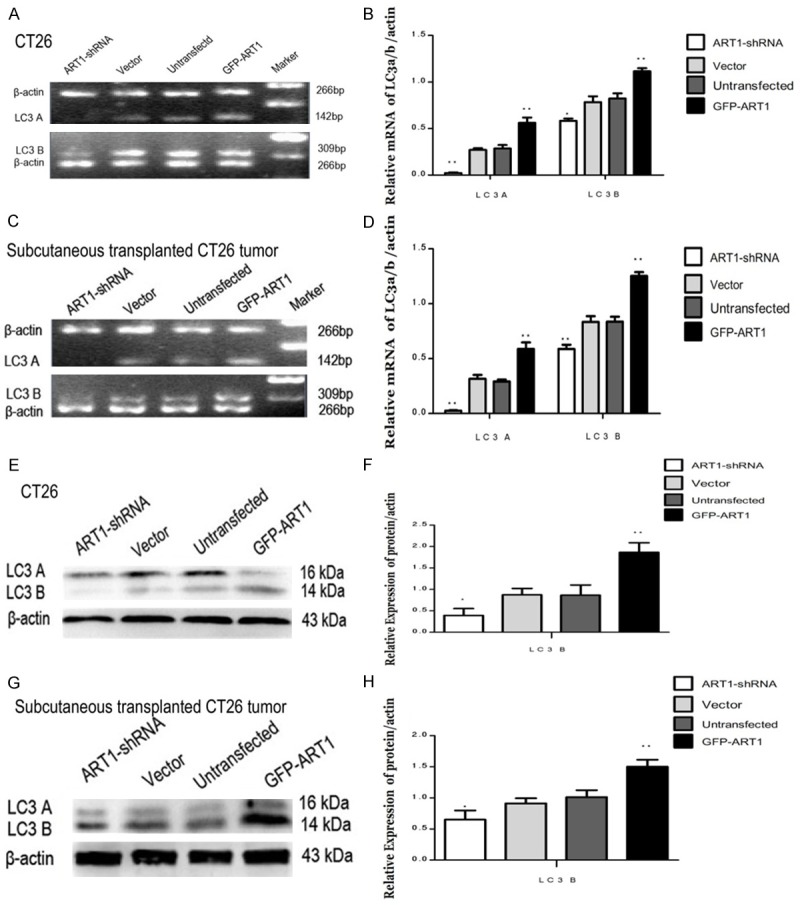
The changes of LC3A/B mediated by ART1 in vitro and vivo under starvation-induced conditions. In vitro and vivo, the mRNA level of LC3A/B was increased in GFP-ART1 group and was decreased in ART1-shRNA group, compare with control groups (A-D). The protein level of LC3A/B also was increased in GFP-ART1 group and was decreased in ART1-shRNA group, compared with control groups (E-H). (*P < 0.05; **P < 0.01).
The changes of Rac1, PARP-1, LKB1, p-AMPK and p-p70S6K in starvation-induced ART1-shRNA and GFP-ART1 CT26 cells in vitro and in vivo
Western blotting was used to measure the expression of proteins Rac1, PARP-1, LKB1, p-p70S6k and p-AMPK in vitro and in vivo. The expression of Rac1, PARP-1, LKB1 and p-AMPK were higher in starvation-induced GFP-ART1 groups than in control groups (P < 0.01). The concentrations of these proteins were lower in starvation-induced ART1-shRNA group than in control groups (P < 0.05). The expression of p-p70S6k declined in starvation-induced GFP-ART1 group (P < 0.01) but was elevated in the starvation-induced ART1-shRNA group, compared with control groups (P < 0.01) (Figure 3A-D); this protein reflects the activity of mTOR.
Figure 3.
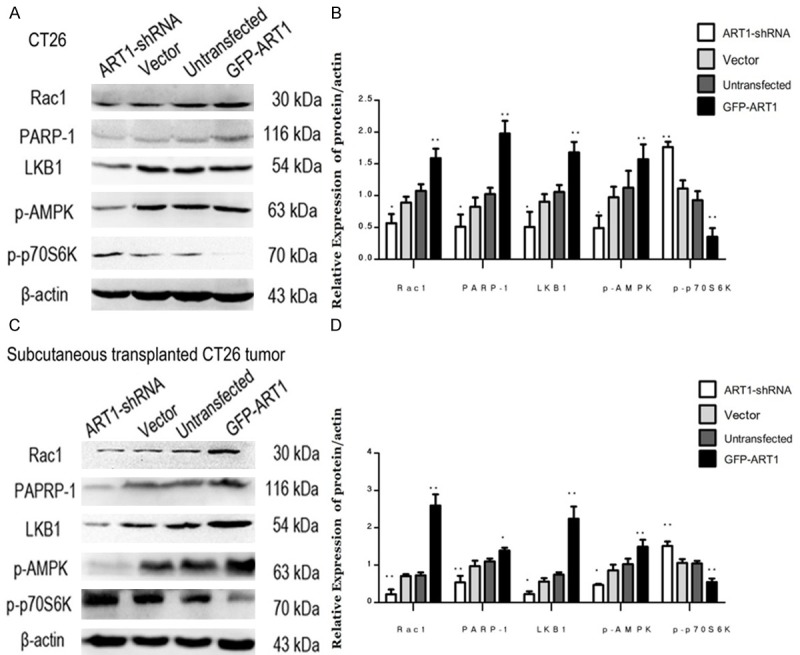
Expressions of Rac1, PARP, LKB1, p-AMPK, and p-P70S6k change with ART1 in vivo and vitro under starvation-induced conditions. Expressions of Expressions of Rac1, PARP, LKB1 and p-AMPK in GFP-ART1 CT26 cells higher than control groups and these in ART1-shRNA CT26 cells lower than control groups; the expression of p-p70S6K show counter-roductive result (A & B). Expressions of Rac1, PARP, LKB1, p-AMPK and p-p70S6K in subcutaneoustransplanted CT26 tumor fall in line with CT26 cells finding (C & D) (*P < 0.05; **P < 0.01).
Changes of p-p70S6K and LC3B in starvation-induced GFP-ART1 CT26 cells treated with 5-AIQ or NSC23766
To provide additional evidence for regulation of starvation-induced autophagy by ART1 through mTOR mediation via PARP-1 and Rac1, the effect of inhibitors of Rac1 or PARP-1 in starvation-induced GFP-ART1 cells was investigated. The activity of mTOR, reflected by the expression of p-p70S6K, was enhanced in starvation-induced GFP-ART1 groups with inhibitors of Rac1 (P < 0.05) or PARP-1 (P < 0.01) (Figure 5C-F). The expression of autophagy marker protein LC3B decreased in inhibitors treated group (P < 0.01) (Figure 4A-D).
Figure 5.
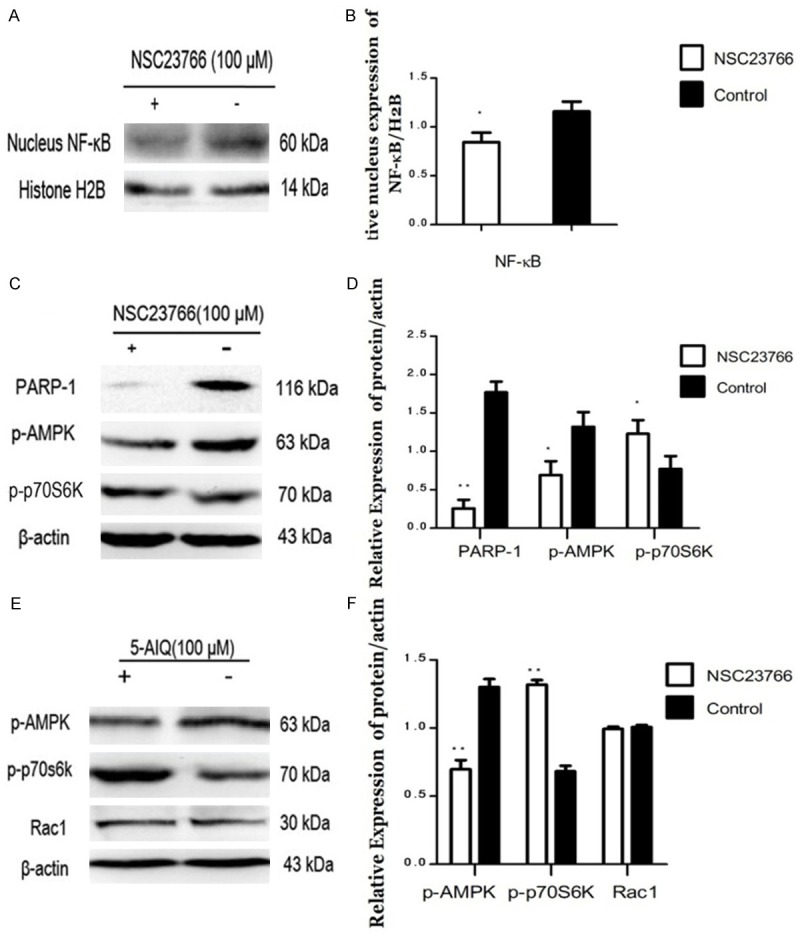
Effects of inhibitor of Rac1 or PARP-1 on regulating NF-κB, PARP-1, p-AMPK andp-p70S6K in GFP-ART1 CT26 cells under starvation-induced conditions. The expression of NF-κB in nucleus decreased in GFP-ART1 CT26 cells which treated with inhibitor of Rac1, NSC23766 (*P < 0.05) (A & B). The expressions of PARP-1 and p-AMPK reduce and the expression of p-p70S6K increase in the GFP-ART1 CT26 cells which treated with NSC23766 (*P < 0.05) (C & D). After being treated with inhibitor of PARP-1, 5-AIQ, the expression of p-AMPK also decreased and the expression of p-p70S6K increased, compared with GFP-ART1 without 5-AIQ (**P < 0.01) (E & F).
Figure 4.
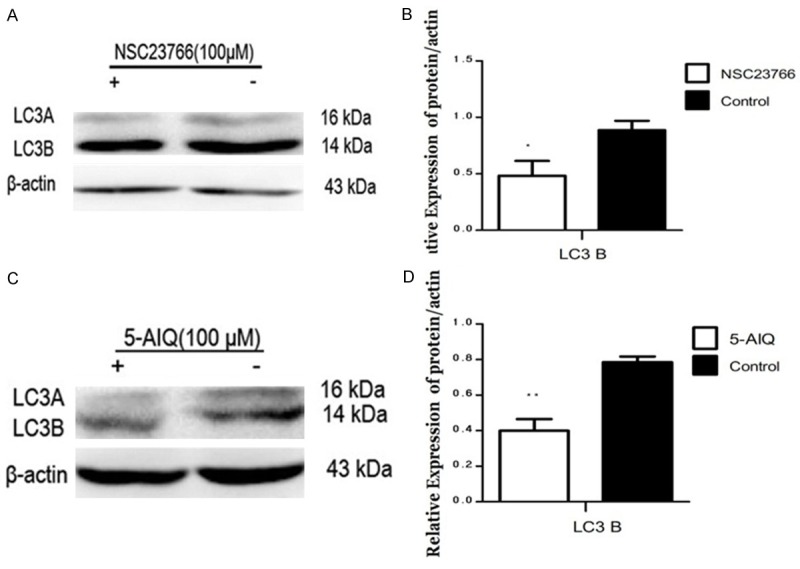
Effect of inhibitor of PAPR-1 or Rac1 on regulating LC3B in GFP-ART1 CT26 cells under starvation-induced conditions. After being disposed with NSC23766 (**P < 0.01) (A & B) and 5-AIQ (*P < 0.05) (C & D) respectively, the expression of LC3 B in GFP-ART1 CT26 cells both decreased compared with GFP-ART1 group without inhibitor.
Changes in levels of NF-κB, PARP-1 and p-AMPK in starvation-induced GFP-ART1 CT26 cells treated with 5-AIQ or NSC23766
To explore whether Rac1 could regulate PARP-1 and its downstream factor p-AMPK through NF-κB, starvation-induced GFP-ART1 CT26 cells were treated with NSC23766. Compared to the control group, expressions of NF-κB (nucleus), PARP-1 and p-AMPK decreased in the GFP-ART1 group treated with NSC23766 (P < 0.05) (Figure 5A-D). There was no significant change in the expression of Rac1 when GFP-ART1 CT26 cells were treated with an inhibitor of PARP-1 (5-AIQ). However, the expression of p-AMPK was lower than in starvation-induced GFP-ART1 CT26 without 5-AIQ (P < 0.01) (Figure 5E, 5F).
The interaction between ART1 and integrin α7
To determine whether ART1 interacts with integrin α7, co-immunoprecipitation was performed on extracts of starvation-induced ART1-GFP CT26 cells and vector control CT26 cells. Under starvation, the ART1-integrin α7 complex protein was evident in GFP-ART1 CT26 cells and vector control CT26 cells as well (Figure 6).
Figure 6.
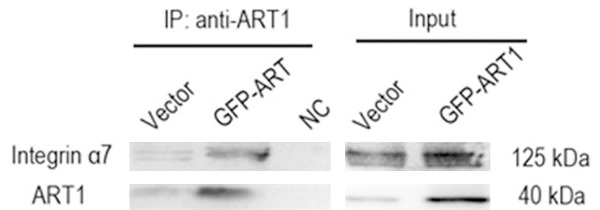
Integrin α7 interacts with ART1 in CT26 cells. Western blot analysis of the co-IP complex following incubation of GFP-ART1 CT26 cells and Vector CT26 cells lysates with ART1 antibody. Integrin α7 was obviously detected in IP product of GFP-ART1 group. NC; negative control group used IgG instead of ART1 antibody to incubate the lysate of GFP-ART1 CT26 cells.
Change of proliferation in starvation-treated GFP-ART1 CT26 cells treated with different concentrations of 3-MA
Starvation-treated GFP-ART1 CT26 cells treated with 3-MA at different concentrations (0 mM, 1 mM, 3 mM, 5 mM, 7 mM)were detected with CCK-8. This showed the proliferation of starvation-induced GFP-ART1 CT26 cells was clearly decreased with increasing concentrations of 3-MA (P < 0.05) (Figure 7A). To discount the possibility that proliferation was affected by the death of cells induced by the inhibitor, Trypan blue staining was used to count dead cells, from which a cellular growth curve was drawn. There was no clear difference among the groups treated with 3 mM, 5 mM and 7 mM 3-MA (P > 0.05) (Figure 7B).
Figure 7.
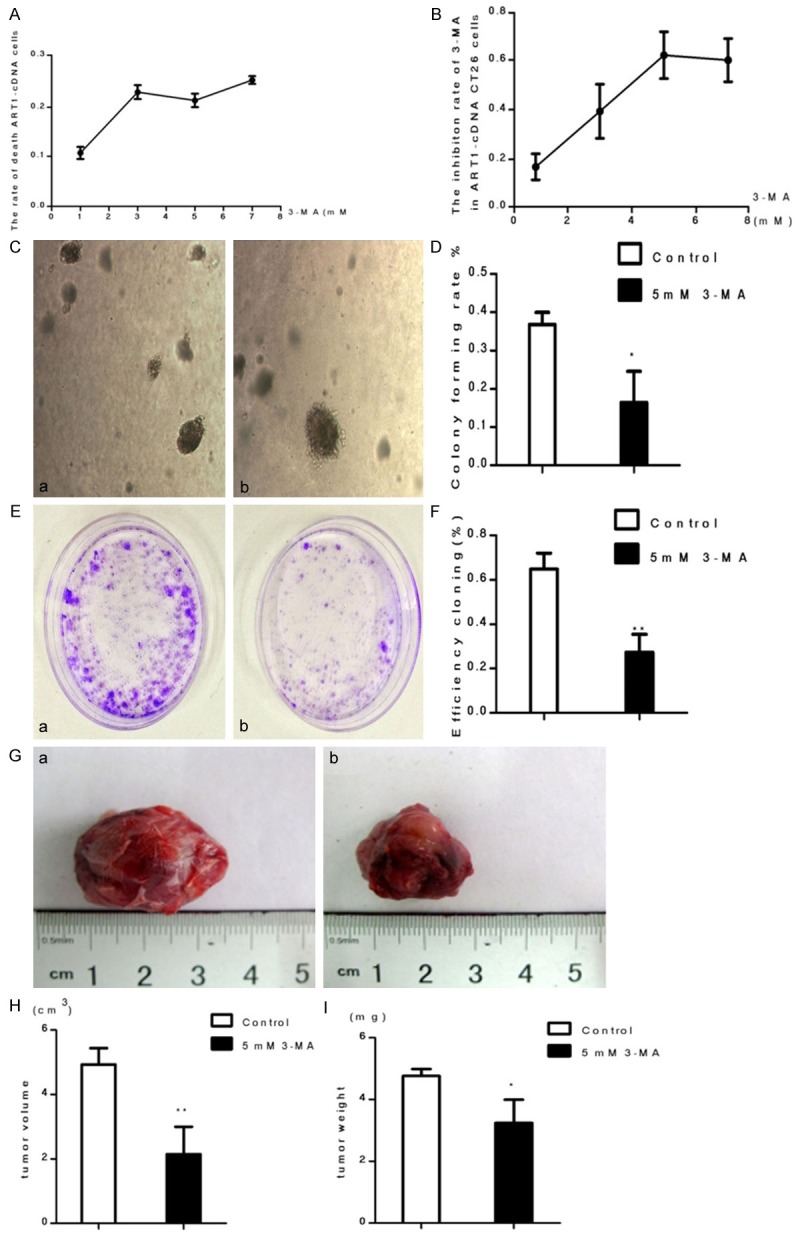
The ability of growth in GFP-ART1 CT26 cells was inhibited by 3-MA under starvatvation-induced conditions. The growth inhibite ratio of GFP-ART1 cells,which detected with CCK-8, increase along with the increasing concentration of 3-MA (*P < 0.05) (A). Cell counting with trypanblau dying show the rate of GFP-ART1 cells death with different concentrations 3-MA (3 mM, 5 mM and 7 mM) was not statistically significant (p > 0.05) (B). Compared to GFP-ART1 untreated 3-MA, the growth ability of GFP-ART1 CT26 cells decrease in 3-MA treated group, which detected with soft agar assay (*P < 0.05) (C & D) and plate cloning assay (**P < 0.01) (E & F) respectively. The weithgt (*P < 0.05) and volume of subcutaneous tumor (**P < 0.01) in BALB/c mice show smaller in 3-MA treated BALB/c mice than control BALB/c mice which untreated with 3-MA (G-I).
Change of growth in starvation-induced GFP-ART1 group treated with 3-MA
Soft agar assay and plate cloning assay showed that the growth ability of starvation-induced GFP-ART1 CT26 cells was diminished when they treated with 3-MA (5 mM), compared with the control group (P < 0.05) (Figure 7C-F). The volume and weight of subcutaneously transplanted GFP-ART1 CT26 tumors in BALB/c mice treated with 3-MA were both less than those in control groups (P < 0.05) (Figure 7G-I).
Change of apoptotic ability of starvation-induced GFP-ART1 group treated with 3MA
Flow cytometry was used to detect the rate of apoptosis. The results showed that the rate of apoptosis was higher in GFP-ART1 CT26 cells treated with 3-MA than in cells with no 3-MA treatment (P < 0.01) (Figure 8A, 8B). Condensed chromatin and apoptotic bodies were detected with Hoechst33342 staining. Comparatively, there were more cells with apoptotic hallmarks in starvation-induced GFP-ART1 CT26 cells with 3-MA than in starvation-induced GFP-ART1 cells without 3-MA (P < 0.01) (Figure 8C, 8D).
Figure 8.
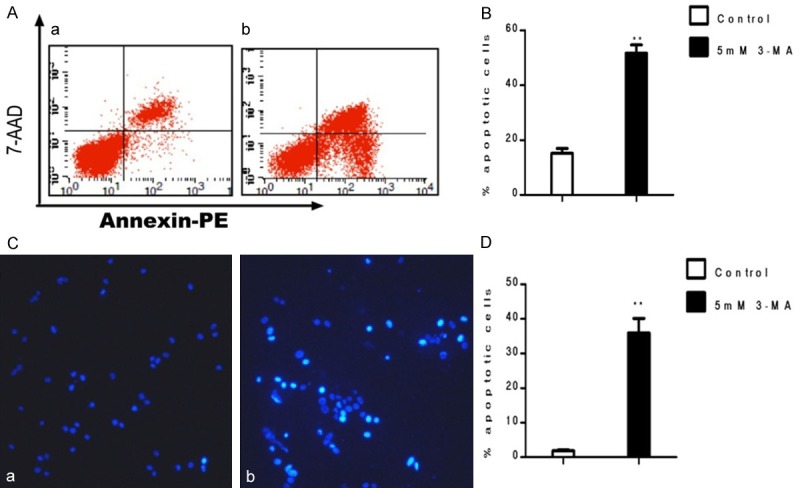
Apoptosis of GFP-ART1 CT26 cells was promoted by 3-MA under starvation-induced conditions. Compared to the contol group, the increase of apoptosis rate detecting by FCM show in 5 mM 3-MA teated GFP-ART1 CT26 celll (**P < 0.01) (A & B). The increase rate of apoptotic bodies and condensed chromatin detectig with Hochest 3342 show in 3-MA treated group which compared with control group (**P < 0.01) (C & D).
Discussion
Starvation-induced autophagy has been related to various diseases, including cancer. Shortage of nutrients is often the case in tumor microenvironments. In the early phase of development of cancer, autophagy may serve as a survival mechanism to help cells to fully utilize the limited energy when tumors have no vascular supply and thus need to survive under nutritional stress [21]. In colorectal cancer, researchers have already proved that biogenesis of autophagosomes could be enhanced when colorectal cancerous cells are under starvation and the autophagosomes only form in cancer cells rather than in adjacent noncancerous epithelial cells [22]. In colorectal cancer, most experimental data tend to recognize autophagy as contributing factor in the aggressiveness of tumor cells [22,23]. In spite of this, influencing factors in starvation-induced autophagy may play an important role in regulating cancer development. However, the mechanism is not clear. ART1 is one of the most important enzymes catalyzing arginine-specific mono-ADP-ribosylation, which regulates the function of the protein substrate by mono-ADP-ribosylation. In our previous studies, ART1 was reported to participate in the regulation of invasion, proliferation and apoptosis in colon carcinoma. However, there is no report on the role of ART1 in autophagy. In this study, we observed that the formation of autophagosomes and the expression of autophagy-related proteins (LC3B) increased in starvation-induced GFP-ART1 CT26 cells compared to control groups under starvation treatment. Contrastingly, in starvation-induced ART1-shRNA CT26 cells, biogenesis of autophagosomes was not observed and autophagy-related proteins also decreased, compared to other groups. Moreover, autophagosomes were not detected in GFP-ART1, ART1-shRNA, untransfected and vector control groups without starvation. Our results indicate that ART1 has effects on starvation-induced autophagy, as overexpressed ART1 in CT26 cells promoted starvation-induced autophagy and silenced ART1 in CT26 cells suppressed starvation-induced autophagy.
Autophagy also may have synergistic effect on apoptosis, hence affecting the development of colorectal carcinoma. Other authors have also reported that the expressions of autophagy-related gene LC3 and Beclin-1 increase in colorectal carcinoma and these expressions are in accordance with those of anti-apoptotic genes p53 and Bcl-2 [24]. Under conditions in which apoptosis was induced with 5-fluorouracil (5-FU) or cisplatin, the apoptosis increased when autophagy was inhibited by 3-MA [25,26]. Reagents which inhibit autophagy are even thought as a combination therapy with antitumor drugs to enhance the therapeutic effect [27]. In order to study the effect of starvation-induced autophagy mediated by ART1 in the progression of CT26 cells, we observed the apoptosis and growth ability of GFP-ART1 group in the absence or presence of 3-MA. Data from the present study show that inhibition of starvation-induced autophagy in ART1-GFP CT26 cells promotes apoptosis and inhibits proliferation. This suggests that autophagy, which is regulated by ART1, may contribute to the survival of cancer cells under starvation conditions.
Rac1, which belongs to Rho family of GTPases, is a pivotal regulator of the actin cytoskeleton, gene transcription and cell adhesion [28]. The activity of Rac1 can be regulated by a major downstream factor of integrin α7 [29,30]. Studies have showed that the interaction between ART1 and integrin α7 could lead to an increased combination of its α7β1 dimer 4 with downstream factor, which could enhance the activity of Rac1 [31]. The combination of integrin α7 and ART1 with glycosylphosphatidylinositol (GPI) is recognized as the basic structure for ART1 catalyzing mono-ADP-ribosylation of integrin α7 [11,32]. In the present study, we observed the protein-protein interaction between ART1 and integrin α7 in CT26 cells using co-immunoprecipitation and the results indicated that ART1 could combine with integrin α7 in colon carcinoma cells. We also observed that the expression of Rac1 was increased in the ART1-GFP group and was silenced in the ART1-shRNA group. Regulation of Rac1 by ART1 is likely, owing to the influence of ART1 on integrin α7. Adam et. al. also showed that, when Rac1 was down-regulated with siRNA or inhibited with NSC23766, the activity of NF-κB decreased in lung carcinoma [33]. Interestingly, our previous study demonstrated that ART1 could influence the expression of PARP-1 by affecting the activity of NF-κB in CT26 cells [17]. In order to verify that ART1 could influence a change in PARP-1 through the Rac1-NF-κB pathway, we analyzed the change in NF-κB and PARP-1 when GFP-ART1 group was treated with an inhibitor of Rac1. The GFP-ART1 group treated with an inhibitor of Rac1 showed lower expression of NF-κB in the cell nuclei than in GFP-ART1 group without inhibitor. The expression of PARP-1 also decreased in the GFP-ART1 group after treatment with Rac1 inhibitor. Consequently, we propose that the effect of ART1 on Rac1 through integrin α7 mediates the activity of NF-κB and decreases the expression of PARP-1.
Poly (ADP-ribose) polymerase-1 (PARP-1), which catalyzes poly-ADP-ribosylation, uses the ADP-ribose moiety of NAD+ to build a polyanionic polymer (polyADP-ribose) on target proteins [34]. It is involved in a variety of biological processes relevant to DNA damage, apoptosis, development and treatment of cancer. Some scientists have shown that PARP-1 can also mediate the liver kinase B1 (LKB)-AMP activated protein kinase (AMPK) pathway to influence mTOR, an important regulator of autophagy which could modulate the phosphorylation of downstream proteins to participate in the initiation of autophagy under conditions of oxidative stress and DNA damage [35]. In this pathway, LKB1 could directly activate AMPK. The activation of AMPK could phosphorylate raptor, an essential subunit of mTOR, to inhibit the activity of mTOR, leading to inhibition of the proliferation and growth of cells [36]. However, in response to cellular stress or energy starvation, the activation of AMPK could lead to the depletion of energy for cell growth and proliferation and cell survival [37]. Huang and Shen also posited that PARP-1 could induce autophagy through the activation of the LKB1-AMPK-mTOR pathway under conditions of DNA damage and oxidative stress [38]. Depletion or inhibition of PARP-1 prevents the depletion of ATP and NAD+ and activates mTOR, resulting in the lack of autophagic features in fibroblast cell [35]. Under oxidative stress, autophagy induced by the PARP-1-LKB1-AMPK-mTOR system plays a cytoprotective role by preventing cell death [39]. Is the influence of ART1 in starvation-induced autophagy dependent on regulating the pathway PARP-1-LKB1-AMPK-mTOR? The results of the present study showed that expressions of PARP-1, LKB1, and p-AMPK were increased in the GFP-ART1 group and decreased in ART1-shRNA group, compared to control groups under starvation conditions. However, expression of p-p70S6k, which reflects the activity of mTOR, showed the opposite effects. In view of this, ART1 may participate in starvation-induced autophagy through the PARP-1-LKB1-AMPK-mTOR system. To confirm this inference, GFP-ART1 CT26 cells were treated with 5-AIQ, an inhibitor of PARP-1. The expressions of LC3B and p-AMPK decreased in the GFP-ART1 group after treatment with 5-AIQ; however, expression of p-p70S6k increased. These results may confirm the assertion that ART1 regulates starvation-induced autophagy through PARP-1-LKB1-AMPK-mTOR.
In conclusion, ART1 is likely to promote starvation-induced autophagy in colorectal carcinoma. Inhibition of starvation-induced autophagy mediated by ART1 could be conducive to the survival colorectal tumor cells during starvation. The molecular mechanism of the participation of ART1 in mediating starvation-induced autophagy is proposed to be as follows: ART1 may interact with integrin α7 and then participate in the regulation of expression or activity of Rac1 and NF-κB. Differences in the expression of NF-κB could affect the expression of PARP-1 and, therefore, influence the activity of LKB1, AMPK and mTOR, leading to changes in autophagy. Moreover, the regulation of mTOR by Rac1 contradicts findings from previous researches which suggested that Rac1 could promote the activity of mTOR. It is not clear whether these differences in results may be due to the notion that cell activation signaling is selected under stressed conditions. ART1 promotes starvation-induced autophagy and could enhance colon carcinoma cell survival. Inhibition of ART1 may serve as an adjunct therapy in the treatment of colon carcinoma.
Acknowledgements
This study was supported by the Ministry of Education Specialized Research Fund for the Doctoral Program of Higher Education (Grant No. 20105503110009), the Science and Technology Program of Chongqing Municipal Education Commission (Grant No. KJ110322) and the National Nature Science Foundation of China (NSFC: 30870946).
Disclosure of conflict of interest
No conflict of interest exits in the submission of this manuscript.
References
- 1.Mizushima N. Autophagy: process and function. Genes Dev. 2007;21:2861–2873. doi: 10.1101/gad.1599207. [DOI] [PubMed] [Google Scholar]
- 2.Levine B, Klionsky DJ. Development by self-digestion: molecular mechanisms and biological functions of autophagy. Developmental cell. 2004;6:463–477. doi: 10.1016/s1534-5807(04)00099-1. [DOI] [PubMed] [Google Scholar]
- 3.Kabeya Y, Mizushima N, Ueno T, Yamamoto A, Kirisako T, Noda T, Kominami E, Ohsumi Y, Yoshimori T. LC3, a mammalian homologue of yeast Apg8p, is localized in autophagosome membranes after processing. EMBO J. 2000;19:5720–5728. doi: 10.1093/emboj/19.21.5720. [DOI] [PMC free article] [PubMed] [Google Scholar]
- 4.Levine B, Kroemer G. Autophagy in the pathogenesis of disease. Cell. 2008;132:27–42. doi: 10.1016/j.cell.2007.12.018. [DOI] [PMC free article] [PubMed] [Google Scholar]
- 5.Eskelinen EL. The dual role of autophagy in cancer. Curr Opin Pharmacol. 2011;11:294–300. doi: 10.1016/j.coph.2011.03.009. [DOI] [PubMed] [Google Scholar]
- 6.Degenhardt K, Mathew R, Beaudoin B, Bray K, Anderson D, Chen G, Mukherjee C, Shi Y, Gélinas C, Fan Y. Autophagy promotes tumor cell survival and restricts necrosis, inflammation, and tumorigenesis. Cancer Cell. 2006;10:51–64. doi: 10.1016/j.ccr.2006.06.001. [DOI] [PMC free article] [PubMed] [Google Scholar]
- 7.Yang S, Wang X, Contino G, Liesa M, Sahin E, Ying H, Bause A, Li Y, Stommel JM, Dell’Antonio G. Pancreatic cancers require autophagy for tumor growth. Genes Dev. 2011;25:717–729. doi: 10.1101/gad.2016111. [DOI] [PMC free article] [PubMed] [Google Scholar]
- 8.Scherz-Shouval R, Elazar Z. ROS, mitochondria and the regulation of autophagy. Trends Cell Biol. 2007;17:422–427. doi: 10.1016/j.tcb.2007.07.009. [DOI] [PubMed] [Google Scholar]
- 9.Zolkiewska A, Nightingale MS, Moss J. Molecular characterization of NAD: arginine ADP-ribosyltransferase from rabbit skeletal muscle. Proc Natl Acad Sci U S A. 1992;89:11352–11356. doi: 10.1073/pnas.89.23.11352. [DOI] [PMC free article] [PubMed] [Google Scholar]
- 10.Moss J, Balducci E, Cavanaugh E, Kim HJ, Konczalik P, Lesma EA, Okazaki IJ, Park M, Shoemaker M, Stevens LA. ADP-Ribosylation Reactions: From Bacterial Pathogenesis to Cancer. Springer; 1999. Characterization of NAD: arginine ADP-ribosyltransferases; pp. 109–113. [PubMed] [Google Scholar]
- 11.Laing S, Unger M, Koch-Nolte F, Haag F. ADP-ribosylation of arginine. Amino Acids. 2011;41:257–269. doi: 10.1007/s00726-010-0676-2. [DOI] [PMC free article] [PubMed] [Google Scholar]
- 12.Zolkiewska A, Moss J. Processing of ADP-ribosylated integrin alpha 7 in skeletal muscle myotubes. J Biol Chem. 1995;270:9227–9233. doi: 10.1074/jbc.270.16.9227. [DOI] [PubMed] [Google Scholar]
- 13.Paone G, Wada A, Stevens LA, Matin A, Hirayama T, Levine RL, Moss J. ADP ribosylation of human neutrophil peptide-1 regulates its biological properties. Proc Natl Acad Sci U S A. 2002;99:8231–8235. doi: 10.1073/pnas.122238899. [DOI] [PMC free article] [PubMed] [Google Scholar]
- 14.Jones EM, Baird A. Cell-surface ADP-ribosylation of fibroblast growth factor-2 by an arginine-specific ADP-ribosyltransferase. Biochem J. 1997;323:173–177. doi: 10.1042/bj3230173. [DOI] [PMC free article] [PubMed] [Google Scholar]
- 15.Saxty BA, Yadollahi-Farsani M, Upton PD, Johnstone SR, MacDermot J. Inactivation of platelet-derived growth factor-BB following modification by ADP-ribosyltransferase. Br J Pharmacol. 2001;133:1219–1226. doi: 10.1038/sj.bjp.0704187. [DOI] [PMC free article] [PubMed] [Google Scholar]
- 16.Su Y, Guan XQ, Liu FQ, Wang YL. The effects of MIBG on the invasive properties of HepG2 hepatocellular carcinoma cells. Int J Mol Med. 2014;34:842–8. doi: 10.3892/ijmm.2014.1819. [DOI] [PubMed] [Google Scholar]
- 17.Tang Y, Wang YL, Yang L, Xu JX, Xiong W, Xiao M, Li M. Inhibition of arginine ADP-ribosyltransferase 1 reduces the expression of poly (ADP-ribose) polymerase-1 in colon carcinoma. Int J Mol Med. 2013;32:130–136. doi: 10.3892/ijmm.2013.1370. [DOI] [PubMed] [Google Scholar]
- 18.Xiao M, Tang Y, Wang YL, Yang L, Li X, Kuang J, Song GL. ART1 Silencing Enhances Apoptosis of Mouse CT26 Cells via the PI3K/Akt/NF-κB Pathway. Cell Physiol Biochem. 2013;32:1587–1599. doi: 10.1159/000356595. [DOI] [PubMed] [Google Scholar]
- 19.Kuang J, Wang YL, Xiao M, Tang Y, Chen WW, Song GL, Yang X, Li M. Synergistic effect of arginine-specific ADP-ribosyltransferaseá1 and poly (ADP-ribose) polymerase-1 on apoptosis induced by cisplatin in CT26 cells. Oncol Rep. 2014;31:2335–2343. doi: 10.3892/or.2014.3100. [DOI] [PubMed] [Google Scholar]
- 20.Li J, Hou N, Faried A, Tsutsumi S, Kuwano H. Inhibition of autophagy augments 5-fluorouracil chemotherapy in human colon cancer in vitro and in vivo model. Eur J Cancer. 2010;46:1900–1909. doi: 10.1016/j.ejca.2010.02.021. [DOI] [PubMed] [Google Scholar]
- 21.Levine B. Cell biology: autophagy and cancer. Nature. 2007;446:745–747. doi: 10.1038/446745a. [DOI] [PubMed] [Google Scholar]
- 22.Sato K, Tsuchihara K, Fujii S, Sugiyama M, Goya T, Atomi Y, Ueno T, Ochiai A, Esumi H. Autophagy is activated in colorectal cancer cells and contributes to the tolerance to nutrient deprivation. Cancer Res. 2007;67:9677–9684. doi: 10.1158/0008-5472.CAN-07-1462. [DOI] [PubMed] [Google Scholar]
- 23.Zheng HY, Zhang XY, Wang XF, Sun BC. Autophagy enhances the aggressiveness of human colorectal cancer cells and their ability to adapt to apoptotic stimulus. Cancer Biol Med. 2012;9:105–110. doi: 10.3969/j.issn.2095-3941.2012.02.004. [DOI] [PMC free article] [PubMed] [Google Scholar]
- 24.Sui YQ, Feng YZ. Expression and clinical significance of autophagy-related genes LC3, Beclin-1 and apoptosis-related genes p53, BCL-2 in colorectal carcinoma [J] . Chinese Journal of Clinical and Experimental Pathology. 2012;3:014. [Google Scholar]
- 25.Li J, Hou N, Faried A, Tsutsumi S, Takeuchi T, Kuwano H. Inhibition of autophagy by 3-MA enhances the effect of 5-FU-induced apoptosis in colon cancer cells. Ann Surg Oncol. 2009;16:761–771. doi: 10.1245/s10434-008-0260-0. [DOI] [PubMed] [Google Scholar]
- 26.Liu D, Yang Y, Liu Q, Wang J. Inhibition of autophagy by 3-MA potentiates cisplatin-induced apoptosis in esophageal squamous cell carcinoma cells. Med Oncol. 2011;28:105–111. doi: 10.1007/s12032-009-9397-3. [DOI] [PubMed] [Google Scholar]
- 27.Bartnik A, Loizidou M, Winslet M, Yang SY. Autophagy and Colorectal Cancer Therapy. Oncology News. 2011;5:188–189. [Google Scholar]
- 28.Raftopoulou M, Hall A. Cell migration: Rho GTPases lead the way. Dev Biol. 2004;265:23–32. doi: 10.1016/j.ydbio.2003.06.003. [DOI] [PubMed] [Google Scholar]
- 29.Matsuo N, Terao M, Nabeshima YI, Hoshino M. Roles of STEF/Tiam1, guanine nucleotide exchange factors for Rac1, in regulation of growth cone morphology. Mol Cell Neurosci. 2003;24:69–81. doi: 10.1016/s1044-7431(03)00122-2. [DOI] [PubMed] [Google Scholar]
- 30.Zhou Y, Jiang D, Thomason DB, Jarrett HW. Laminin-induced activation of Rac1 and JNKp46 is initiated by Src family kinases and mimics the effects of skeletal muscle contraction. Biochemistry. 2007;46:14907–14916. doi: 10.1021/bi701384k. [DOI] [PMC free article] [PubMed] [Google Scholar]
- 31.Zhao Z, Gruszczynska-Biegala J, Zolkiewska A. ADP-ribosylation of integrin alpha7 modulates the binding of integrin alpha7beta1 to laminin. Biochem J. 2005;385:309–317. doi: 10.1042/BJ20040590. [DOI] [PMC free article] [PubMed] [Google Scholar]
- 32.Zolkiewska A, Moss J. Integrin alpha 7 as substrate for a glycosylphosphatidylinositol-anchored ADP-ribosyltransferase on the surface of skeletal muscle cells. J Biol Chem. 1993;268:25273–25276. [PubMed] [Google Scholar]
- 33.Gastonguay A, Berg T, Hauser AD, Schuld N, Lorimer E, Williams CL. The role of Rac1 in the regulation of NF-κB activity, cell proliferation, and cell migration in non-small cell lung carcinoma. Cancer Biol Ther. 2012;13:647. doi: 10.4161/cbt.20082. [DOI] [PMC free article] [PubMed] [Google Scholar]
- 34.Helleday T, Bryant HE, Schultz N. Poly (ADP-ribose) polymerase (PARP-1) in homologous recombination and as a target for cancer therapy. Cell Cycle. 2005;4:1176–1178. doi: 10.4161/cc.4.9.2031. [DOI] [PubMed] [Google Scholar]
- 35.Muñoz-Gámez JA, Rodríguez-Vargas JM, Quiles-Pérez R, Aguilar-Quesada R, Martín-Oliva D, de Murcia G, Menissier de Murcia J, Almendros A, Ruiz de Almodovar M, Oliver FJ. PARP-1 is involved in autophagy induced by DNA damage. Autophagy. 2009;5:61–74. doi: 10.4161/auto.5.1.7272. [DOI] [PubMed] [Google Scholar]
- 36.Gwinn DM, Shackelford DB, Egan DF, Mihaylova MM, Mery A, Vasquez DS, Turk BE, Shaw RJ. AMPK phosphorylation of raptor mediates a metabolic checkpoint. Molecular Cell. 2008;30:214–226. doi: 10.1016/j.molcel.2008.03.003. [DOI] [PMC free article] [PubMed] [Google Scholar]
- 37.Hardie DG. AMP-activated/SNF1 protein kinases: conserved guardians of cellular energy. Nat Rev Mol Cell Biol. 2007;8:774–785. doi: 10.1038/nrm2249. [DOI] [PubMed] [Google Scholar]
- 38.Huang Q, Shen HM. To die or to live. Autophagy. 2009;5:273–276. doi: 10.4161/auto.5.2.7640. [DOI] [PubMed] [Google Scholar]
- 39.Huang Q, Wu Y, Tan H, Ong C, Shen H. A novel function of poly (ADP-ribose) polymerase-1 in modulation of autophagy and necrosis under oxidative stress. Cell Death Differ. 2008;16:264–277. doi: 10.1038/cdd.2008.151. [DOI] [PubMed] [Google Scholar]


