

Abstract
Even in the presence of oxygen most cancer cells convert glucose to lactate via pyruvate instead of performing oxidative phosphorylation (aerobic glycolysis-Warburg effect). Thus, it has been considered to shift pyruvate - the metabolite of aerobic glycolysis - to acetylCoA by activation of pyruvate dehydrogenase (PDH). AcetylCoA will then be metabolized by oxidative phosphorylation. Therefore, the purpose of this study was to shift tumor cells from aerobic glycolysis to oxidative phosphorylation using dichloroacetate (DCA), an inhibitor of PDH-kinase. The effects of DCA were assayed in vitro in Neuro-2a (murine neuroblastoma), Kelly and SK-N-SH (human neuroblastoma) as well as SkBr3 (human breast carcinoma) cell lines. The effects of DCA on tumor development were investigated in vivo using NMRI nu/nu mice bearing subcutaneous Neuro-2a xenografts. For that purpose animals were treated continuously with DCA in the drinking water. Tumor volumes were monitored using caliper measurements and via [18F]-FDG-positron emission tomography. DCA treatment increased viability/proliferation in Neuro-2a and SkBr3 cells, but did not cause significant alterations of PDH activity. However, no significant effects of DCA could be observed in Kelly and SK-N-SH cells. Accordingly, in mice bearing Neuro-2a xenografts, DCA significantly increased tumor proliferation compared to mock-treated mice. Thus, we could demonstrate that DCA - an indicated inhibitor of tumor growth - efficiently promotes tumor growth in Neuro-2a cells in vitro and in vivo.
Keywords: Dichloroacetate, Warburg effect, [18F]-FDG uptake, Neuro-2a mouse model, cell proliferation
Introduction
Within the last decades dichloroacetate (DCA) has been established as an efficient therapeutic in treatment of lactic acidosis [1]. Furthermore it was demonstrated that DCA can act as an effective drug in cancer therapy [2,3]. DCA has been described to alter the glucose metabolism of cancer cells by inhibition of pyruvate dehydrogenase kinase (PDK), which is a negative regulator of pyruvate dehydrogenase (PDH) [4]. A high activity of pyruvate dehydrogenase is needed to sustain aerobic glucose turnover. Tumor cells are characterized by metabolizing pyruvate to lactate even in the presence of oxygen (Warburg effect), resulting in a decreased activity of pyruvate dehydrogenase [5]. It has been demonstrated that inhibition of PDK in cancer cells leads to mitochondrial membrane depolarization and enhanced generation of reactive oxygen species (ROS) finally forcing cells to undergo apoptosis [6]. Since cells of the Warburg type are highly dependent on glucose metabolism, administration of DCA could selectively affect cancer cells [5]. Moreover the capability of DCA to modulate cellular metabolism and to inhibit tumor growth has been demonstrated in endometrial cancer cells, in glioblastoma, in neuroblastoma, and in prostate cancer cells [7-10].
Based on these promising results our aim was to evaluate the anti-cancer effects of DCA on Neuro-2a neuroblastoma cells both in vitro and in vivo. Neuroblastoma is one of the most frequent solid cancers in early childhood, the median age at diagnosis being 17 months [11]. The cell of origin in neuroblastoma is thought to be derived from an incompletely committed precursor cell of neural crest origin [12]. Neuroblastoma is characterized by a heterogenous occurrence producing almost no symptoms in one patient and causing severe illness due to local invasion and/or wide dissemination in another patient. The 5-year survival rates of patients with neuroblastoma have increased from 52% (in the mid-seventies) to 74% (from 1999 to 2005). However, improved cure rates are due to more efficient treatment of patients suffering from the more benign form of the disease. In contrast, there was only a slight increase with regard to the therapeutic benefit in children with high-risk neuroblastoma [12]. Therefore, new therapeutic options are needed. As described above, DCA could be a promising compound to effectively reduce tumor load with only little side effects.
The aim of this study was to analyze the effect of DCA on the different neuroblastoma cell lines Neuro-2a, Kelly and SK-N-SH as well as on the breast cancer cell line SkBr3 in vitro. Moreover, efficacy of DCA was investigated in a nude mouse model bearing s.c. Neuro-2a tumors.
Materials and methods
Cell lines
The neuroblastoma cell lines Neuro-2a (ATCC®: CCL-131TM, murine), Kelly (DSMZ: ACC 355, human) and SK-N-SH (ATCC®: HTB-11TM, human) and the human breast carcinoma cell line SkBr3 (ATCC®: HTB-30TM) were cultivated at 37°C in a humidified atmosphere containing 5% CO2. Neuro-2a cells were grown as monolayers in Dulbeccos MEM containing 1g/l glucose, GlutaMAX-ITM and pyruvate (Gibco Invitrogen, Germany) supplemented with 10% FCS. Kelly and SK-N-SH cells were cultivated in RPMI 1640 (Biochrom AG, Germany) plus 10% FCS and SkBr3 cells were grown in Dulbeccos MEM (Biochrom AG, Germany) plus 10% FCS. Dichloroacetate (DCA) was obtained from Sigma-Aldrich, Germany.
Assessment of proliferation/viability by real time measurement of electrical impedance (xCELLigence assay)
The neuroblastoma cell lines Neuro-2a, Kelly and SK-N-SH (6,000 cells/well, respectively) as well as the breast cancer cell line SkBr3 (2,000 cells/well) were seeded in E-plates 16 (Roche, Germany). The E-plates are multi-well cell culture plates equipped with micro-electrodes at the bottom. They were placed on the real time cell analyzer (RTCA) of the xCELLigence system (Roche) and the cells were allowed to adhere overnight in a humidified atmosphere (37°C) containing 5% CO2. Following adhesion, cells were treated with 0.5, 1 and 5 mM of DCA. With the xCELLigence system the electrical impedance across the micro-electrodes of the E-plates was continuously measured. The impedance measurement (expressed as cell index) provides quantitative information about the biological status of the cells, including cell number, viability and morphology. Measurement of cell impedance was performed over 80 h.
Estimation of the mean diameter of Neuro-2a cells
Neuro-2a cells (2.5 × 10⁴/well) were seeded in 6-well plates and allowed to adhere overnight. The next day cells were treated with 0.5 mM, 1 mM and 5 mM of DCA for 48 h (in a total volume of 2 ml per well). Cells were harvested using 500 μl of trypsin/ EDTA per well for 2 min. Cells were pelleted by centrifugation (3 min, 300 g), the supernatant was discarded and the cell pellet was re-suspended in culture medium (1 ml). 50 μl of the cell suspension was diluted in 10 ml of the CASYTON solution (isotonic dilution liquid). The mean diameter of the cells was determined using the CASY cell counter according to the recommendations of the manufacturer (Roche, Germany).
Determination of pyruvate dehydrogenase (PDH) activity
One day after seeding (3 × 10⁷ cells per 175 cm2 flask), Neuro-2a cells were treated with 1 and 5 mM of DCA for up to 48 h. PDH activity was determined at 0, 24 and 48 h after administration of DCA. To this cells were lysed with 300 μl of a lysis buffer (M-PER containing protease inhibitors) and processed according to the manufacturer’s instructions (PDH Protein Quantity Microplate Assay Kit, Abcam, Cambridge, UK). Activity was measured using an ELISA reader at 450 nm (Bio-Tek 800) and was expressed as percentage of untreated control.
Animals and tumor model
Female NMRI nu/nu mice (Charles River Laboratories), 4 weeks old, bearing s.c. Neuro-2a tumors were used to examine therapeutic efficacy of DCA. Mice (five per cage) were housed in ventilated cages under standard conditions at 26°C and 50-60% humidity. Mice had free access to food and water except for a time frame of 6 h before performance of [18F]-FDG PET imaging. Mice were injected s.c. with 1 × 10⁶ Neuro-2a tumor cells in 100 μl of PBS close to the right shoulder. Three days after tumor cell inoculation animals were split into two groups (n = 5 each): one group had water supplemented with 300 mg/l of DCA, while the second group received normal drinking water without any supplementation. All animal experiments were conducted in accordance with the German federal law, the guidelines for protection of animals and under permission of the federal department of Upper Bavaria.
Determination of tumor volume
The tumor volume was determined by measuring height (a), width (b) and depth (c) with a sliding caliper. The volume was then calculated according to the volume of an ellipsoid (V = 4/3πabc). To check the results of these measurements, tumor volumes were also determined using the DICOM viewers OsiriX and Amide analyzing the data from [18F]-FDG PET images.
Tumor staging after DCA treatment using positron emission tomography (PET)
To monitor the impact of DCA on tumor growth five mice per group (DCA treated and untreated control) were selected. PET imaging was performed on days 4 and 11 after tumor cell inoculation. Mice were anesthetized using the inhalation anesthetic isoflurane for the length of the imaging sequence. Mice were imaged for 15 min in the prone position in a microPET Focus 120 scanner (Siemens Preclinical Solutions, Knoxville, TN, USA) after intravenous injection of 11.1 MBq [18F]-FDG per mouse.
Tumor/muscle ratio of [18F]-FDG uptake
To exclude imprecisions due to slight differences in the injected [18F]-FDG activities per animal and due to different body weights of the animals, tumor/muscle (T/M) ratios of [18F]-FDG uptake per mouse were calculated from the PET images. For this purpose the volume in a region of interest of the tumor (ROIT) was divided by the appropriate volume in the psoas muscle (ROIM). In this step the entire tumor and a well-defined area were used for calculation.
Statistics
Statistical analysis was performed using SPSS (version 19.0, IBM Corporation) and SigmaPlot 11.0 (Systat Software Inc.). Means and standard deviations were calculated. Results were interpreted as statistically significant with p-values < 0.05. A t-test was used to compare means of two independent samples and tests were Bonferroni adjusted.
Results
Real-time measurement of cell growth demonstrates an increase of viability after DCA treatment
Assessment of viability/proliferation of Neuro-2a cells via continuous measurement of electrical impedance using the xCelligence system displayed a DCA induced promotion of cell proliferation compared to untreated controls (Figure 1A). The stimulating effect of DCA first became evident at 44 h after seeding of the cells, i.e. 24 h after addition of DCA. At 72 h (42 h after administration of DCA) the cell index of Neuro-2a cells treated with 0.5 mM, 1 mM and 5 mM of DCA was higher than that of the untreated controls. Surprisingly, the highest increase of the cell index was observed at the lowest of the applied DCA concentrations (0.5 mM).
Figure 1.
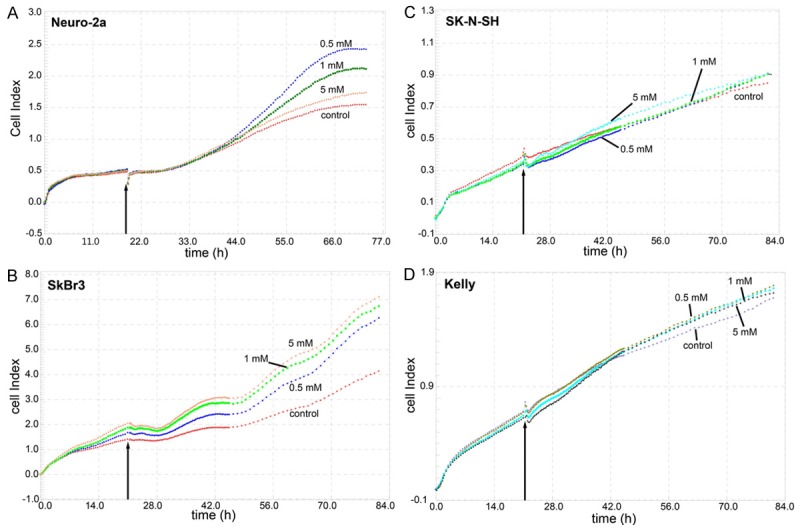
Real time measurement of DCA effects on cell proliferation/viability using the xCELLigence system. Neuro-2a (A), SkBr3 (B), SK-N-SH (C), and Kelly (D) cells were incubated with different concentrations of DCA approximately 20 h after seeding (arrow) and the cell index was continuously measured via the electrical impedance.
Due to these unexpected results, two human neuroblastoma cell lines and one human breast cancer cell line were analyzed accordingly for comparison. The results of these studies are shown in Figure 1B-D. Interestingly, DCA displayed a pro-proliferative effect also towards SkBr3 breast carcinoma cells. However, in contrast to Neuro-2a cells, the highest increase of the cell index of SkBr3 cells was observed with 5 mM of DCA (Figure 1B). In the two human neuroblastoma cell lines SK-N-SH and Kelly, only negligible pro- or anti-proliferative effects could be induced following application of 0.5 mM, 1 mM and 5 mM of DCA (Figure 1C, 1D). These results are in agreement with observations of Niewisch [13]. The unexpected results obtained with Neuro-2a and SkBr3 cells, prompted us to conduct further in vitro and in vivo experiments for clarification, exemplarily with Neuro-2a cells.
DCA treatment did not increase the size of Neuro-2a cells
The mean diameter of Neuro-2a cells was measured in order to exclude that an increase in cell size had caused the increase of the electrical impedance. No statistical significant differences in cell size could be observed between the untreated Neuro-2a cells and the cells treated with 0.5 mM, 1 mM and 5 mM DCA. Cells showed a mean diameter of 16.82 μm (± 1.01 μm) prior to seeding and of 16.17 μm (± 1.49 μm) 24 h post seeding. Treatment with 0.5 mM, 1 mM, and 5 mM DCA resulted in 15.63 μm (± 1.51 μm), 15.72 μm 8 ± 1.41 μm), and 15.77 μm (± 1.08) μm at 24 h and 15.36 μm (± 0.73 μm), 15.38 μm (± 0.8 μm) and 15.19 μm (± 0.84) μm at 48 h, respectively (n = 3). Therefore, the observed increase after DCA treatment is due to an increase of proliferation of Neuro-2a cells.
DCA triggered changes of pyruvate dehydrogenase (PDH) activity were not statistically significant
Incubation of Neuro-2a cells with 1 mM DCA resulted in an increase of PDH activity both at 24 h (117.6% of control) and at 48 h (135.4% of control) after treatment. 5 mM of DCA induced an increase of PDH activity at 24 h after treatment (125.7% of control) and at 48 h (134.8% of control) (Figure 2). However, all observed DCA triggered changes of PDH activity were not statistically significant (p = 0.244).
Figure 2.
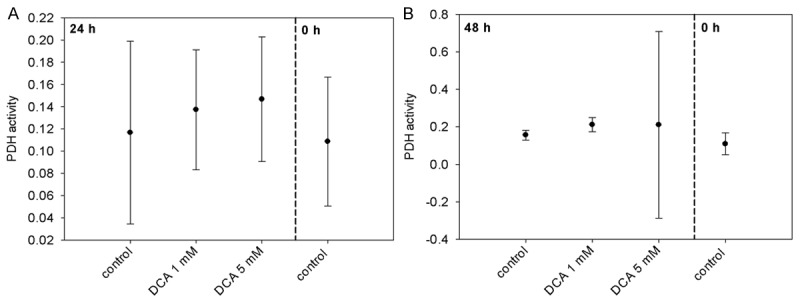
PDH activities of Neuro-2a cells 24 h (A) and 48 h (B) after treatment with DCA.
DCA promotes growth of Neuro-2a tumors in a mouse model
As illustrated in Figure 3, DCA treatment (300 mg/l in the drinking water) significantly increased the volumes of Neuro-2a tumors compared to tumors in mock-treated mice on days 4, 9 and 11 after initiation of treatment. At the end of the observation period, i.e. 11 d after allocation of DCA (14 d after tumor cell inoculation) the tumor volumes were 563.1 cmm (± 362.7 cmm) and 1426.1 cmm (± 334.1 cmm) in the mock-treated and the DCA treated animals, respectively. The experiment had to be stopped prematurely on day 12 due to the intense tumor growth in the DCA treatment group.
Figure 3.
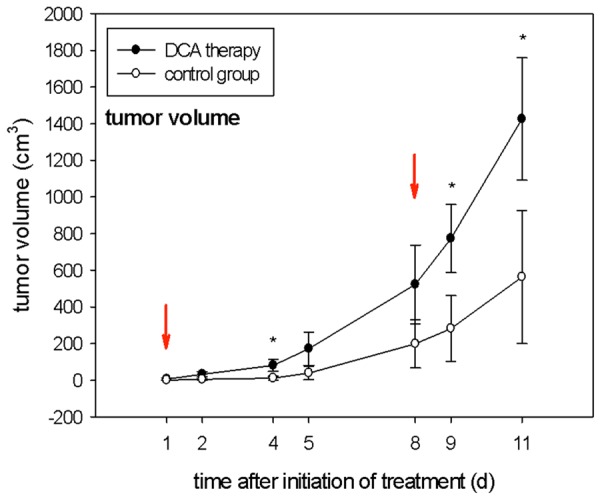
Tumor volumes (cm3) observed on days 1, 2, 4, 5, 8, 9, 11 after application of DCA in the drinking water compared with the mock-treated control group. Red arrows indicate the time points of PET scans; *indicates statistical significance (p < 0.05); n = 5 per group.
Advancement of Neuro-2a tumor growth by DCA could also be visualized using [18F]-FDG PET. As shown in Figure 4, tumor sizes in representative mock-treated and DCA treated mice did not differ on day one but clearly differed on day 8 after initiation of DCA treatment. DCA treatment of Neuro-2a cells did not result in an increased uptake of [18F]-FDG compared to untreated cells (data not shown). Therefore, the visible differences in [18F]-FDG PET imaging are clearly due to different tumor sizes.
Figure 4.
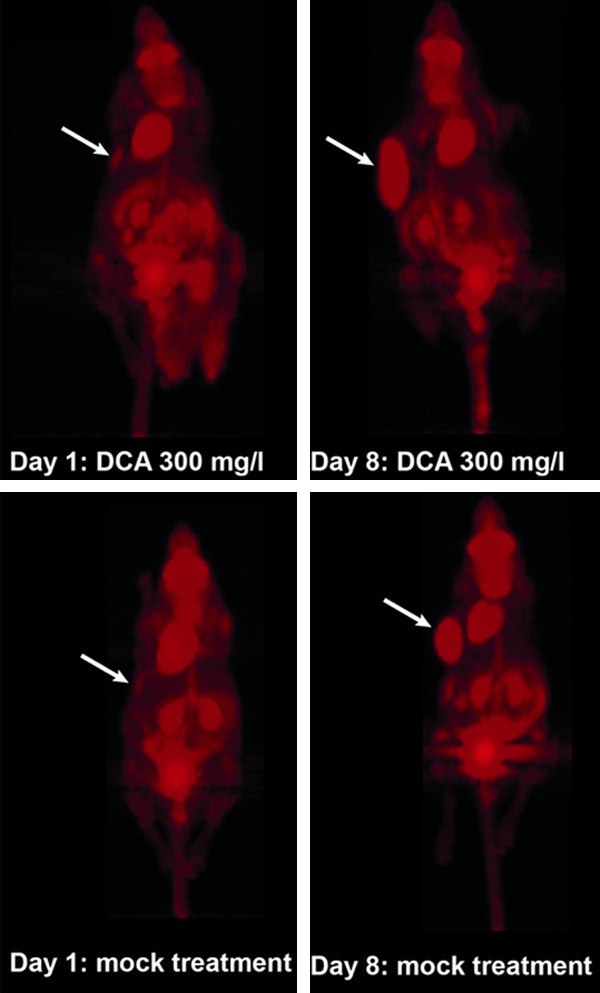
[18F]-FDG PET scans of Neuro-2a tumor bearing mice. Scans were performed on days 1 and 8 after application of DCA in the drinking water (300 mg/L) or mock-treatment (i.e. at days 4 and 11 after tumor cell inoculation). Arrows indicate locations of tumors.
DCA treatment results in increased tumor to muscle (T/M) ratios
Using maximum intensity PET images, tumor to muscle (T/M) ratios of the [18F]-FDG uptake were calculated with the DICOM viewers Amide and OsiriX. On day 4 after inoculation of Neuro-2a cells, i.e. one day after initiation of DCA treatment, T/M ratios in the treatment group (0.76 ± 0.07) and the control group (0.62 ± 0.61) were almost identical, as determined with Amide. However, on day 8 after initiation of DCA treatment, i.e. 11 days after tumor cell inoculation, the T/M ratios of the treatment group (18.3 ± 11.2) were elevated by a factor of 2.04 compared to the control group (8.97 ± 2.91). This result was confirmed using the DICOM viewer OsiriX: T/M ratios in DCA treated animals (0.52 ± 0.17) were 2.17 fold higher compared to untreated controls (0.24 ± 0.17) on day 8.
Discussion
Dichloroacetate (DCA) is a structurally simple, but potent agent that was suggested as a cancer therapeutic previously [6,14]. DCA has been reported to unfold its anti-proliferative and apoptosis inducing potential by inhibition of pyruvate dehydrogenase kinase [6]. Moreover, DCA might induce the “normalization” of hyperpolarized mitochondria of cancer cells, resulting in enhanced generation of reactive oxygen species (ROS) and subsequently programmed cell death [6]. As shown previously, DCA particularly targets those cells that are defective in the mitochondrial electron transport chain [14]. Keeping in mind that DCA offers anti-cancer properties at relatively low toxicity, our aim was to investigate the effects of DCA on neuroblastoma cells [4,15-19]. These cells have been reported to vary in their sensitivity towards the administration of DCA. Furthermore, it was postulated previously that the growth of undifferentiated neuroblastoma cells is specifically inhibited by DCA [9].
Surprisingly, in our experiments DCA treatment of the murine neuroblastoma cell line Neuro-2a resulted in an increase of proliferation with the strongest effect observed at 0.5 mM DCA. Treatment with DCA also enhanced proliferation of human SkBr3 breast cancer cells in a concentration dependent manner. In contrast, proliferation of the human neuroblastoma cell lines SK-N-SH and Kelly was neither promoted nor inhibited by treatment with up to 5 mM of DCA. These results are - at least partly - confirmed by findings of another study showing that DCA at low millimolar concentrations seems to have only minor effects on vitality, proliferation and apoptosis of neuroblastoma cell lines SK-N-SH and LS [13]. Beyond, concentrations of 1 and 2 mM DCA did not result in a significant shift from glycolysis to oxidative phosphorylation. In summary the authors concluded that DCA might not be a very effective drug with regard to eradication of differentiated neuroblastoma cells [13].
Furthermore, we could show that treatment of Neuro-2a cells with DCA resulted in a slight, but insignificant increase of pyruvate dehydrogenase (PDH) activity both after 24 h and 48 h (at 1 mM and 5 mM of DCA). This does not support the fact, that DCA might alter PDH activity significantly in Neuro-2a cells by inhibition of pyruvate dehydrogenase kinase. In another study it was shown that treatment with DCA enhances the flux of pyruvate into the mitochondria, promotes glucose oxidation and finally results in increased apoptosis [2]. These effects of DCA were confirmed by several independent groups in breast cancer cells, non-small cell lung cancer cells, glioblastoma, endometrial and prostate cancer cells [6-8]. It has been show that in A549, HL60, MCF-7 and PC3 cells apoptosis was induced preferably at DCA concentrations above 25 mM, and not at concentrations below 1 mM [14]. This points to the fact, that the effects of DCA might be dependent on the cell lines used for the experiments. Our data suggest that neuroblastoma cells in particular are not susceptible to DCA treatment at concentrations of up to 5 mM.
In accordance with the in vitro results, Neuro-2a tumors in NMRI nu/nu mice showed enhanced proliferation following DCA treatment. This tumor promoting effect was observed at a DCA concentration of 300 mg/l in the drinking water. The tumors that developed 11 d after allocation of DCA (14 d after tumor cell inoculation) were 2.5 fold (caliper measurements) or 2.2 fold (OsiriX quantification) larger than those of the control group. These findings are contradictory to the results of a previously published paper [6]. After subcutaneous injection of A549 human non-small cell lung cancer cells into nude athymic rats the animals were supplied with DCA added to the drinking water (75 mg/l). Treatment with DCA induced apoptosis and deceased tumor growth but did not induce toxic side effects towards the hematopoietic system. To confirm these results, DCA was administered intraperitoneally twice a day at a dose of 250 mg/kg given for 21 days or by supplementation in the drinking water at 0.075 mg/l in a athymic nude rat model of A549-ASC1 human lung tumor xenografts [14]. In this study parenteral administration of DCA was not effective in decreasing tumor growth whereas DCA showed activity against tumor xenografts when given orally. Unfortunately, the authors did not provide a possible explanation for this unexpected result. Moreover, it was investigated if a combined administration of DCA and capecitabine, a prodrug of 5-fluorouracil, could result in reduced tumor growth [20]. In an allograft model (female C57BL/6 mice) B16 melanoma cells and in a xenograft model (BALB/c-nu mice) A549 tumor cells were inoculated subcutaneously, respectively. DCA was added to the drinking water at a final concentration of 1.4 g/L. DCA enhanced the primary apoptotic effects of capecitabine in both B16 tumors and A549 non-small cell lung cancer cells. The authors concluded that DCA alone had only little antitumor effects [20].
[18F]-FDG PET imaging proved to be adequate to monitor development of Neuro-2a tumors in our study. Imaging data were confirmed by using the two different DICOM viewers Amide and OsiriX. Our results are in accordance with those of another study demonstrating that [18F]-FDG is particularly useful in imaging of neuroblastoma tumors in patients that do not express norepinephrine transporters and hence cannot be detected by Iodine-123 metaiodobenzylguanidine (MIBG) [21]. In this phase 1 study 14 children with relapsed neuroblastoma were enrolled with the aim to evaluate the functional response to new therapies. In patients expressing the norepinephrine transporter on tumor cells Iodine-123 MIBG scans proved to be more sensitive for individual lesion detection in relapsed neuroblastoma than FDG-PET scans. Nevertheless detection of neuroblastoma tumors that do not express the norepinephrine transporter was feasible using FDG-PET [21].
Besides it was demonstrated that DCA significantly reduces tumor proliferation in undifferentiated malignant neuroblastoma cells, whereas more differentiated cells are refractory to DCA treatment [9]. In this study the human neuroblastoma cell line SKNBE2 was injected subcutaneously into NOD-SCID mice. Intragastric treatment of mice with DCA caused a dose dependent cell cycle delay. Furthermore, tumor volumes after treatment with 2.5 mg/kg and 25 mg/kg of DCA were reduced by 30% and 55%, respectively.
On the other hand DCA has also been reported to be carcinogenic. DCA concentrations above 0.5 g/L in the drinking water induced cancer growth in B6C3F1 mice after exposure of up to 60 weeks [22]. Neoplasia was firstly detected between 30 and 35 weeks in animals treated with 3.5 and 5.0 g/L of DCA, respectively. A maximum tumor incidence was observed at 2 g/l DCA by 60 weeks. The exact mechanism by which DCA induces these malignant lesions remained unclear. The authors of the study suggested that exposure to DCA in chronic, low-dose concentrations might result in epigenetic alterations finally causing cancer [22]. Toxic side effects were also observed in B6C3F1 mice within 12 months upon treatment with DCA [23]. Administration of 1 or 2 g/l DCA in the drinking water for up to 52 weeks resulted in significant liver lesions in mice. The livers were enlarged with some areas showing necrosis. Beyond, administration of DCA also resulted in glycogen-rich foci. When the treatment was stopped at 37 weeks, the lesions persisted but did not progress to hepatocellular carcinoma [23]. Different pathways might be involved with regard to the toxic effects of DCA. It was suggested that exposure to DCA provides a selective growth advantage to spontaneous occurring CTA mutations in the H-ras codon 61 [24]. While this H-ras activation appeared to be an important feature of the hepatocarcinogenicity upon exposure to DCA, its role might not be crucial for the development of this type of tumor since a significant number of liver neoplasms are without evidence of H-ras activation [24].
The carcinogenicity of DCA might also be linked to its’ decreased elimination rate after repetitive dosing, which was noted in humans [25]. It has been described that DCA both is converted to glyoxylic acid by human glutathione-S-transferase-zeta (GST-zeta), an enzyme that is involved in DCA metabolism in rodents and humans, and inhibits GST-zeta [26,27]. GST-zeta is involved in the isomerization of maleylacetoacetate (MAA) to fumarylacetoacetate (FAA), which then is hydrolysed to fumarate and acetoacetate by fumarylacetoacetate hydrolase (FAH) [28]. FAH deficiency causes type 1 hereditary tyrosinemia (HT1), a disease that is associated with an elevated risk of liver cancer [28]. It has been suggested that this risk might to be due to the accumulation of FAA and MAA or their metabolites [28,29]. Since DCA interacts with GST-zeta, exposure to DCA might hence contribute to an accumulation of MAA or FAA at toxicologically relevant levels, both of which substrates are suspected to increase cancer risk [30].
In conclusion, our results indicate that therapeutic application of DCA should be carefully considered with regard to the treated tumor type and possible adverse effects in vivo. Overall, beneficial effects of DCA in treatment of neuroblastoma seem questionable.
Disclosure of conflict of interest
None to disclose.
References
- 1.Stacpoole PW, Nagaraja NV, Hutson AD. Efficacy of dichloroacetate as a lactate-lowering drug. J Clin Pharmacol. 2003;43:683–691. [PubMed] [Google Scholar]
- 2.Michelakis ED, Webster L, Mackey JR. Dichloroacetate (DCA) as a potential metabolic-targeting therapy for cancer. Br J Cancer. 2008;99:989–994. doi: 10.1038/sj.bjc.6604554. [DOI] [PMC free article] [PubMed] [Google Scholar]
- 3.Pan JG, Mak TW. Metabolic targeting as an anticancer strategy: dawn of a new era? Sci STKE. 2007;2007:pe14. doi: 10.1126/stke.3812007pe14. [DOI] [PubMed] [Google Scholar]
- 4.Stacpoole PW. The pharmacology of dichloroacetate. Metabolism. 1989;38:1124–1144. doi: 10.1016/0026-0495(89)90051-6. [DOI] [PubMed] [Google Scholar]
- 5.Gatenby RA, Gillies RJ. Why do cancers have high aerobic glycolysis? Nat Rev Cancer. 2004;4:891–899. doi: 10.1038/nrc1478. [DOI] [PubMed] [Google Scholar]
- 6.Bonnet S, Archer SL, Allalunis-Turner J, Haromy A, Beaulieu C, Thompson R, Lee CT, Lopaschuk GD, Puttagunta L, Harry G, Hashimoto K, Porter CJ, Andrade MA, Thebaud B, Michelakis ED. A mitochondria-K+ channel axis is suppressed in cancer and its normalization promotes apoptosis and inhibits cancer growth. Cancer Cell. 2007;11:37–51. doi: 10.1016/j.ccr.2006.10.020. [DOI] [PubMed] [Google Scholar]
- 7.Cao W, Yacoub S, Shiverick KT, Namiki K, Sakai Y, Porvasnik S, Urbanek C, Rosser CJ. Dichloroacetate (DCA) sensitizes both wild-type and over expressing Bcl-2 prostate cancer cells in vitro to radiation. Prostate. 2008;68:1223–1231. doi: 10.1002/pros.20788. [DOI] [PubMed] [Google Scholar]
- 8.Wong JY, Huggins GS, Debidda M, Munshi NC, De Vivo I. Dichloroacetate induces apoptosis in endometrial cancer cells. Gynecol Oncol. 2008;109:394–402. doi: 10.1016/j.ygyno.2008.01.038. [DOI] [PMC free article] [PubMed] [Google Scholar]
- 9.Vella S, Conti M, Tasso R, Cancedda R, Pagano A. Dichloroacetate inhibits neuroblastoma growth by specifically acting against malignant undifferentiated cells. Int J Cancer. 2012;130:1484–1493. doi: 10.1002/ijc.26173. [DOI] [PubMed] [Google Scholar]
- 10.Michelakis ED, Sutendra G, Dromparis P, Webster L, Haromy A, Niven E, Maguire C, Gammer TL, Mackey JR, Fulton D, Abdulkarim B, McMurtry MS, Petruk KC. Metabolic modulation of glioblastoma with dichloroacetate. Sci Transl Med. 2010;2:31ra34. doi: 10.1126/scitranslmed.3000677. [DOI] [PubMed] [Google Scholar]
- 11.Isaacs H Jr. Fetal and neonatal neuroblastoma: retrospective review of 271 cases. Fetal Pediatr Pathol. 2007;26:177–184. doi: 10.1080/15513810701696890. [DOI] [PubMed] [Google Scholar]
- 12.Maris JM. Recent advances in neuroblastoma. N Engl J Med. 2010;362:2202–2211. doi: 10.1056/NEJMra0804577. [DOI] [PMC free article] [PubMed] [Google Scholar]
- 13.Niewisch MR, Kuci Z, Wolburg H, Sautter M, Krampen L, Deubzer B, Handgretinger R, Bruchelt G. Influence of dichloroacetate (DCA) on lactate production and oxygen consumption in neuroblastoma cells: is DCA a suitable drug for neuroblastoma therapy? Cell Physiol Biochem. 2012;29:373–380. doi: 10.1159/000338492. [DOI] [PubMed] [Google Scholar]
- 14.Stockwin LH, Yu SX, Borgel S, Hancock C, Wolfe TL, Phillips LR, Hollingshead MG, Newton DL. Sodium dichloroacetate selectively targets cells with defects in the mitochondrial ETC. Int J Cancer. 2010;127:2510–2519. doi: 10.1002/ijc.25499. [DOI] [PubMed] [Google Scholar]
- 15.Kaufmann P, Engelstad K, Wei Y, Jhung S, Sano MC, Shungu DC, Millar WS, Hong X, Gooch CL, Mao X, Pascual JM, Hirano M, Stacpoole PW, DiMauro S, De Vivo DC. Dichloroacetate causes toxic neuropathy in MELAS: a randomized, controlled clinical trial. Neurology. 2006;66:324–330. doi: 10.1212/01.wnl.0000196641.05913.27. [DOI] [PubMed] [Google Scholar]
- 16.Stacpoole PW, Gilbert LR, Neiberger RE, Carney PR, Valenstein E, Theriaque DW, Shuster JJ. Evaluation of long-term treatment of children with congenital lactic acidosis with dichloroacetate. Pediatrics. 2008;121:e1223–1228. doi: 10.1542/peds.2007-2062. [DOI] [PMC free article] [PubMed] [Google Scholar]
- 17.Calcutt NA, Lopez VL, Bautista AD, Mizisin LM, Torres BR, Shroads AL, Mizisin AP, Stacpoole PW. Peripheral neuropathy in rats exposed to dichloroacetate. J Neuropathol Exp Neurol. 2009;68:985–993. doi: 10.1097/NEN.0b013e3181b40217. [DOI] [PMC free article] [PubMed] [Google Scholar]
- 18.Spruijt L, Naviaux RK, McGowan KA, Nyhan WL, Sheean G, Haas RH, Barshop BA. Nerve conduction changes in patients with mitochondrial diseases treated with dichloroacetate. Muscle Nerve. 2001;24:916–924. doi: 10.1002/mus.1089. [DOI] [PubMed] [Google Scholar]
- 19.Stacpoole PW, Henderson GN, Yan Z, Cornett R, James MO. Pharmacokinetics, metabolism and toxicology of dichloroacetate. Drug Metab Rev. 1998;30:499–539. doi: 10.3109/03602539808996323. [DOI] [PubMed] [Google Scholar]
- 20.Zheng MF, Shen SY, Huang WD. DCA increases the antitumor effects of capecitabine in a mouse B16 melanoma allograft and a human non-small cell lung cancer A549 xenograft. Cancer Chemother Pharmacol. 2013;72:1031–1041. doi: 10.1007/s00280-013-2281-z. [DOI] [PubMed] [Google Scholar]
- 21.Taggart DR, Han MM, Quach A, Groshen S, Ye W, Villablanca JG, Jackson HA, Mari Aparici C, Carlson D, Maris J, Hawkins R, Matthay KK. Comparison of iodine-123 metaiodobenzylguanidine (MIBG) scan and [18F] fluorodeoxyglucose positron emission tomography to evaluate response after iodine-131 MIBG therapy for relapsed neuroblastoma. J. Clin. Oncol. 2009;27:5343–5349. doi: 10.1200/JCO.2008.20.5732. [DOI] [PMC free article] [PubMed] [Google Scholar]
- 22.DeAngelo AB, Daniel FB, Stober JA, Olson GR. The carcinogenicity of dichloroacetic acid in the male B6C3F1 mouse. Fundam Appl Toxicol. 1991;16:337–347. doi: 10.1016/0272-0590(91)90118-n. [DOI] [PubMed] [Google Scholar]
- 23.Bull RJ, Sanchez IM, Nelson MA, Larson JL, Lansing AJ. Liver tumor induction in B6C3F1 mice by dichloroacetate and trichloroacetate. Toxicology. 1990;63:341–359. doi: 10.1016/0300-483x(90)90195-m. [DOI] [PubMed] [Google Scholar]
- 24.Anna CH, Maronpot RR, Pereira MA, Foley JF, Malarkey DE, Anderson MW. ras proto-oncogene activation in dichloroacetic acid-, trichloroethylene- and tetrachloroethylene-induced liver tumors in B6C3F1 mice. Carcinogenesis. 1994;15:2255–2261. doi: 10.1093/carcin/15.10.2255. [DOI] [PubMed] [Google Scholar]
- 25.Curry SH, Lorenz A, Chu PI, Limacher M, Stacpoole PW. Disposition and pharmacodynamics of dichloroacetate (DCA) and oxalate following oral DCA doses. Biopharm Drug Dispos. 1991;12:375–390. doi: 10.1002/bdd.2510120507. [DOI] [PubMed] [Google Scholar]
- 26.Tong Z, Board PG, Anders MW. Glutathione transferase zeta catalyses the oxygenation of the carcinogen dichloroacetic acid to glyoxylic acid. Biochem J. 1998;331:371–374. doi: 10.1042/bj3310371. [DOI] [PMC free article] [PubMed] [Google Scholar]
- 27.Tzeng HF, Blackburn AC, Board PG, Anders MW. Polymorphism- and species-dependent inactivation of glutathione transferase zeta by dichloroacetate. Chem Res Toxicol. 2000;13:231–236. doi: 10.1021/tx990175q. [DOI] [PubMed] [Google Scholar]
- 28.Schultz IR, Merdink JL, Gonzalez-Leon A, Bull RJ. Dichloroacetate toxicokinetics and disruption of tyrosine catabolism in B6C3F1 mice: dose-response relationships and age as a modifying factor. Toxicology. 2002;173:229–247. doi: 10.1016/s0300-483x(02)00034-3. [DOI] [PubMed] [Google Scholar]
- 29.Tanguay RM, Jorquera R, Poudrier J, St-Louis M. Tyrosine and its catabolites: from disease to cancer. Acta Biochim Pol. 1996;43:209–216. [PubMed] [Google Scholar]
- 30.Caldwell JC, Keshava N. Key issues in the modes of action and effects of trichloroethylene metabolites for liver and kidney tumorigenesis. Environ Health Perspect. 2006;114:1457–1463. doi: 10.1289/ehp.8692. [DOI] [PMC free article] [PubMed] [Google Scholar]