Abstract
Previous studies have indicated that cytochrome P450 (CYP) metabolites of arachidonic acid (AA), i.e., 20-hydroxyeicosatetraenoic acid (20-HETE) and epoxyeicosatrienoic acids (EETs), play an important role in the regulation of renal tubular and vascular function. The present study for the first time profiled HETEs and epoxygenase derived dihydroxyeicosatetraenoic acid diHETEs levels in spot urines and plasma in 262 African American patients from the University of Mississippi Chronic Kidney Disease Clinic and 31 African American controls. Significant correlations in eGFR and urinary 20-HETE/creatinine and 19-HETE/ creatinine levels were observed. The eGFR increased by 17.47 [p=0.001] and 60.68 [(p=0.005] ml/min/ for each ng/mg increase in 20-HETE and 19-HETE levels, respectively. Similar significant positive associations were found between the other urinary eicosanoids and eGFR and also with 19-HETE/urine creatinine concentration and proteinuria. We found that approximately 80% of plasma HETEs and 30% diHETEs were glucuronidated and the fractional excretion of 20-HETE was less than 1%. These results suggest that there is a significant hepatic source of urinary 20-HETE glucuronide and EETs with extensive renal biotransformation to metabolites which may play a role in the pathogenesis of CKD.
Keywords: eicosanoids, cytochrome P450, chronic kidney disease, biomarkers, HETE, EETs, diHETEs
INTRODUCTION
Chronic kidney disease (CKD) disproportionately affects African Americans who are four times more likely to progress to end-stage renal disease (ESRD) than Caucasians [1, 2]. The mechanisms responsible for this racial health disparity are largely unknown. Studies performed over the past ten years indicate that cytochrome P450 (CYP) metabolites of AA, 20-hydroxyeicosatetraenoic acid (20-HETE) and epoxyeicosatrienoic acids (EETs), play an important role in the regulation of renal tubular function and vascular tone [3, 4], and that abnormalities in these pathways may contribute to the development of hypertension and renal injury [3–6]. 20-HETE is a potent endogenous vasoconstrictor [3] and EETs are endothelial derived relaxing factors [7]. These CYP eicosanoids also regulate inflammation and may affect the progression of CKD [8].
More recent studies suggest that variants in the CYP4A11 and CYP4F2 genes are linked to the development of hypertension in a variety of human population studies [9–25]. However, little is known about the role of 20-HETE or EETs in the pathogenesis of hypertension or diabetic induced renal disease because CYP eicosanoids have not been measured previously in African Americans with chronic kidney disease (CKD). Here we report the correlations of urinary eicosanoids with estimated glomerular filtration (eGFR) and proteinuria in African Americans with CKD.
METHODS
Clinical Protocol
African American patients (N=262) were recruited from the University of Mississippi (UMC) CKD clinic comprising all stages of CKD I–IV with varying etiologies as shown in Table I. Healthy African American subjects (N=31) were also recruited from the Jackson metro area by advertisement at UMMC. The controls were normotensive with normal renal function and taking no medications. An informed consent approved by the UMC IRB was obtained in adherence with the Declaration of Helsinki at the time of their regular clinic visit. A spot urine sample was collected for measurement of urinary eicosanoids, protein, and creatinine concentrations and immediately, refrigerated and then transferred to −70 °C freezer. Blood chemistries including serum creatinine and protein were performed as part of the standard nephrology care and were obtained from the UMC electronic health record. Plasma samples were also obtained for in some CKD II–IV (N=11) and control patients for measurement of eicosanoids (N=24) simultaneous with the urine samples
Table 1.
Participant Characteristics
| Total N=293 |
CKD Stage | ||||||||
|---|---|---|---|---|---|---|---|---|---|
| Healthy N=31 |
I N=27 |
II N=36 |
III N=125 |
IV N=52 |
V N=22 |
p-value | |||
| Demographics | Age | 51.40 (15.23) | 39.39 (9.97) | 36.00 (13.54) | 46.67 (15.18) | 56.19 (13.77) | 56.69 (13.22) | 56.05 (12.25) | <0.001 |
| Male | 106 (36%) | 5 (16%) | 7 (26%) | 17 (47%) | 51 (41%) | 20 (38%) | 5 (23%) | 0.041 | |
| WT (kg) | 95.62 (25.32) | 91.27 (27.32) | 82.32 (17.78) | 90.73 (24.15) | 98.95 (23.76) | 101.26 (27.40) | 91.90 (25.69) | 0.070 | |
| BMI | 34.15 (10.29) | 29.58 (13.53) | 30.02 (6.76) | 31.78 (7.81) | 35.72 (8.50) | 37.11 (11.86) | 34.05 (9.53) | 0.007 | |
| SBP | 137.48 (20.82) | 117.69 (11.00) | 137.93 (25.78) | 130.55 (19.12) | 142.28 (18.23) | 138.77 (19.81) | 152.00 (21.34) | <0.001 | |
| DBP | 75.29 (11.71) | 76.14 (5.53) | 76.43 (9.94) | 72.28 (12.46) | 76.20 (12.34) | 74.62 (11.91) | 75.68 (14.26) | 0.727 | |
| Comorbidities | DM | 127 (43%) | 0 (0%) | 8 (30%) | 15 (42%) | 59 (47%) | 27 (52%) | 17 (77%) | <0.001 |
| Lupus | 26 (9%) | 0 (0%) | 6 (22%) | 7 (19%) | 11 (9%) | 2 (4%) | 0 (0%) | 0.003 | |
| Eicosanoids/Urine Creatinine (ng/mg) | 20-HETE | 0.37 (0.42) | 0.41 (0.56) | 0.63 (0.70) | 0.46 (0.30) | 0.38 (0.43) | 0.22 (0.21) | 0.26 (0.22) | 0.013 |
| 19-HETE | 0.14 (0.43) | 0.31 (1.11) | 0.19 (0.12) | 0.16 (0.14) | 0.11 (0.09) | 0.08 (0.05) | 0.12 (0.09) | 0.265 | |
| 15-HETE | 0.07 (0.23) | 0.18 (0.49) | 0.04 (0.02) | 0.04 (0.03) | 0.05 (0.16) | 0.04 (0.06) | 0.04 (0.03) | 0.092 | |
| 12-HETE | 0.31 (1.08) | 0.87 (2.41) | 0.18 (0.24) | 0.18 (0.38) | 0.16 (0.33) | 0.37 (0.94) | 0.22 (0.70) | 0.059 | |
| 8-HETE | 0.04 (0.09) | 0.12 (0.20) | 0.05 (0.03) | 0.03 (0.02) | 0.03 (0.02) | 0.02 (0.02) | 0.02 (0.02) | 0.488 | |
| 14,15-diHETE | 0.35 (0.81) | 0.79 (1.92) | 0.43 (0.31) | 0.38 (0.29) | 0.29 (0.50) | 0.17 (0.13) | 0.20 (0.27) | 0.025 | |
| 11,12-diHETE | 0.09 (0.20) | 0.22 (0.45) | 0.11 (0.05) | 0.08 (0.03) | 0.06 (0.05) | 0.04 (0.04) | 0.04 (0.04) | 0.001 | |
| 8,9-diHETE | 1.36 (2.13) | 2.93 (4.51) | 3.10 (2.93) | 1.33 (0.70) | 1.05 (0.73) | 0.71 (0.67) | 0.68 (1.74) | <0.001 | |
| 5,6-diHETE | 0.13 (0.27) | 0.33 (0.65) | 0.22 (0.16) | 0.12 (0.07) | 0.11 (0.10) | 0.06 (0.05) | 0.04 (0.04) | <0.001 | |
Participant characteristics table. Mean with standard deviations in parenthesis for continuous variables. Counts with percentages in parenthesis for categorical variables. P-values represent results of ANOVA and Pearson’s chi-square tests for continuous and categorical variables, respectively.
Eicosanoid Profiles
Urinary eicosanoids were measured by LC/MS/MS as described previously [26]. Briefly, urine samples (2 mLs) were thawed and clarified by centrifugation (2500xg for 5 minutes) and pH adjusted to 6.8. 500 units of E. coli-expressed beta-glucuronidase (Sigma Chemical Co., St. Louis MO) in a 0.4M potassium phosphate buffer (pH 6.8) was added and incubated at 37° C for 12–14 hours. Then, an equal volume of 95% sodium acetate (0.1 M, pH 7.0)/5% methanol was added and the pH adjusted to pH 5–6 with 10% acetic acid. A labeled internal standard (2 ng d6-20-HETE) was also added to the samples to determine extraction efficiency. Eicosanoids were extracted using Bond Elute Certify II columns (Agilent Technologies, Wilmington DE). After pre-conditioning the columns with 2 mLs of methanol they were equilibrated with 2 mLs of 95% 0.1M sodium acetate (pH=7):5% methanol and the samples were added to columns via gravity flow. After drying using negative pressure for 3 minutes, columns were washed with 2 ml of 50% methanol in water and then dried using negative pressure for 3 minutes. Eicosanoid metabolites were eluted with 2 ml hexane/ethyl acetate/acetic acid (3:1:0.01). The eluents were dried under nitrogen and stored at −80°C until LC/MS/MS analysis. Prior to LC/MS/MS analysis, the samples were reconstituted in 200 μL acetonitrile, vortexed, and transferred to glass autosampler vials. Following evaporation to dryness under nitrogen gas, samples were reconstituted in 30 μL of acetonitrile and placed in the autosampler at 4° C. Immediately prior to injection onto HPLC, 70 μL of water was added to each sample and 80 μL of sample was injected onto the column.
Blood samples were collected in KEDTA tubes, centrifuged at 1000 g for 15 minutes the plasma collected and stored at −80°C. The eicosanoids were extracted using Bond Elute Certify II columns as described above. One aliquot was assayed directly to measure the free eicosanoid levels. Another aliquot was incubated with glucuronidase and treated identically to the urine samples prior to analysis.
The eicosanoids were measured by LC/MS/MS in Multiple Reaction Monitoring (MRM) mode using an ABSCIEX 4000 QTRAP with a Turbo V Ion Source (ABSCIEX, Inc., Framingham, MA 01701) coupled to a Dionex Ultimate 3000 HPLC (Sunnyvale, CA) as previously described [26]. Quantitation of the metabolites was based on the recovery of the d6-20-HETE internal standard for extraction efficiency. Standard curves were generated over the range of 0.02 to 20 ng/ml of each metabolite and 0.2 ng of d6-20-HETE. Data acquisition, statistical calculations, and quantification utilized Analyst 1.5 software (ABSCIEX). Regression analysis using the least-squares method was used to evaluate the calibration curves of each eicosanoid as a function of its concentration in urine and plasma. The intra- and inter-assay variation was tested and found to be less than 10% for all analytes.
Statistical Methods
Baseline characteristics were constructed using means and standard deviations for continuous variables and counts and percentages for categorical variables. An ANOVA and Pearson’s chi-squared tests were used to detect differences across CKD stage for continuous and categorical variables, respectively. Unadjusted and fully adjusted OLS regression models were used to observe relationships between eGFR and urinary eicosanoids. To account for the high skewness of the distributions, generalized linear models with gamma distributions and log links were used when proteinuria was the primary outcome. R-squared values were calculated to assess the model fit, except for outcomes with gamma distributions, ie the proteinuria associations. The fully adjusted models were adjusted for age, gender, BMI, systolic blood pressure, diastolic blood pressure, diabetes, lupus, and medications. The same model was used to examine the associations where an eicosanoid was the primary outcome. Lowess smoothers were used to assess linear validity. Variations in eicosanoid levels between diabetics and non-diabetics were assessed via interactions, but no statistically significant differences were observed. All analyses were conducted using the Stata v12 analysis package (Stata Corp, College Station, TX).
RESULTS
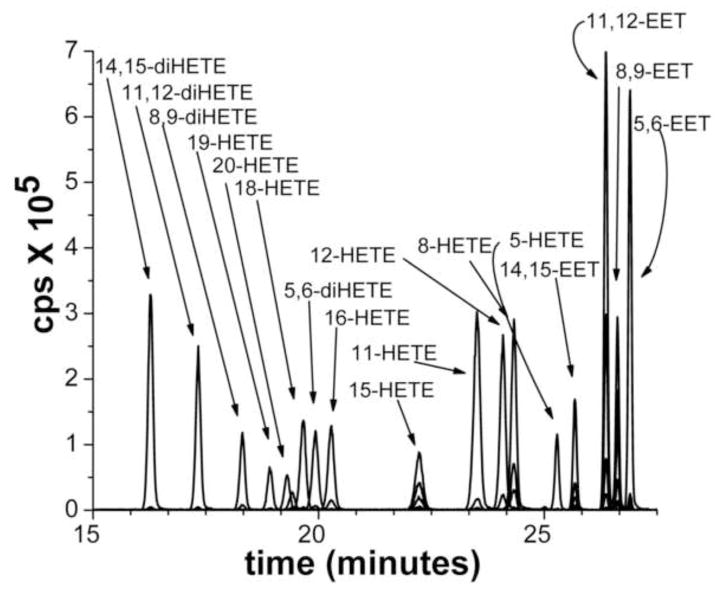
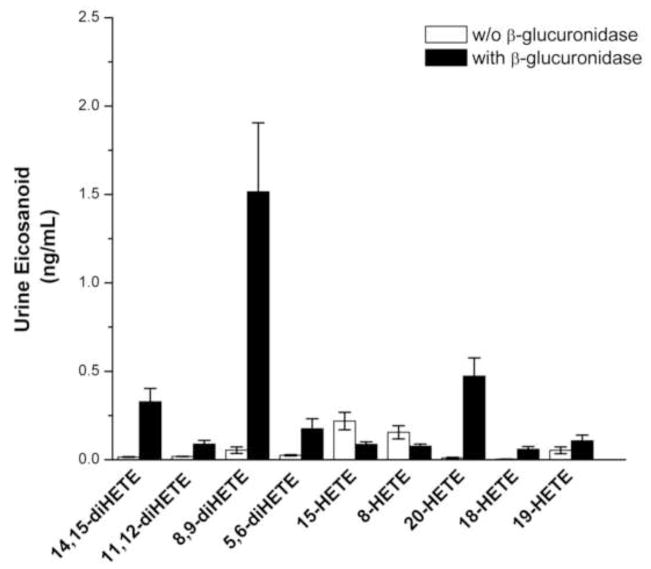
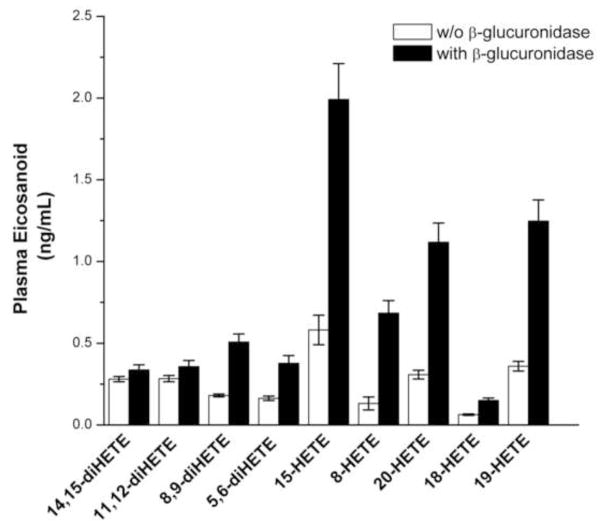
A representative chromatogram illustrating the separation of the various metabolites of AA extracted from standards added to and extracted from a urine sample is presented in Figure 1. Two ng of each of the metabolites were applied to the column. The importance of glucuronidase treatment for the measurement of eicosanoids in both plasma and urine samples is illustrated in Figures 2 and 3. While some free diHETEs can be detected prior to incubation of the urine samples with glucuronidase, all of the HETEs in the samples are in the conjugated form. All of the EETs standards were measurable in spiked urine samples, however, endogenous EETs were undetectable in patient samples most likely due to spontaneous hydrolysis of the epoxides to their corresponding DHETE metabolites in the samples or following extraction and sample processing.
Figure 1.
Representative chromatogram illustrating the LC/MS/MS profile of the major urinary eicosanoids. The sample contained 2 ng of each metabolite of the major CYP450 eicosanoids typically found in urine.
Figure 2.
The effect of β-glucuronidase treatment on the levels of urinary eicosanoids. The results indicate that there is a substantial increase in the levels of the major eicosanoids after treatment of the urine samples. Bar heights represent the means with the error bars reflecting the standard errors (n = 20 matched patient samples).
Figure 3.
The effect of β-glucuronidase treatment on the levels of eicosaoniods in plasma. Treatment with β-glucuronidase increases the levels of HETEs and diHETEs in the plasma samples. Bar heights represent the means with the error bars reflecting the standard errors (n = 20 matched patient samples).
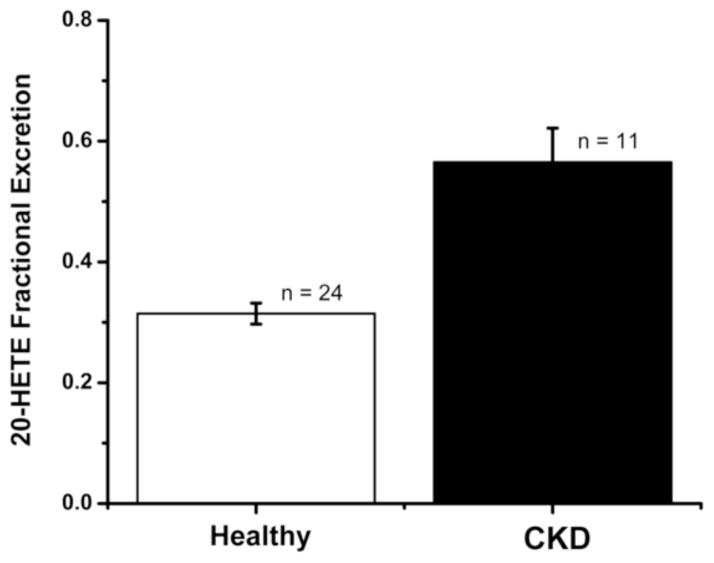
Analysis of the plasma samples revealed that 80% of 20-HETE and other HETES in the plasma are glucuronidated and 10–50% of the diHETEs are as well. The fractional excretion (FE) of these eicosanoids averaged only 1% indicating only a small amount of the filtered load is excreted unchanged as a glucuronide. The results for the FE of 20-HETE in are patient population are presented in Figure 4 and indicate the FE of 20-HETE is significantly greater in patients with CKD II–IV (N = 11) than in the healthy controls (N= 24) (p <0001).
Figure 4.
Fractional excretion of 20-HETE in CKD patients vs. controls. Bar heights represent percentage of the filtered load excreted in Healthy and CKD patients. The error bars represent the 95% confidence intervals.
A comparison of the levels of the various eicosanoids factored for creatinine concentration is presented in Table 1. The concentration of many eicosanoids including 20-HETE in the urine were significantly lower in the African Americans with CKD than in the controls. There was a significant positive correlation of urinary excretion of HETES and diHETEs including 20-HETE and eGFR factored for urinary creatinine concentration and eGFR that remained significant after adjusting for diabetes, hypertension, gender, age, BMI, medications as covariates. Full results for unadjusted and fully adjusted models are shown in Table 2.
Table 2.
Associations between eicosanoid/urine creatinine and eGFR or Urine Protein
| eGFR | Proteinuria† | |||
|---|---|---|---|---|
|
| ||||
| Unadj | Fully Adj* | Unadj | Fully Adj* | |
| 20-HETE | 19.44 p=0.001 (8.26, 30.62) | 17.47 p=0.001 (7.37, 27.57) | 1.23 p=0.307 (0.83, 1.83) | 1.39 p=0.175 (0.86, 2.25) |
| R2 0.05 | R2 0.31 | - | - | |
| 19-HETE | 12.56 p=0.028 (1.37, 23.75) | 60.68 p=0.005 (18.48, 102.88) | 0.98 p=0.960 (0.43, 2.21) | 22.12 p=0.003 (2.80, 175.05) |
| R2 0.02 | R2 0.31 | - | - | |
| 15-HETE | 23.12 p=0.060 (−0.99, 47.22) | 7.97 p=0.710 (−34.34, 50.28) | 0.39 p=0.009 (0.19, 0.79) | 0.09 p=0.016 (0.01, 0.63) |
| R2 0.02 | R2 0.24 | - | - | |
| 12-HETE | 3.40 p=0.141 (−1.14, 7.94) | −5.07 p=0.195 (−12.78, 2.63) | 0.95 p=0.572 (0.78, 1.14) | 1.06 p=0.720 (0.77, 1.45) |
| R2 0.01 | R2 0.27 | - | - | |
| 8-HETE | 119.01 p<0.001 (57.03, 180.99) | 378.89 p=0.001 (160.01, 597.77) | 0.06 p=0.001 (0.01, 0.33) | 0.09 p=0.623 (0.00, 1293.61) |
| R2 0.08 | R2 0.31 | - | - | |
| 14,15-diHETE | 9.00 p=0.002 (3.24, 14.77) | 9.83 p=0.062 (−0.50, 20.17) | 0.81 p=0.029 (0.67, 0.98) | 0.85 p=0.617 (0.45, 1.62) |
| R2 0.04 | R2 0.28 | - | - | |
| 11,12-diHETE | 49.28 p<0.001 (22.27, 76.28) | 183.83 p<0.001 (87.50, 280.16) | 0.34 p=0.003 (0.17, 0.70) | 0.03 p=0.152 (0.00, 3.62) |
| R2 0.07 | R2 0.32 | - | - | |
| 8,9-diHETE | 6.01 p<0.001 (3.96, 8.06) | 8.33 p<0.001 (5.56, 11.10) | 0.90 p<0.001 (0.85, 0.95) | 0.94 p=0.378 (0.81, 1.08) |
| R2 0.13 | R2 0.40 | - | - | |
| 5,6-diHETE | 39.09 p<0.001 (22.08, 56.10) | 112.04 p<0.001 (74.27, 149.81) | 0.46 p<0.001 (0.31, 0.70) | 0.30 p=0.163 (0.05, 1.64) |
| R2 0.09 | R2 0.39 | - | - | |
For eGFR outcomes, beta coefficients (slope) with p-values, 95% confidence intervals, and r values are shown. For proteinuria outcomes, incidence rate ratios (IRR) are reported with p-values and 95% confidence intervals. Unadjusted and fully adjusted models are shown, with fully adjusted models having age, gender, BMI, systolic blood pressure, diastolic blood pressure, diabetes, lupus, and medications from table 3 used as confounders.
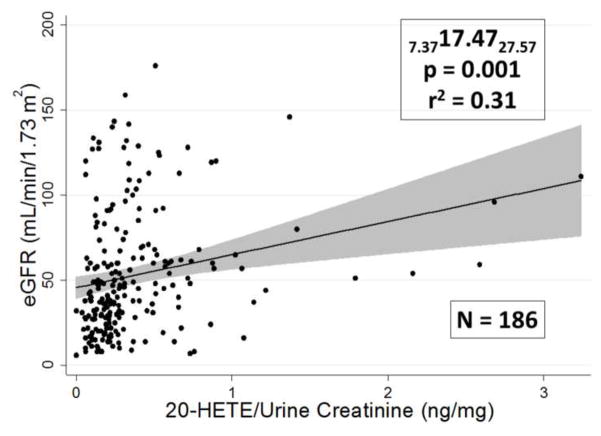
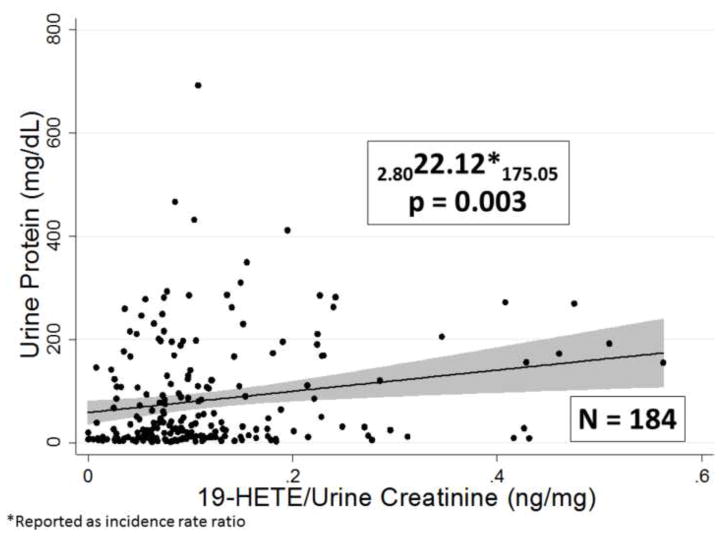
A representative association curve for 20-HETE with eGFR is shown in Figure 5. When the urinary concentrations of eicosanoids were normalized by dividing urinary eicosanoid levels by urine creatinine concentration expressed as ng/mg of creatinine these associations persisted except for the association of 14, 15 DHETE with eGFR as shown in Table 2. The magnitude of the influence of urinary eicosanoid levels on eGFR was relatively profound since the slopes of these relationships indicated that there is a 5–10% decrement in eGFR associated with each ng/mg fall in urinary eicosanoid levels. There is also a significant positive correlation of urinary 19-HETE levels with urine proteinuria as shown in Figure 6 and a significant negative correlation between urinary 15-HETE levels and proteinuria as shown in Table 2.
Figure 5.
Association between the urinary 20-HETE concentration by urine creatinine concentration and eGFR. The upper and lower confidence limits are presented as subscripts along with the incident rate ratio IRR, p-value, r2 value, and sample size.
Figure 6.
Association between the urinary 19-HETE concentration factored by urine creatinine concentration and urine protein concentration. The IRR, upper and lower confidence limits are presented as subscripts along with and sample size.
A number of interactions between urinary eicosanoids levels and drug treatments were also identified (Tables 3a and 3b). Patients treated with beta blockers had lower urinary 19-HETE levels and 5, 6-diHETE than patients not treated with beta-blockers. However, urinary eicosanoid levels were not elevated in patients treated with angiotensin converting enzyme inhibitors (ACEI) p=0.546] or angiotensin receptor blockers (ARB). Patients treated with calcium channel blockers exhibited lower levels 8-HETE and 20-HETE than patients not treated with calcium channel blockers. Diuretics decreased 11,12-diHETE and 5,6-diHETE levels relative to patients not on diuretics. Statins were associated with a significant increase in 20-HETE levels compared with patients not treated with statins.
Table 3a.
Associations between medications and HETEs
| Medication | Eicosanoid
|
||||
|---|---|---|---|---|---|
| 20-HETE | 19-HETE | 15-HETE | 12-HETE | 8-HETE | |
| Beta-blockers | 0.85 p=0.281 (0.64, 1.14) | 0.79 p=0.045 (0.63, 1.00) | 1.08 p=0.798 (0.61, 1.89) | 0.87 p=0.617 (0.50, 1.51) | 1.01 p=0.944 (0.75, 1.36) |
| ACEI | 1.01 p=0.959 (0.76, 1.33) | 1.07 p=0.546 (0.85, 1.35) | 1.16 p=0.557 (0.70, 1.93) | 0.83 p=0.471 (0.50, 1.38) | 1.02 p=0.905 (0.77, 1.35) |
| ARB | 1.41 p=0.056 (0.99, 2.00) | 1.11 p=0.509 (0.82, 1.51) | 0.89 p=0.737 (0.47, 1.72) | 0.99 p=0.966 (0.52, 1.89) | 1.11 p=0.559 (0.78, 1.59) |
| Eplerenone/spironolactone | 1.08 p=0.739 (0.69, 1.70) | 0.92 p=0.650 (0.63, 1.33) | 0.78 p=0.501 (0.38, 1.60) | 1.29 p=0.513 (0.60, 2.76) | 1.00 p=0.981 (0.67, 1.50) |
| Ca channel blocker | 0.74 p=0.033 (0.56, 0.98) | 0.83 p=0.106 (0.66, 1.04) | 1.02 p=0.927 (0.61, 1.73) | 0.70 p=0.197 (0.41, 1.20) | 0.73 p=0.021 (0.55, 0.95) |
| Diuretic | 0.99 p=0.930 (0.72, 1.36) | 1.00 p=0.985 (0.77, 1.30) | 0.72 p=0.299 (0.39, 1.34) | 0.96 p=0.881 (0.52, 1.74) | 0.76 p=0.082 (0.55, 1.04) |
| Statin | 1.37 p=0.031 (1.03, 1.81) | 1.17 p=0.185 (0.93, 1.49) | 0.73 p=0.205 (0.44, 1.19) | 0.68 p=0.144 (0.41, 1.14) | 0.97 p=0.831 (0.72, 1.30) |
| Other immunosuppressive | 1.68 p=0.226 (0.72, 3.91) | 1.20 p=0.561 (0.65, 2.19) | 1.09 p=0.915 (0.24, 4.95) | 0.88 p=0.845 (0.26, 3.02) | 1.04 p=0.929 (0.47, 2.30) |
| Steroids | 1.39 p=0.171 (0.87, 2.24) | 1.17 p=0.430 (0.79, 1.74) | 1.08 p=0.848 (0.48, 2.41) | 1.07 p=0.868 (0.46, 2.51) | 1.18 p=0.463 (0.76, 1.84) |
Table 3b.
Associations between medications and diHETEs
| Medication | Eicosanoid
|
|||
|---|---|---|---|---|
| 14,15-diHETE | 11,12-diHETE | 8,9-diHETE | 5,6-diHETE | |
| Beta-blockers | 0.89 p=0.452 (0.66, 1.20) | 0.86 p=0.323 (0.64, 1.16) | 0.81 p=0.153 (0.60, 1.08) | 0.75 p=0.044 (0.57, 0.99) |
| ACEI | 0.80 p=0.127 (0.61, 1.06) | 0.90 p=0.483 (0.68, 1.20) | 1.03 p=0.842 (0.77, 1.37) | 1.14 p=0.372 (0.86, 1.51) |
| ARB | 1.10 p=0.618 (0.75, 1.62) | 1.08 p=0.690 (0.74, 1.56) | 1.19 p=0.373 (0.81, 1.73) | 1.02 p=0.909 (0.70, 1.49) |
| Eplerenone/spironolactone | 0.90 p=0.674 (0.57, 1.44) | 0.99 p=0.975 (0.65, 1.52) | 0.93 p=0.756 (0.58, 1.49) | 0.85 p=0.489 (0.53, 1.36) |
| Ca channel blocker | 0.75 p=0.072 (0.56, 1.03) | 0.81 p=0.153 (0.60, 1.08) | 0.79 p=0.123 (0.59, 1.06) | 0.76 p=0.059 (0.57, 1.01) |
| Diuretic | 0.77 p=0.143 (0.55, 1.09) | 0.60 p=0.002 (0.43, 0.83) | 0.74 p=0.082 (0.52, 1.04) | 0.67 p=0.021 (0.48, 0.94) |
| Statin | 1.16 p=0.361 (0.85, 1.59) | 1.17 p=0.310 (0.86, 1.60) | 0.89 p=0.482 (0.66, 1.22) | 0.99 p=0.959 (0.73, 1.34) |
| Other immunosuppressive | 1.32 p=0.522 (0.56, 3.08) | 1.36 p=0.506 (0.55, 3.38) | 1.31 p=0.463 (0.64, 2.67) | 1.20 p=0.610 (0.60, 2.38) |
| Steroids | 1.20 p=0.480 (0.73, 1.96) | 1.18 p=0.475 (0.74, 1.88) | 1.59 p=0.051 (1.00, 2.53) | 1.51 p=0.067 (0.97, 2.34) |
Tables 3a and 3B. Associations between medications and eicosanoids. Shown are incidence rate ratios (IRR), p-values, and 95% confidence intervals. All models are adjusted for age, gender, BMI, systolic blood pressure, diastolic blood pressure, diabetes, and lupus.
DISCUSION
The present study is the first large-scale clinical study to profile urinary eicosanoid levels in African Americans with CKD. We found that the concentrations of urinary eicosanoids were reduced in patients with advanced CKD. To date no animal or human study has determined the source of the conjugated glucuronides in the urine even though it has been generally assumed that urinary eicosanoid levels reflect renal production. The present data shows that 70–80% of plasma HETEs are glucuronidated implying a hepatic source for the majority of circulating HETEs. The fractional excretion of 20-HETE is approximately 1% indicating that the nearly all the filtered load is either biotransformed or undergoes extensive reabsorption along the nephron. Glucuronides are also actively secreted in the urine in the brush border membrane of the proximal tubule, however, there is no known mechanism for reuptake of the filtered load of glucuronidated substrates and therefore it is likely that the HETE glucuronides are metabolized. That significant glucuronyl transferase activity has been shown in the kidney supports this argument [28].
These results indicate that the urinary excretion of glucuronidated HETEs and EETs is not an index of renal production and it is possible that there may be a real contribution to urinary eicosanoids, although this cannot be proved without tracer studies. In addition, it is possible that the decrease in conjugated urinary eicosanoid glucuronides in the present study may reflect the fall in GFR and the decrease in the filtration of these metabolites in the patients with more advanced CKD. An alternate explanation is that these metabolites play a pathophysiological role in CKD regardless of their origin. The identity and biological activity of these metabolites and role in the progression of CKD warrants additional investigations.
Previous studies by Ward et al [29] in a number of Caucasian patients in Australia indicated that the urinary 20-HETE glucuronide levels were elevated about 27% in patients with essential hypertension. Interestingly the elevation in 20-HETE levels and hypertension in these patients was linked to a loss of function mutation in CYP4F2 via a mechanism that remains to be determined. An earlier and smaller study by the same author showed that urinary 20-HETE glucuronide levels were elevated in hypertensive women and positively correlated with BMI in males [30]. Laffer et al reported that there was a correlation between urinary 20-HETE glucuronide levels and sodium excretion in salt resistant hypertension but not salt sensitive hypertensive patients with normal kidney function [31]. The urinary 20-HETE levels were 66% higher in salt loaded patients compared to their salt depleted states and it was suggested that urinary 20-HETE is a natriuretic factor aiding in the excretion of the salt load. Also there was a negative correlation of BMI and urinary 20-HETE excretion, in the salt sensitive group. In the present study in an African American population with CKD, we did not find any correlation between urinary eicosanoid levels with BMI or blood pressure and as discussed above any conclusions about the correlations in changes in urinary 20-HETE glucuronide levels and renal production of 20-HETE need to be viewed with caution given the present results suggesting that very little of this compound in the urine is of renal origin. This does not rule out the possibility that these eicosanoids regardless of their origin and their resulting transformed metabolites may play a pathophysiological role in CKD.
Similar positive correlations of eGFR were shown with most the urinary DHETEs measured indicating a possible reduction in activity of epoxygenase pathway with reduced productions of EETs and their corresponding diHETE metabolites. The epoxygenase pathway metabolites have been shown to have anti-inflammatory, antihypertensive and natriuretic properties and their loss may contribute to the progression of CKD. 20-HETE has been shown to activate NF Kappa beta, uncouple eNOS, and increase pro-inflammatory cytokines in the vascular endothelium which may play a role in the progression of CKD. Under these conditions, reduced urinary levels of 20-HETE may have a protective effect [8]. Progression of CKD is mediated by alterations in the inflammatory processes which may be regulated in part by urinary eicosanoids.
There have been no previous clinical studies of the effects of various drug treatments on the renal excretion of eicosanoids in African-American patients with CKD but there has been a recent study by Brown et al [32] showing that fibrates reduce blood pressure in salt sensitive hypertensives with normal renal function. The reduction of plasma and urinary total EETs with fenofibrate on high salt diet was greater in salt resistant than salt sensitive subjects compare to a low salt diet. This salt loading hypertension study showed no changes in urinary or plasma 20-HETE due to salt loading or fenofibrate treatments. There were no significant effects seen in patients treated with ACEI or ARBs in the present study. A previous case control study of plasma eicosanoids in coronary artery disease patients indicated that plasma 20-HETE levels were reduced in patients treated with an ACE inhibitor [33]. Statins were associated with an increase in 20-HETE.
The major limitation of this study is that it is cross-sectional with populations comprising varying etiologies of CKD. We have plans to do a longitudinal study examining the trajectory of eGFR in the individual patients at different time points of early CKD in order to investigate progression of CKD.
CONCLUSIONS
The results of the present study indicate that the urinary excretion of 20-HETE, diHETEs, other HETES are correlated with eGFR in patients with CKD. From our investigations it appears that a large portion of the excreted HETEs are conjugated to glucuronide and likely are filtered and are of hepatic origin. The renal contribution to urinary 20-HETE excretion cannot be determined from this current data. Since the fractional excretion is minimal it is likely that there is extensive biotransformation of filtered eicosanoids along the nephron. These bio-transformed metabolites may have biological activity and may play a role in the progression of CKD. On the other hand, if urinary eicosanoids are derived from filtered metabolites then at the very least, urinary CYP eicosanoids may serve as another potential biomarker for progressive disease.
Highlights.
First study of CYP450 Eicosanoid in African-American patients with chronic kidney disease
Significant correlations with urinary HETE and DHETEs with estimated GFR
Correlations demonstrated with spot urine protein to creatinine for 19-HETE and 15-HETE
CYP Eicosanoids may be play a role in development of chronic kidney disease or as biomarker
Acknowledgments
The authors wish to thank Chris Purser and Rodney Baker who assisted in the analysis of the eicosanoid samples. These studies were funded in part (IRSP). Research reported in this publication was supported in part by grants 1-P20GM104357 and HL-36279 from the National Institutes of Health and a grant from UMMC Intramural Research Program.
Footnotes
No conflict of interests
Disclosures: None
This data has been published as an abstract Winter Eicosanoid Conference March 2014
The content is solely the responsibility of the authors and does not necessarily represent the official views of the National Institutes of Health.
Publisher's Disclaimer: This is a PDF file of an unedited manuscript that has been accepted for publication. As a service to our customers we are providing this early version of the manuscript. The manuscript will undergo copyediting, typesetting, and review of the resulting proof before it is published in its final citable form. Please note that during the production process errors may be discovered which could affect the content, and all legal disclaimers that apply to the journal pertain.
LITERATURE CITED
- 1.Jones CA. Hypertension and renal dysfunction: NHANES III. J Am Soc Nephrol. 2011;14:S71–S75. doi: 10.1097/01.asn.0000070146.29445.d8. 2003 United States Renal Data System. [DOI] [PubMed] [Google Scholar]
- 2.U S Renal Data System. USRDS 2011 Annual Data Report: Atlas of Chronic Kidney Disease and End-Stage Renal Disease in the United States, National Institutes of Health, National Institute of Diabetes and Digestive and Kidney Diseases, Bethesda, MD, 2011. donic acid on pressure natriuresis. Am J Physiol. 2004;287:R58–R68. [Google Scholar]
- 3.Capdevila JH, Flack JR, Harris RC. Cytochrome P450 and arachidonic acid bioactivation: molecular and functional properties of arachidonate mono-oxygenase. J Lipid Res. 2000;41:163–181. [PubMed] [Google Scholar]
- 4.Sarkis A, Lopez B, Roman RJ. Role of 20-hydroxyeicosatetraenoic acid and epoxyeicos-atrienoic acids in hypertension. Curr Opin Nephrol Hypertens. 2004;13:205–214. doi: 10.1097/00041552-200403000-00009. [DOI] [PubMed] [Google Scholar]
- 5.Wu CC, Gupta T, Garcia V, Ding Y, Schwartzman ML. 20-HETE and blood pressure regulation: clinical implications. Cardio Rev. 2013 Apr 11; doi: 10.1097/CRD.0b013e3182961659. (epub) [DOI] [PMC free article] [PubMed] [Google Scholar]
- 6.Eid S, Maalouf R, Jaffa A, et al. 20-HETE and EETs in diabetic nephropathy: a novel mechanistic pathway. PLos ONE. 2013;8:e7029. doi: 10.1371/journal.pone.0070029. [DOI] [PMC free article] [PubMed] [Google Scholar]
- 7.Quilley J, McGiff JC. Is EDHF an epoxyeicosatrienoic acid? Trends Pharmacol Sci. 2000;21:121–124. doi: 10.1016/s0165-6147(00)01445-0. [DOI] [PubMed] [Google Scholar]
- 8.Cheng J, Wu C-C, Gotlinger KH, et al. 20-Hydroxy-5,8,11,14-eicosatetrenoic acid mediates endothelial dysfunction via IkB Kinase-dependent endothelial nitric-oxide synthase uncoupling. J Pharmacol Exp Ther. 2010;322:57–65. doi: 10.1124/jpet.109.159863. [DOI] [PMC free article] [PubMed] [Google Scholar]
- 9.Gainer JV, Bellamine A, Dawson EP, et al. Functional variant of CYP4A11 20-hydroxyeicosatetraenoic acid synthase is associated with essential hypertension. Circulation. 2005;111:63–9. doi: 10.1161/01.CIR.0000151309.82473.59. [DOI] [PubMed] [Google Scholar]
- 10.Mayer B, Lieb W, Götz A, et al. Association of the T8590C polymorphism of CYP4A11 with hypertension in the MONICA Augsburg echocardiographic substudy. Hypertension. 2005;46:766–71. doi: 10.1161/01.HYP.0000182658.04299.15. [DOI] [PubMed] [Google Scholar]
- 11.Mayer B, Lieb W, Götz A, et al. Association of a functional polymorphism in the CYP4A11 gene with systolic blood pressure in survivors of myocardial infarction. J Hypertens. 2006;24:1965–70. doi: 10.1097/01.hjh.0000244944.34546.8e. [DOI] [PubMed] [Google Scholar]
- 12.Elijovich F, Laffer CL. The relationship between CYP4A11 and human hypertension. J Hypertens. 2008;26:1712–4. doi: 10.1097/HJH.0b013e3283000504. [DOI] [PubMed] [Google Scholar]
- 13.Fu Z, Nakayama T, Sato N, et al. Haplotype-based case study of human CYP4A11 gene and cerebral infarction in Japanese subject. Endocrine. 2008;33:215–22. doi: 10.1007/s12020-008-9078-6. [DOI] [PubMed] [Google Scholar]
- 14.Gainer JV, Lipkowitz MS, Yu C, et al. AASK Study Group: Association of a CYP4A11 variant and blood pressure in black men. J Am Soc Nephrol. 2008;9:1606–12. doi: 10.1681/ASN.2008010063. [DOI] [PMC free article] [PubMed] [Google Scholar]
- 15.Fu Z, Nakayama T, Sato N, et al. A haplotype of the CYP4A11 gene associated with essential hypertension in Japanese men. J Hypertens. 2008;26:453–61. doi: 10.1097/HJH.0b013e3282f2f10c. [DOI] [PubMed] [Google Scholar]
- 16.Laffer CL, Gainer JV, Waterman MR, et al. The T8590C polymorphism of CYP4A11 and 20-hydroxyeicosatetraenoic acid in essential hypertension. Hypertension. 2008;51:767–72. doi: 10.1161/HYPERTENSIONAHA.107.102921. [DOI] [PMC free article] [PubMed] [Google Scholar]
- 17.Ward NC, Tsai IJ, Barden A, et al. A single nucleotide polymorphism in the CYP4F2 but not CYP4A11 gene is associated with increased 20-HETE excretion and blood pressure. Hypertension. 2008;51:1393–1398. doi: 10.1161/HYPERTENSIONAHA.107.104463. [DOI] [PubMed] [Google Scholar]
- 18.Liu H, Zhao Y, Nie D, et al. Association of a functional cytochrome P4504F2 haplotype with urinary 20-HETE and hypertension. J Am Soc Nephrol. 2008;19:714–721. doi: 10.1681/ASN.2007060713. [DOI] [PMC free article] [PubMed] [Google Scholar]
- 19.Stec DE, Roman RJ, Flasch A, Rieder MJ. Functional polymorphism in human CYP4F2 decreases 20-HETE production. Physiol Genomics. 2007;30:74–81. doi: 10.1152/physiolgenomics.00003.2007. [DOI] [PubMed] [Google Scholar]
- 20.Fava C, Montagnana M, Almgren P, et al. The V433M variant of the CYP4F2 is associated with ischemic stroke in male Swedes beyond its effect on blood pressure. Hypertension. 2008;52:373–380. doi: 10.1161/HYPERTENSIONAHA.108.114199. [DOI] [PubMed] [Google Scholar]
- 21.Ding H, Cui G, Zhang L, et al. Association of common variants of CYP4A11 and CYP4F2 with stroke in the Han Chinese population. Pharmacogenet Genomics. 2010;20:187–194. doi: 10.1097/FPC.0b013e328336eefe. [DOI] [PMC free article] [PubMed] [Google Scholar]
- 22.Fu Z, Nakayama T, Sato N, et al. A haplotype of the CYP4F2 gene is associated with cerebral infarction in Japanese men. Am J Hypertens. 2008;21:1216–1223. doi: 10.1038/ajh.2008.276. [DOI] [PubMed] [Google Scholar]
- 23.Liu H, Zhao YY, Gong W, et al. Correlation analysis and Identification of G421C in regulatory region of CYP4F2 gene with essential hypertension. Zhongguo Yi Xue Ke Xue Yuan Xue Bao. 2006;28:143–147. [PubMed] [Google Scholar]
- 24.Fu Z, Nakayama T, Sato N, et al. Haplotype-based case-control study of the human CYP4F2 gene and essential hypertension in Japanese subjects. Hypertens Res. 2008;231:1719–1726. doi: 10.1291/hypres.31.1719. [DOI] [PubMed] [Google Scholar]
- 25.Fidelis P, Wilson L, Thomas K, Villalobos M, Oyekan AO. Renal function and vasomotor activity in mice lacking the Cyp4a14 gene. Exp Biol Med. 2010;235:365–1374. doi: 10.1258/ebm.2010.009233. [DOI] [PubMed] [Google Scholar]
- 26.Orozco LD, Liu H, Perkins E, et al. 20-Hydroxyeicosatetraenoic acid inhibition attenuates balloon injury-induced neointima formation and vascular remodeling in rat carotid arteries. J Pharmacol Exp Ther. 2013;346(1):67–74. doi: 10.1124/jpet.113.203844. [DOI] [PMC free article] [PubMed] [Google Scholar]
- 27.Dreisbach AW. Influence of Chronic Renal Failure on Drug Metabolism and Transport. Clin Pharmacol Ther. 2009;86(5):553–556. doi: 10.1038/clpt.2009.163. [DOI] [PubMed] [Google Scholar]
- 28.McGurk KA, Brierley CH, Burchell B. Drug glucuronidation by human renal UDP-glucuronyl transferases. Biochem Pharmacol. 1998;55:1005–1012. doi: 10.1016/s0006-2952(97)00534-0. [DOI] [PubMed] [Google Scholar]
- 29.Ward NC, Tsai I-J, Barden A, et al. A single nucleotide polymorphism in the CYP4F2 but not CYP4A11 gene is associated with increased 20-HETE excretion and blood pressure. Hypertension. 2008;51:1393–1398. doi: 10.1161/HYPERTENSIONAHA.107.104463. [DOI] [PubMed] [Google Scholar]
- 30.Ward NC, Rivera J, Hodgson J, et al. Urinary 20-Hydroxyeicosatetraenoic acid is associated with endothelial dysfunction n humans. Circulation. 2004;110:438–443. doi: 10.1161/01.CIR.0000136808.72912.D9. [DOI] [PubMed] [Google Scholar]
- 31.Laffer CL, Lanido-Schwartzman M, Wang M-H, Nasjletti A, Elijovich F. Differential Regulation of Natriuresis by 20-hydroxyeicosatetreanoic acid in human salt-sensitive versus salt-resistant hypertension. Circulation. 2003;107:574–578. doi: 10.1161/01.cir.0000046269.52392.14. [DOI] [PubMed] [Google Scholar]
- 32.Gilbert K, Nian H, Yu C, Luther JM, Brown NJ. Fenofibrate lowers blood pressure in salt-sensitive but not salt-resistant hypertension. J Hypertens. 2013;31(4):820–829. doi: 10.1097/HJH.0b013e32835e8227. [DOI] [PMC free article] [PubMed] [Google Scholar]
- 33.Theken KN, Shuck RN, Edin ML, et al. Evaluation of cytochrome P450-derived eicosanoids in humans with stable atherosclerotic disease. Atherosclerosis. 2012;222:530–536. doi: 10.1016/j.atherosclerosis.2012.03.022. [DOI] [PMC free article] [PubMed] [Google Scholar]


