

Abstract
MicroRNAs (miRNAs) are associated with human carcinogenesis and tumor development. Moreover, serum miRNAs can reflect the level of tissue miRNAs and be potential tumor markers. Serum microRNA-21 (miR-21) is overexpressed in many human cancers including hepatocellular carcinoma (HCC). However, how serum miR-21 changes during the HCC formation and whether miR-21 plays a regulatory role in this whole process are unknown. The current study evaluated the prognostic and diagnostic potential of serum miR-21 in HCC patients. Next, we established a HCC rat model and collected the blood and liver tissues at regular time points. AFP from the serum, RNA from the serum and liver tissues were collected and quantified separately. The results revealed that tissue and serum miR-21 was upregulated significantly in the groups of cirrhosis, early and advanced HCC compared with normal and fibrosis groups. The AFP levels were increased in early and advanced HCC compared with other groups. Then, the changes of miR-21 downstream proteins (i.e., programmed cell death 4 [PDCD4] and phosphatase and tensin homolog [PTEN]) in the liver tissues were measured. PDCD4 and PTEN expression was decreased gradually after tumor induction and negatively correlated with miR-21 expression. All these results suggested that serum miR-21 was associated with the prognosis of HCC; the changes in serum miR-21 were earlier and more accurately reflected the pathogenesis of HCC than AFP; therefore, it could be used as an early diagnostic marker for HCC. Our in vivo experiments further confirmed that miR-21 plays an important role in promoting the occurrence and development of HCC by regulating PDCD4 and PTEN.
Keywords: Hepatocellular carcinoma, microRNA, microRNA-21, serum, biomarker, diagnosis and prognosis
Introduction
Hepatocellular carcinoma (HCC) is one of the most severe gastrointestinal cancers in humans, and has the second highest mortality rate among malignant tumors in China [1]. Because of the rapid carcinogenesis and initially asymptomatic development of HCC, most patients have a limited number of therapeutic options at the time of diagnosis [2,3]. Therefore, studies on early diagnostic strategies and the treatment of HCC have been the focus of major research efforts in the field. Alpha-fetoprotein (AFP) is a commonly used tumor marker for the early screening of primary HCC. However, not all patients with primary HCC have elevated AFP levels: ~30% HCC patients have normal AFP levels, and its false-positive rate can reach ~40%.
In recent years, serum microRNAs (miRNAs) have received increasing attention from medical workers. miRNAs are a class of endogenous non-coding small RNA molecules sized ~19-25 nucleotides that regulate gene expression by interacting with the 3’ non-translated regions of mRNA [4]. They play an important role in cell growth, proliferation, and apoptosis [5-7].
miRNAs are potential diagnostic markers for cancer [8]. To date, studies have reported the detection of miRNAs in many tumor tissues. In addition, circulating miRNAs are potential markers for the diagnosis and prognosis of many diseases [9-12]. Many scientists believe that tumor-derived miRNAs levels are stable in the blood and protected from endogenous RNA enzymes activity [13]. However, it is unclear whether the circulating form of miRNAs accurately reflects miRNAs levels in tumor tissues. No systematic study has quantified circulating miRNAs during the occurrence and development of HCC. Monitoring the variations in circulating miRNA levels is believed to be very important, and is the most direct and easiest method for disease diagnosis. Therefore, studying the correlation between the variations in circulating miRNAs during disease progression could greatly improve the accuracy of early diagnosis.
This current study focused on miR-21, which is located on the FRA17B brittle zone of chromosome 17q23.2. It is a miRNA with independent transcription units. A previous histopathological study demonstrated that miR-21 plays a role in the occurrence and development of many malignant tumors [14-17]. The abnormal expression of serum miR-21 has been confirmed in many malignant tumors including glioma, ovarian cancer, gastric cancer, and pancreatic cancer [18-21]. Based on clinical data, the current study established an HCC rat model to monitor miR-21 expression and determine whether miR-21 could be used as a serum marker for the early diagnosis of HCC.
Materials and methods
Patients
Serum was collected from 97 patients suffering from primary hepatocellular carcinoma between 2005 and 2008. All subjects were admitted to and received surgical resection in the Department of Hepatobiliary Surgery, Xijing Hospital, the Fourth Military Medical University Hospital, Xian, China. The patients did not receive treatment using any drug, hepatic artery embolization, or percutaneous ethanol injection prior to surgical resection to exclude patients with other cancers or with accompanying serious infections. The study enrolled 66 males and 31 females; the clinical and pathological data of the patients are listed in Table 1. Thirty healthy volunteers matched for age and gender were selected from Xijing Hospital, and serum was collected. Tumor markers, such as CEA, CA199, PSA (for males), and CA153 (for females), were within the normal range in all volunteers, who had no medical history of cancer (Table 1). The Ethics Committee of Fourth Military Medical University approved the study protocol. All participants were fully informed the details of research study, and the participants or legal guardians of the participants signed written informed consent before inclusion in the study.
Table 1.
Basic clinicopathological characteristics of hepatocellular carcinoma patients (HCC) and healthy volunteers (H)
| HCC patients (n = 97) | Healthy volunteers (n = 30) | P-values (HCC vs. H) | |
|---|---|---|---|
| Gender (Female/Male) | 66/31 | 19/11 | 0.632 |
| Age (years) | 50 ± 10 | 53 ± 9 | 0.139 |
| Hepatitis B (-/+) | 37/60 | ||
| Liver cirrhosis (Absence/Presence) | 66/31 | ||
| AFP (ng/ml) | 1566 ± 6091 | 4 ± 2 | 0.164 |
| Tumor number (Single/Multiple) | 65/32 | ||
| Tumor size (≤ 5 cm/> 5 cm) | 47/50 | ||
| Venous invasion (-/+) | 79/18 | ||
| Metastasis (-/+) | 71/26 | ||
| AJCC staging (I/II/III, IV) | 16/17/64 |
Establishment of an HCC model using diethylnitrosamine (DENA) induction
Eighty male F344 rats (Grade SPF, Super-B&K Laboratory Animal Corp., Ltd., Shanghai, China) were divided randomly into the experimental (n = 60) and control (n = 20) groups. The experimental group received 30-mg/kg diethylnitrosamine (DENA, Sigma, NY, USA) by intraperitoneal (i.p.) injection once every 3 days for 12 weeks. The control group received a saline i.p. injection once every 3 days for 12 weeks. After cancer had been induced, 10 animals were selected randomly from the experimental group on weeks 8, 10, 12, 14, and 16, whereas three animals were selected randomly from the control group on weeks 0, 8, 10, 12, 14, and 16. The selected animals were anesthetized using sodium pentobarbital. Next, an abdominal median incision was performed following the skin preparation and disinfection. Approximately 4-5 ml of blood was collected from the abdominal aorta of each animal. The liver was resected from each animal and placed in DEPC water in an RNase-free glass dish. A portion of the liver tissue was dissected and placed in an RNase-free Eppendorf PCR tube, and was then cryopreserved in liquid nitrogen. The remaining liver tissue from each animal was fixed in 10% formalin solution for tissue embedding in paraffin blocks and tissue sectioning. Tissue sections were stained with hematoxylin and eosin (H&E) and were then observed under a light microscope. Blood samples were placed at room temperature for 30 min, and centrifuged at 1,500 rpm at 4°C for 15 min. The serum was then transferred to a new 1.5 ml Eppendorf PCR tube, and stored at -80°C until use.
RNA extraction
Serum RNA was isolated from the prepared serum samples using a miRNeasy Serum/Plasma Kit (Qiagen, Hilden, Germany) according to the manufacturer’s instructions. Total RNA, including miRNAs, was isolated from the prepared rat liver samples using TRIzol reagent (Invitrogen, CA, USA) following the manufacturer’s instructions. The concentration of RNA was determined by measuring the absorbance at 260 nm (A260) in an Ultrospec 1100 spectrophotometer (GE Healthcare, NJ, USA).
Quantitative RT-PCR
For microRNA analysis, reverse transcription (RT) and real-time quantitative RT-polymerase chain (qRT-PCR) were performed using a miRNeasy Serum/Plasma Kit (Qiagen) according to the instructions supplied by the manufacturer. Ce_miR-39_1 was used as the internal control standard as recommended by the serum miR-21 detection kit. The expression of tissue miR-21 was analyzed according to the manufacturer’s instructions provided with the miScript PCR System (Qiagen; miScript reverse transcription kit, miScript primers, and miScript SYBR® Green PCR kit). The human and rat miR-21 primers were purchased from Qiagen (catalog numbers MS00009079 [Hs-miR-21-5p] and MS00013216 [Rn-miR-21-5p]). Small nuclear RNA U6 was used for normalization.
For mRNA analysis, complementary DNA (cDNA) was generated with oligo-dT primers using the Primescript RT reagent Kit (TaKaRa, Dalian, China). Amplification of the generated cDNA was performed using SYBR Premix EX Taq II (TaKaRa) on IQ5 Detection System. The human housekeeping gene GAPDH was used as an internal control to normalize mRNA expression levels of target genes. All of the above experiments were performed according to the manufacturer’s instructions. Real-time PCR was performed using an IQ5 real-time PCR detection system (Bio-Rad, CA, USA). The relative expression of each miRNA was calculated using the comparative cycle threshold (CT) method (2-ΔΔCT). The primers used in the PCR reaction are as follows: PDCD4, forward primer (5’-AGTGACGCCCTTAGAAGTGG-3’) and reverse primer (5’-TCATATCCACCTCCTCCACA-3’); PTEN, forward primer (5’-GCGTGCAGATAATGACAAGG-3’) and reverse primer (5’-GGATTTGACGGCTCCTCTAC-3’); GAPDH, forward primer (5’-CAAGGTCATCCATGACAACTTTG-3’) and reverse primer (5’-GTCCACCACCCTGTTGCTGTAG-3’). The primers were designed and synthesized by Sangon Biotech, Co., Ltd (Shanghai, China).
Enzyme-linked immunosorbent assay (ELISA)
Serum AFP levels were measured by ELISA kits (Lengton Biological Technology Co., Ltd., Shanghai, China) according to the manufacturer’s instructions. Briefly, monoclonal antibody specific for AFP was precoated onto the microplates. Then 50 μl samples were loaded onto the plates and incubated at 37°C for 45 min. Subsequent to being washed four times with washing buffer, 50 μl/well anti-IgG conjugated with biotin was added and incubated at 37°C for 30 min. The plates were washed again, streptavidin-HRP solution was added and incubated at 37°C for another 30 min. Color developing agents A and B (50 μl/well) were added in sequence and incubated in the dark for 15 min. The reaction was terminated with stop buffer. Absorbance was measured at 450 nm on a microplate reader. The normal range of AFP recommended in manufacturer’s instructions is 0-2.85 ng/ml.
Immunohistochemistry and evaluation of staining
Formaldehyde-fixed and paraffin-embedded sections of liver tissue were subjected to immunohistochemistry and stained with antibodies against PDCD4 or PTEN using the avidin-biotin-peroxidase complex method. All sections were deparaffinized in xylene and dehydrated through a graduated alcohol series before endogenous peroxidase activity was blocked with 0.5% H2O2 in methanol for 10 min. Nonspecific binding was blocked by incubating sections with 10% normal goat serum in PBS for 1 h at room temperature. The sections were incubated with anti-PDCD4 (1:100, #9535) or anti-PTEN (1:200, #9559, both from Cell Signaling Technology, Boston, USA) in PBS at 4°C overnight in a moist box. The sections were incubated with biotinylated IgG for 2 h at room temperature and detected with a streptavidin-peroxidase complex. The brown color indicative of peroxidase activity was obtained by incubating the section with 0.1% 3,3-diaminobenzidine (DAB) in PBS with 0.03% H2O2 for 10 min at room temperature. PDCD4 and PTEN expression in tissues were evaluated by scanning the entire specimen under low magnification (× 100) and then confirmed under high magnification (× 400). Positive intensity of each slice was calculated through following standard: 100 tumor cells were counted and the ratio of positive cells was calculated. The tissue specimens were scored independently by two pathologists using an immunoreactivity score system described previously [22].
Protein extraction and Western blotting
One hundred milligrams of tissue was collected from each group and ground in liquid nitrogen using a mortar and pestle. The crushed powder was transferred to a new Eppendorf PCR tube, mixed with 1 ml lysis buffer (P0013B, Beyotime, Shanghai, China) containing 1 mmol/1 PMSF, and incubated on ice for 20 min. Tissue lysates from all groups were then centrifuged at 12,000 rpm at 4°C for 20 min; the supernatants were then collected for later use. The protein concentrations were determined using the Bio-Rad assay system (Bio-Rad). Total proteins were concentrated and separated using 8% SDS-PAGE and transferred to nitrocellulose membranes. The membranes were blocked with 5% nonfat dried milk in 1 × TBST, and were then incubated with primary antibodies against PTEN and PDCD4. Horseradish peroxidase (HRP)-conjugated anti-rabbit IgG (Zhongshan Goldenbridge, Ltd., Beijing, China) was used as the secondary antibody, and the protein bands were visualized using the ChemiDoc™ XRS+ system with Image Lab™ software (Bio-Rad). The Western blots were quantified using laser densitometry, and the relative protein expression was normalized to β-actin (#4970, Cell Signaling Technology).
Statistical analysis
HCC staging was determined according to the AJCC TNM staging system (seventh edition). Statistical analyses were performed using SPSS Statistics version 17.0 software (IBM, USA). All Figures were generated using GraphPad Prism 5.01 (GraphPad software, USA). All experiments were repeated at least three times, and the data are summarized and presented as means ± SDs. The differences between means were analyzed statistically using t-tests. The differences between serum miR-21 expression and various clinicopathological factors were assessed using χ2 tests or Fisher’s exact tests. Survival curves were calculated using the Kaplan-Meier method and compared using log-rank tests. Cox’s proportional hazard analysis was used for univariate and multivariate analyses to assess the effect of clinicopathological factors and serum miR-21 levels on survival. A P value < 0.05 denoted the presence of a statistically significant difference.
Results
Upregulated expression of serum miR-21 in HCC patients
To assess the relationship between serum miR-21 and HCC, we analyzed serum miR-21 levels in 97 HCC patients and 30 healthy volunteers. Serum RNA was isolated and qPR-PCR revealed that serum miR-21 levels were significantly higher in HCC patients than in healthy volunteers (P < 0.001) (Figure 1).
Figure 1.
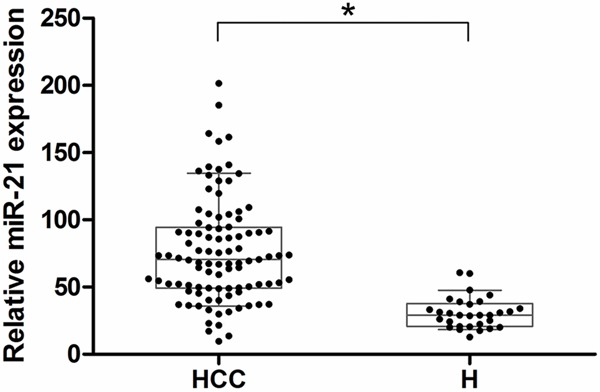
The relative expression of serum miRNA-21. Serum miRNA-21 levels (2-ΔΔCT) in HCC patients (n = 97) and Healthy volunteers (n = 30) measured by qRT-PCR (*P < 0.05). In the box-and-whisker plot, the lines within the boxes represent median values; the upper and lower lines of the boxes represent the 25th and 75th percentiles, respectively; and the upper and lower bars outside the boxes represent the 10th and 90th percentiles, respectively.
Relationship between serum miR-21 expression and clinicopathological characteristics
To determine the relationship between serum miR-21 levels and the clinical data of HCC patients, 97 HCC patients were separated into high miR-21 expression (n = 49) and low miR-21 expression (n = 48) groups according to the median relative miR-21 expression (the 50th percentile). Their clinicopathological factors, including gender, age, the incidence of liver cirrhosis, the incidence of hepatitis B infection, tumor size, tumor number, degree of differentiation, the incidence of portal or hepatic venous invasion, metastasis, and AJCC cancer stage were then summarized and compared (Table 2). Data revealed that serum miR-21 levels were significantly associated with tumor differentiation (P = 0.011), the incidence of portal or hepatic venous invasion (P = 0.041), metastasis (P = 0.026), and AJCC cancer stage (P = 0.015). This suggests that serum miR-21 might be associated with HCC differentiation, invasion, and metastasis.
Table 2.
Association of serum miR-21 expression with clinicopathological factors of 97 HCC patients
| Characteristics | n | Serum miR-21 level | P-values | χ2 | |
|---|---|---|---|---|---|
|
| |||||
| High | Low | ||||
| All case | 97 | 49 (50.5%) | 48 (49.5%) | ||
| Gender | |||||
| Male | 66 | 36 (54.5%) | 30 (45.5%) | 0.247 | 1.342 |
| Female | 31 | 13 (41.9%) | 18 (58.1%) | ||
| Age | |||||
| ≥ 50 | 53 | 29 (54.7%) | 24 (45.3%) | 0.364 | 0.825 |
| < 50 | 44 | 20 (45.5%) | 24 (54.5%) | ||
| Liver cirrhosis | |||||
| Presence | 31 | 18 (58.1%) | 13 (41.9%) | 0.308 | 1.039 |
| Absence | 66 | 31 (47.0%) | 35 (53.0%) | ||
| AFP | |||||
| ≥ 400 | 62 | 30 (48.4%) | 32 (51.6%) | 0.577 | 0.311 |
| < 400 | 35 | 19 (54.3%) | 16 (45.7%) | ||
| Hepatitis B | |||||
| Positive (+) | 60 | 35 (58.3%) | 25 (41.7%) | 0.050 | 3.846 |
| Negative (-) | 37 | 14 (37.8%) | 23 (62.2%) | ||
| Tumor size (cm) | |||||
| > 5 | 47 | 26 (55.3%) | 21 (44.7%) | 0.359 | 0.842 |
| ≤ 5 | 50 | 23 (46.0%) | 27 (54.0%) | ||
| Tumor number | |||||
| Single | 65 | 30 (46.2%) | 35 (53.8%) | 0.221 | 1.499 |
| Multiple | 32 | 19 (59.4%) | 13 (40.6%) | ||
| Differentiation | |||||
| High | 46 | 17 (37.0%) | 29 (63.0%) | 0.011* | 6.435 |
| Low | 51 | 32 (62.7%) | 19 (37.3%) | ||
| Venous invasion | |||||
| Yes | 18 | 13 (72.2%) | 5 (27.8%) | 0.041* | 4.166 |
| No | 79 | 36 (45.6%) | 43 (54.4%) | ||
| Metastasis | |||||
| Yes | 26 | 18 (69.2%) | 8 (30.8%) | 0.026* | 4.977 |
| No | 71 | 31 (43.7%) | 40 (56.3%) | ||
| AJCC staging | |||||
| I + II | 33 | 11 (33.3%) | 22 (66.7%) | 0.015* | 5.907 |
| III + IV | 64 | 38 (59.4%) | 26 (40.6%) | ||
Statistically significant difference.
Correlation between serum miR-21 expression and HCC patient prognosis
Because of the association between serum miR-21 expression and tumor differentiation, portal or hepatic venous invasion, metastasis, and tumor staging, we next used Kaplan-Meier survival analysis to compare the postoperative survival curves of the two groups of HCC patients. The log-rank test demonstrated a significant difference in the postoperative survival between HCC patients with high and low levels of serum miR-21 expression (P < 0.0001) (Figure 2). Patients with high serum miR-21 levels had a significantly decreased postoperative survival time. Patients with low serum miR-21 levels had a 29.2% 5-year survival rate; whereas those with high expression had a 14.3% 5-year survival rate.
Figure 2.
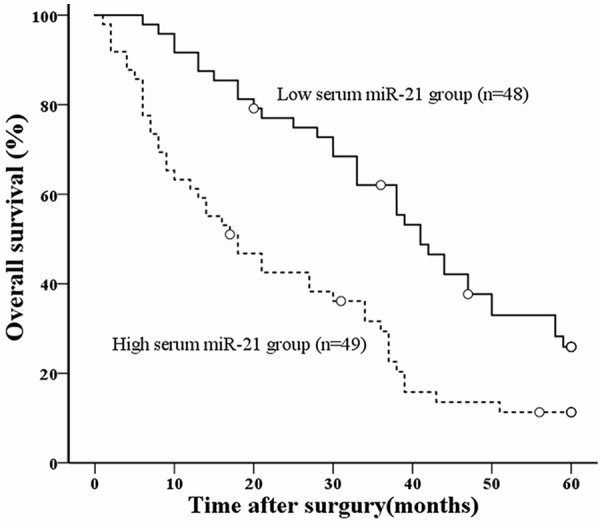
Postoperative survival for HCC according to serum miR-21 expression levels. Patients with low serum miR-21 expression (n = 48, solid line) tended to have a longer time-to-live compared to those with high serum miR-21 expression (n = 49, dotted line) (open circles; censored) (*P < 0.001).
To assess the prognostic value of serum miR-21 we first performed univariate analysis, which revealed that tumor size (P = 0.040), the degree of differentiation (P < 0.001), venous invasion (P < 0.001), metastasis (P < 0.001), AJCC staging (P < 0.001), and serum miR-21 expression (P = 0.001) were significantly associated with overall survival of HCC patients (Table 3). A subsequent multivariate analysis demonstrated that serum miR-21 expression (P = 0.002), the degree of differentiation (P = 0.015), venous invasion (P = 0.007), metastasis (P = 0.002), and AJCC cancer staging (P = 0.024) were independent factors for the prediction of the overall survival of HCC patients (Table 3).
Table 3.
Univariate and multivariate Cox regression analyses of overall survival in 97 patients with HCC
| Tumor characteristic | RR (95% CI) | P-value | Wald |
|---|---|---|---|
| Univariate | |||
| Gender (Female/Male) | 1.008 (0.623-1.632) | 0.974 | 0.001 |
| Age (< 50/≥ 50) | 0.693 (0.439-1.093) | 0.114 | 2.491 |
| Liver cirrhosis (Absence/Presence) | 0.648 (0.405-1.035) | 0.069 | 3.297 |
| AFP (≥ 400/< 400) | 1.271 (0.796-2.027) | 0.315 | 1.010 |
| Hepatitis B (-/+) | 0.973 (0.612-1.546) | 0.907 | 0.014 |
| Tumor size (≤ 5 cm/> 5 cm) | 0.617 (0.389-0.979) | 0.040* | 4.205 |
| Tumor number (Single/Multiple) | 1.231 (0.761-1.991) | 0.397 | 0.716 |
| Differentiation (High/Low) | 7.001 (4.168-11.758) | < 0.001* | 54.115 |
| Venous invasion (-/+) | 0.062 (0.030-0.127) | < 0.001* | 57.237 |
| Metastasis (-/+) | 0.041 (0.018-0.092) | < 0.001* | 59.404 |
| AJCC staging (I, II/III, IV) | 0.262 (0.150-0.458) | < 0.001* | 22.183 |
| Serum miR-21 (Low/High) | 0.443 (0.280-0.702) | 0.001* | 12.039 |
| Multivariate | |||
| Tumor size (≤ 5 cm/> 5 cm) | 1.639 (0.760-3.534) | 0.207 | 1.589 |
| Differentiation (High/Low) | 2.364 (1.180-4.734) | 0.015* | 5.896 |
| Venous invasion (-/+) | 0.299 (0.125-0.717) | 0.007* | 7.333 |
| Metastasis (-/+) | 0.178 (0.059-0.541) | 0.002* | 9.251 |
| AJCC staging (I, II/III, IV) | 0.318 (0.118-0.858) | 0.024* | 5.113 |
| Serum miR-21 (Low/High) | 2.229 (1.328-3.743) | 0.002* | 9.197 |
RR = Relative risk; CI = Confidence Interval.
Statistically significant difference.
Establishing and analyzing an HCC rat model
A month after DENA tumor induction, rats in the experimental group exhibited reduced food and water consumption. Two months after induction, the hair of the rats turned yellow. They also exhibited darker color urine, thinning stools, and a rough liver surface; various sized nodules were also visible in the liver. Three months after induction the rats had deteriorated mobility, abdominal distension, hemorrhagic ascites in the opened abdominal cavity, and protrusions from the nodular hepatic surface with partially visible lumps. Six animals died in the experimental group during the establishment of the model (one in week 13, one in week 15, and four in week 16). All rats in the control group were normal, with a fast increased weight, a ruddy and shiny liver surface, and no obvious abnormalities.
Observation of the tissue sections under a light microscope showed that the structure of the hepatic lobules was normal in the control rats. Specifically, the hepatic cords were arranged neatly, and cells were arranged radially from the central veins (Figure 3A). The synthesis of the hepatic extracellular matrix was increased in week 8 of the experimental rats. In addition, there was proliferation of fibrous tissue in the portal area, and the hepatic lobules showed features of liver fibrosis (Figure 3B). The formation of pseudolobules occurred in week 10, and space separated the central venous area and portal area, consistent with the development of cirrhosis (Figure 3C). Atypical liver cells were detected in the pseudolobules around week 12, with increased mitosis and visible pathological mitosis. These are all early signs of HCC (Figure 3D). On week 16, the liver cells were arranged in lumps and had infiltrated into the normal peripheral liver cells. Hemorrhagic necrosis and inflammatory cell infiltration occurred with visible lung metastases, which are signs of advanced HCC (Figure 3E).
Figure 3.
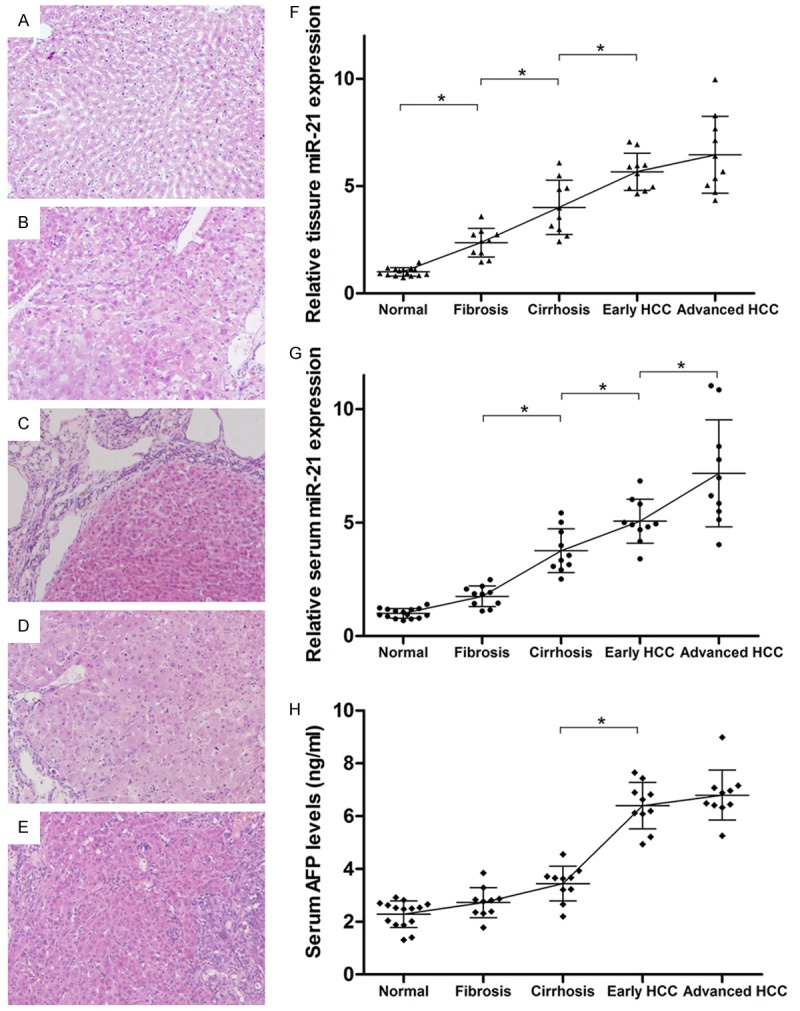
Morphological changes of rat liver in H&E staining, dynamic changes in miR-21 expression in the tissue/serum of the rats by qRT-PCR and changes in AFP levels in the serum of the rats by ELISA. A-E. Liver tissue sections that exhibited signs of normal, fibrosis, cirrhosis, early and advanced HCC separately. Original magnification × 400. F. Tissue miR-21 levels were increased significantly in groups of fibrosis, cirrhosis, early and advanced HCC compared normal group (*P < 0.05). There was no significant difference in tissue miR-21 levels with early and advanced HCC. G. Serum miR-21 levels were increased significantly in cirrhosis, early and advanced HCC compared with the normal and fibrosis groups (*P < 0.05). Serum miR-21 levels were significantly higher in advanced HCC compared with early HCC (*P < 0.05). H. AFP levels were increased significantly in early and advanced HCC compared with the normal, fibrosis, and cirrhosis groups (*P < 0.05). And there was no significant difference in AFP levels with early and advanced HCC.
Changes in miR-21 expression in the liver and serum of the rats
Classical AJCC staging of liver cancer and the above H&E staining results were used to screen HCC progression (i.e., fibrosis, cirrhosis, early HCC, and advanced HCC) in the experimental group (n = 40, 10 separately on weeks 8, 10, 12, and 16). The control group was treated as normal stage (n = 15, 3 separately at the same time points as well as week 0). The qRT-PCR results revealed that miR-21 levels were increased significantly in the liver tissues that exhibited signs of fibrosis, cirrhosis, and early and advanced HCC compared normal tissues (P < 0.05) (Figure 3F). However, there was no significant difference in miR-21 levels in the livers with early and advanced HCC. Serum miR-21 levels were increased significantly in the cirrhosis, early and advanced HCC compared with normal and fibrosis groups (P < 0.05) (Figure 3G). In addition, serum miR-21 levels were significantly higher in advanced HCC compared with early HCC groups (P < 0.05) (Figure 3G).
Changes in AFP levels in the serum of the rats
In order to analyze the relationship between AFP levels and serum miR-21 in the process of tumor formation. The ELISA was used to detect the levels of AFP in the extracted serum. The results revealed that AFP levels were increased significantly in early and advanced HCC compared with the normal, fibrosis, and cirrhosis groups (P < 0.05) (Figure 3H). And there was no significant difference in early and advanced HCC. From this result we can find that, comparing with the changes in AFP levels, changes in serum miR-21 were earlier and more accurately reflected the process of the formation of HCC. It showed the superiority of miR-21 as a new serum HCC marker.
Changes in miR-21 downstream proteins in rat livers
In order to verify whether miR-21 was involved throughout the regulation of tumor formation, the proteins PDCD4 and PTEN which were regulated by mir-21 were chosen. First, the immunohistochemical staining of these two proteins exhibits different positive degrees (Figure 4A-J). And we can clearly find that their intensities of the staining decreased gradually in the process of tumor formation (Figure 4A-J). Next, RNA was isolated from the liver tissues of different groups as described above. The qRT-PCR results revealed that mRNA levels of PDCD4 and PTEN were decreasing gradually in the liver tissues that exhibited signs of normal, fibrosis, cirrhosis, early and advanced HCC tissues samples (Figure 4K). Finally, proteins were extracted from the liver tissues of different groups. Western blotting was then used to assess the expression of these two proteins. The expression of both proteins decreased gradually (Figure 4L), and was negatively correlated with the gradual increase in miR-21 expression in the liver. All these results suggested that PDCD4 and PTEN were negatively regulated by miR-21 and involved throughout the formation of HCC.
Figure 4.

Changes in miR-21 downstream proteins PDCD4 and PTEN in rat livers. A-E. The immunohistochemical staining of PDCD4 of liver tissue sections that exhibited signs of normal, fibrosis, cirrhosis, early and advanced HCC separately. F-J. The immunohistochemical staining of PTEN of liver tissue sections. Both of them were original magnification × 400. The intensities of the staining of two proteins decreased gradually in the process of tumor formation. K. The mRNA levels of PDCD4 and PTEN detected by qRT-PCR were decreasing gradually at different stages of HCC. L. The expression of proteins PDCD4 and PTEN assessed by western blot decreased gradually in the groups described above.
Discussion
HCC is the most common malignant tumor worldwide, and has the fifth highest mortality rate [23]. In vivo animal models are a major method of studying HCC; commonly used models include spontaneous HCC, HCC transplantation, inducible HCC, and HCC transgenic animals [24-26]. Among these, the chemically induced HCC model is relatively common in both clinical and basic research. DENA is a carcinogenic N-nitroso compound that induces single-stranded DNA breaks in liver cells and involved in changing the DNA repairing enzyme. It is generally used to induce HCC in experimental animals [27]. DENA-induced HCC in rats has an insidious onset, a long disease course, and specific carcinogenesis [28,29]. Our previous study used a small dose of DENA (20 mg/kg) via i.p. injection to construct an HCC rat model that achieved a tumor induction rate of 76.2% by week 16 and a mortality rate of 8% [30]. The dose was increased to 30 mg/kg in the current study to accelerate the progression of HCC. This successfully improved the tumor induction rate to 100% within 16 weeks, with a mortality rate of 10%.
Statistical data confirmed that, because of the insidious nature of HCC, only 10% of patients diagnosed with HCC are eligible for surgery [31]. In addition, imaging has only limited value for the early diagnosis of HCC; therefore, serum tumor markers are mainly used for HCC diagnosis. The most widely used marker is AFP, but it has only a low sensitivity (sensitivity, 0.39-0.65; specificity, 0.76-0.94). Nearly one-third of early stage, small HCC tumors (< 3 cm) cannot be detected using AFP screening [32,33].
The discovery of miRNAs was followed by research exploring their potential as markers for the early diagnosis of multiple diseases. Data revealed that the specific expression of miRNAs could be used as diagnostic and prognostic markers for a variety of cancers [34]. Subsequent studies also identified circulating miRNAs. Some authors hypothesized that circulating miRNAs originate from tumor tissues, and that they are present in a certain form in the blood and are resistant to RNase activities [13]. However, it remains unclear how circulating miRNAs originate from tumor tissues. It was suggested that miRNAs could be derived from dying or lysed tumor cells, invasive lymphoma cells, cells from tissues affected by long-term disease, or the active secretion of tumor cells [35].
miR-21 is a prominent miRNA that is associated with tumor occurrence and development. The first study showed that miR-21 was upregulated in malignant gliomas. In addition, the miR-21 expression activated caspases and promoted apoptosis in malignant glioma cell lines [36]. Subsequent studies demonstrated that the overexpression of miR-21 promoted proliferation and protected against apoptosis in various tumors (e.g., breast, lung, colon, and liver cancers) [37-42]. In addition, studies of circulating miRNAs revealed that serum miR-21 levels were elevated in patients with malignant tumors such as diffuse large B-cell lymphoma and ovarian cancer [20,43].
Many studies have reported that serum miR-21 levels were significantly higher in HCC patients carrying the hepatitis B or C virus compared with those with chronic hepatitis and healthy individuals [44-46]. However, other reports demonstrated that serum miR-21 levels were higher in patients with hepatitis B than in those with HCC [47]. An additional study revealed that serum miR-21 levels were lower in patients with hepatitis B than healthy individuals [35]. The differences in these studies might be due to different sample sizes or sample selection. They might also be due to differences in the RNA extraction procedures or internal controls used. There is no consensus for the selection of stably expressed internal miRNA controls in serum or plasma samples. The current study used the exogenous internal control recommended by Qiagen by adding a Caenorhabditis elegans miR-39 miRNA analog to the sample and then detecting its expression as a standard reference gene.
As expected, the results of the clinical case analysis in the current study were consistent with previous studies. On the premise of these clinical data, the current study linked the serum and liver tissue miR-21 levels with the occurrence and development of HCC and presented the dynamic changes in miR-21 levels at different stages of HCC. Data revealed that tissue and serum miR-21 expression increased gradually as HCC progressed in the rat model; the difference between the early two stages (i.e., normal and fibrosis) and liver cirrhosis, and early and advanced HCC was statistically significant. In particular, serum miR-21 levels were significantly higher in advanced HCC compared with early HCC groups. This phenomenon indicated that serum miR-21 significantly increased in advanced HCC which might result from tumor secretion. It also suggested the occurrence of malignant signs, such as metastasis etc. On the other hand, there was no significant difference in serum AFP levels until tumor appears. Therefore, compared with AFP, changes in serum miR-21 are earlier and more accurately reflect the process of the formation of tumors.
Previous studies revealed that miR-21 specifically targets and regulates PTEN and PDCD4 to promote cell proliferation and tumor invasion in HCC [48]. The current study extracted proteins and mRNA from livers isolated at different stages to analyze the changes in PTEN and PDCD4 expression. Data revealed that both proteins were involved in the occurrence and development of HCC. Their expression patterns were negatively correlated with miR-21 levels, suggesting that PTEN and PDCD4 are negatively regulated by miR-21.
This current study suggested that serum miR-21 was associated with the prognosis of HCC and changes in serum miR-21 are earlier and more accurately reflect the process of the formation of tumors than AFP; therefore, serum miR-21 could be used as an early diagnostic marker for HCC. Maybe combined detection of serum miRNA-21 and AFP would be better. Nevertheless, we did not stratify the data according to hepatitis B virus (HBV) infection because the DENA-induced HCC rat model does not simulate the progression of hepatitis B. Large sample clinical studies are necessary to analyze the correlation between serum miRNAs, HCC and other factors to assess if the expression of serum miRNAs is affected by other factors such as cirrhosis, HBV infection, and hepatitis C virus (HCV) infection. Our in vivo study demonstrated that serum miR-21 levels were 5.064-fold lower in control rats than in early HCC. To confirm if this fold value could be used as a diagnostic standard for HCC rats, a refined classification of the stages between liver cirrhosis and early HCC is needed. By detecting the levels in serum miRNAs at these refined stages, this fold value could be used as a diagnostic standard for HCC rats and be further verified by histopathological examinations. A similar strategy could also be applied to large-scale clinical samples. By comparing the miRNA levels of HCC patients with healthy volunteers, a fold-increase could be obtained and further verified. It is an arduous work and requires large amount of data, and only then miRNAs might become diagnostic biomarkers for cancers.
Acknowledgements
This study was supported by grants from the national natural science foundation of china (No. 81101619/H1607) and the natural science foundation of Shaanxi province, china (No 2012JQ4032).
Disclosure of conflict of interest
None.
References
- 1.Tung-Ping PR, Fan ST, Wong J. Risk factors, prevention, and management of postoperative recurrence after resection of hepatocellular carcinoma. Ann Surg. 2000;232:10–24. doi: 10.1097/00000658-200007000-00003. [DOI] [PMC free article] [PubMed] [Google Scholar]
- 2.Farazi PA, DePinho RA. Hepatocellular carcinoma pathogenesis: from genes to environment. Nat Rev Cancer. 2006;6:674–687. doi: 10.1038/nrc1934. [DOI] [PubMed] [Google Scholar]
- 3.Villanueva A, Savic R, Llovet JM. Lymphotoxins: new targets for hepatocellular carcinoma. Cancer Cell. 2009;16:272–273. doi: 10.1016/j.ccr.2009.09.012. [DOI] [PMC free article] [PubMed] [Google Scholar]
- 4.Bartel DP. MicroRNAs: target recognition and regulatory functions. Cell. 2009;136:215–233. doi: 10.1016/j.cell.2009.01.002. [DOI] [PMC free article] [PubMed] [Google Scholar]
- 5.Ambros V. The functions of animal microRNAs. Nature. 2004;431:350–355. doi: 10.1038/nature02871. [DOI] [PubMed] [Google Scholar]
- 6.Miska EA. How microRNAs control cell division, differentiation and death. Curr Opin Genet Dev. 2005;15:563–568. doi: 10.1016/j.gde.2005.08.005. [DOI] [PubMed] [Google Scholar]
- 7.Jay C, Nemunaitis J, Chen P, Fulgham P, Tong AW. miRNA profiling for diagnosis and prognosis of human cancer. Dna Cell Biol. 2007;26:293–300. doi: 10.1089/dna.2006.0554. [DOI] [PubMed] [Google Scholar]
- 8.van Kouwenhove M, Kedde M, Agami R. MicroRNA regulation by RNA-binding proteins and its implications for cancer. Nat Rev Cancer. 2011;11:644–656. doi: 10.1038/nrc3107. [DOI] [PubMed] [Google Scholar]
- 9.Pu XX, Huang GL, Guo HQ, Guo CC, Li H, Ye S, Ling S, Jiang L, Tian Y, Lin TY. Circulating miR-221 directly amplified from plasma is a potential diagnostic and prognostic marker of colorectal cancer and is correlated with p53 expression. J Gastroenterol Hepatol. 2010;25:1674–1680. doi: 10.1111/j.1440-1746.2010.06417.x. [DOI] [PubMed] [Google Scholar]
- 10.Ng EK, Chong WW, Jin H, Lam EK, Shin VY, Yu J, Poon TC, Ng SS, Sung JJ. Differential expression of microRNAs in plasma of patients with colorectal cancer: a potential marker for colorectal cancer screening. Gut. 2009;58:1375–1381. doi: 10.1136/gut.2008.167817. [DOI] [PubMed] [Google Scholar]
- 11.Cheng H, Zhang L, Cogdell DE, Zheng H, Schetter AJ, Nykter M, Harris CC, Chen K, Hamilton SR, Zhang W. Circulating plasma MiR-141 is a novel biomarker for metastatic colon cancer and predicts poor prognosis. PLoS One. 2011;6:e17745. doi: 10.1371/journal.pone.0017745. [DOI] [PMC free article] [PubMed] [Google Scholar]
- 12.Wang LG, Gu J. Serum microRNA-29a is a promising novel marker for early detection of colorectal liver metastasis. Cancer Epidemiol. 2012;36:e61–e67. doi: 10.1016/j.canep.2011.05.002. [DOI] [PubMed] [Google Scholar]
- 13.Mitchell PS, Parkin RK, Kroh EM, Fritz BR, Wyman SK, Pogosova-Agadjanyan EL, Peterson A, Noteboom J, O’Briant KC, Allen A, Lin DW, Urban N, Drescher CW, Knudsen BS, Stirewalt DL, Gentleman R, Vessella RL, Nelson PS, Martin DB, Tewari M. Circulating microRNAs as stable blood-based markers for cancer detection. Proc Natl Acad Sci U S A. 2008;105:10513–10518. doi: 10.1073/pnas.0804549105. [DOI] [PMC free article] [PubMed] [Google Scholar]
- 14.Krichevsky AM, Gabriely G. miR-21: a small multi-faceted RNA. J Cell Mol Med. 2009;13:39–53. doi: 10.1111/j.1582-4934.2008.00556.x. [DOI] [PMC free article] [PubMed] [Google Scholar]
- 15.Meng F, Henson R, Wehbe-Janek H, Ghoshal K, Jacob ST, Patel T. MicroRNA-21 regulates expression of the PTEN tumor suppressor gene in human hepatocellular cancer. Gastroenterology. 2007;133:647–658. doi: 10.1053/j.gastro.2007.05.022. [DOI] [PMC free article] [PubMed] [Google Scholar]
- 16.Connolly E, Melegari M, Landgraf P, Tchaikovskaya T, Tennant BC, Slagle BL, Rogler LE, Zavolan M, Tuschl T, Rogler CE. Elevated expression of the miR-17-92 polycistron and miR-21 in hepadnavirus-associated hepatocellular carcinoma contributes to the malignant phenotype. Am J Pathol. 2008;173:856–864. doi: 10.2353/ajpath.2008.080096. [DOI] [PMC free article] [PubMed] [Google Scholar]
- 17.Liu WH, Wu YT, Li R, Zhang HT, Zhang FQ, Dou KF. Expression profiling of microRNAs in rat hepatocarcinoma cells and fetal hepatocytes. Zhonghua Gan Zang Bing Za Zhi. 2009;17:137–138. [PubMed] [Google Scholar]
- 18.Skog J, Wurdinger T, van Rijn S, Meijer DH, Gainche L, Sena-Esteves M, Curry WJ, Carter BS, Krichevsky AM, Breakefield XO. Glioblastoma microvesicles transport RNA and proteins that promote tumour growth and provide diagnostic biomarkers. Nat Cell Biol. 2008;10:1470–1476. doi: 10.1038/ncb1800. [DOI] [PMC free article] [PubMed] [Google Scholar]
- 19.Tsujiura M, Ichikawa D, Komatsu S, Shiozaki A, Takeshita H, Kosuga T, Konishi H, Morimura R, Deguchi K, Fujiwara H, Okamoto K, Otsuji E. Circulating microRNAs in plasma of patients with gastric cancers. Br J Cancer. 2010;102:1174–1179. doi: 10.1038/sj.bjc.6605608. [DOI] [PMC free article] [PubMed] [Google Scholar]
- 20.Resnick KE, Alder H, Hagan JP, Richardson DL, Croce CM, Cohn DE. The detection of differentially expressed microRNAs from the serum of ovarian cancer patients using a novel real-time PCR platform. Gynecol Oncol. 2009;112:55–59. doi: 10.1016/j.ygyno.2008.08.036. [DOI] [PubMed] [Google Scholar]
- 21.Wang J, Chen J, Chang P, LeBlanc A, Li D, Abbruzzesse JL, Frazier ML, Killary AM, Sen S. MicroRNAs in plasma of pancreatic ductal adenocarcinoma patients as novel blood-based biomarkers of disease. Cancer Prev Res (Phila) 2009;2:807–813. doi: 10.1158/1940-6207.CAPR-09-0094. [DOI] [PMC free article] [PubMed] [Google Scholar]
- 22.Barnes DM, Harris WH, Smith P, Millis RR, Rubens RD. Immunohistochemical determination of oestrogen receptor: comparison of different methods of assessment of staining and correlation with clinical outcome of breast cancer patients. Br J Cancer. 1996;74:1445–1451. doi: 10.1038/bjc.1996.563. [DOI] [PMC free article] [PubMed] [Google Scholar]
- 23.Sherman M. Hepatocellular carcinoma: epidemiology, surveillance, and diagnosis. Semin Liver Dis. 2010;30:3–16. doi: 10.1055/s-0030-1247128. [DOI] [PubMed] [Google Scholar]
- 24.Heindryckx F, Colle I, Van Vlierberghe H. Experimental mouse models for hepatocellular carcinoma research. Int J Exp Pathol. 2009;90:367–386. doi: 10.1111/j.1365-2613.2009.00656.x. [DOI] [PMC free article] [PubMed] [Google Scholar]
- 25.Fausto N, Campbell JS. Mouse models of hepatocellular carcinoma. Semin Liver Dis. 2010;30:87–98. doi: 10.1055/s-0030-1247135. [DOI] [PubMed] [Google Scholar]
- 26.Tang ZY, Ye SL, Liu YK, Qin LX, Sun HC, Ye QH, Wang L, Zhou J, Qiu SJ, Li Y, Ji XN, Liu H, Xia JL, Wu ZQ, Fan J, Ma ZC, Zhou XD, Lin ZY, Liu KD. A decade’s studies on metastasis of hepatocellular carcinoma. J Cancer Res Clin Oncol. 2004;130:187–196. doi: 10.1007/s00432-003-0511-1. [DOI] [PubMed] [Google Scholar]
- 27.Vucur M, Roderburg C, Bettermann K, Tacke F, Heikenwalder M, Trautwein C, Luedde T. Mouse models of hepatocarcinogenesis: what can we learn for the prevention of human hepatocellular carcinoma? Oncotarget. 2010;1:373–378. doi: 10.18632/oncotarget.170. [DOI] [PMC free article] [PubMed] [Google Scholar]
- 28.Okubo H, Moriyama M, Tanaka N, Arakawa Y. Detection of serum and intrahepatic hepatocyte growth factor during DEN-induced carcinogenesis in the rat. Hepatol Res. 2002;24:385–394. doi: 10.1016/s1386-6346(02)00143-2. [DOI] [PubMed] [Google Scholar]
- 29.Fukumasu H, Avanzo JL, Heidor R, Silva TC, Atroch A, Moreno FS, Dagli ML. Protective effects of guarana (Paullinia cupana Mart. var. Sorbilis) against DEN-induced DNA damage on mouse liver. Food Chem Toxicol. 2006;44:862–867. doi: 10.1016/j.fct.2005.11.010. [DOI] [PubMed] [Google Scholar]
- 30.Zhou Ti, Chen Yong, You Nan, Dou Kefeng. Establishment and evalution of hepatocellular carcinoma model induced by diethylnitrosamine in rats. Progress in Modern Biomedicine. 2010;10:3812–3815. [Google Scholar]
- 31.He QY, Zhu R, Lei T, Ng MY, Luk JM, Sham P, Lau GK, Chiu JF. Toward the proteomic identification of biomarkers for the prediction of HBV related hepatocellular carcinoma. J Cell Biochem. 2008;103:740–752. doi: 10.1002/jcb.21443. [DOI] [PubMed] [Google Scholar]
- 32.Collier J, Sherman M. Screening for hepatocellular carcinoma. Hepatology. 1998;27:273–278. doi: 10.1002/hep.510270140. [DOI] [PubMed] [Google Scholar]
- 33.Yang Y, Zhu R. Diagnostic value of circulating microRNAs for hepatocellular carcinoma. Mol Biol Rep. 2014;41:6919–6929. doi: 10.1007/s11033-014-3578-7. [DOI] [PubMed] [Google Scholar]
- 34.Calin GA, Croce CM. MicroRNA signatures in human cancers. Nat Rev Cancer. 2006;6:857–866. doi: 10.1038/nrc1997. [DOI] [PubMed] [Google Scholar]
- 35.Qi P, Cheng SQ, Wang H, Li N, Chen YF, Gao CF. Serum microRNAs as biomarkers for hepatocellular carcinoma in Chinese patients with chronic hepatitis B virus infection. PLoS One. 2011;6:e28486. doi: 10.1371/journal.pone.0028486. [DOI] [PMC free article] [PubMed] [Google Scholar]
- 36.Chan JA, Krichevsky AM, Kosik KS. MicroRNA-21 is an antiapoptotic factor in human glioblastoma cells. Cancer Res. 2005;65:6029–6033. doi: 10.1158/0008-5472.CAN-05-0137. [DOI] [PubMed] [Google Scholar]
- 37.Huang YS, Dai Y, Yu XF, Bao SY, Yin YB, Tang M, Hu CX. Microarray analysis of microRNA expression in hepatocellular carcinoma and non-tumorous tissues without viral hepatitis. J Gastroenterol Hepatol. 2008;23:87–94. doi: 10.1111/j.1440-1746.2007.05223.x. [DOI] [PubMed] [Google Scholar]
- 38.Ladeiro Y, Couchy G, Balabaud C, Bioulac-Sage P, Pelletier L, Rebouissou S, Zucman-Rossi J. MicroRNA profiling in hepatocellular tumors is associated with clinical features and oncogene/ tumor suppressor gene mutations. Hepatology. 2008;47:1955–1963. doi: 10.1002/hep.22256. [DOI] [PubMed] [Google Scholar]
- 39.Iorio MV, Ferracin M, Liu CG, Veronese A, Spizzo R, Sabbioni S, Magri E, Pedriali M, Fabbri M, Campiglio M, Menard S, Palazzo JP, Rosenberg A, Musiani P, Volinia S, Nenci I, Calin GA, Querzoli P, Negrini M, Croce CM. MicroRNA gene expression deregulation in human breast cancer. Cancer Res. 2005;65:7065–7070. doi: 10.1158/0008-5472.CAN-05-1783. [DOI] [PubMed] [Google Scholar]
- 40.Markou A, Tsaroucha EG, Kaklamanis L, Fotinou M, Georgoulias V, Lianidou ES. Prognostic value of mature microRNA-21 and microRNA-205 overexpression in non-small cell lung cancer by quantitative real-time RT-PCR. Clin Chem. 2008;54:1696–1704. doi: 10.1373/clinchem.2007.101741. [DOI] [PubMed] [Google Scholar]
- 41.Gao W, Xu J, Liu L, Shen H, Zeng H, Shu Y. A systematic-analysis of predicted miR-21 targets identifies a signature for lung cancer. Biomed Pharmacother. 2012;66:21–28. doi: 10.1016/j.biopha.2011.09.004. [DOI] [PubMed] [Google Scholar]
- 42.Schetter AJ, Leung SY, Sohn JJ, Zanetti KA, Bowman ED, Yanaihara N, Yuen ST, Chan TL, Kwong DL, Au GK, Liu CG, Calin GA, Croce CM, Harris CC. MicroRNA expression profiles associated with prognosis and therapeutic outcome in colon adenocarcinoma. JAMA. 2008;299:425–436. doi: 10.1001/jama.299.4.425. [DOI] [PMC free article] [PubMed] [Google Scholar]
- 43.Lawrie CH, Gal S, Dunlop HM, Pushkaran B, Liggins AP, Pulford K, Banham AH, Pezzella F, Boultwood J, Wainscoat JS, Hatton CS, Harris AL. Detection of elevated levels of tumour-associated microRNAs in serum of patients with diffuse large B-cell lymphoma. Br J Haematol. 2008;141:672–675. doi: 10.1111/j.1365-2141.2008.07077.x. [DOI] [PubMed] [Google Scholar]
- 44.Qu KZ, Zhang K, Li H, Afdhal NH, Albitar M. Circulating microRNAs as biomarkers for hepatocellular carcinoma. J Clin Gastroenterol. 2011;45:355–360. doi: 10.1097/MCG.0b013e3181f18ac2. [DOI] [PubMed] [Google Scholar]
- 45.Tomimaru Y, Eguchi H, Nagano H, Wada H, Kobayashi S, Marubashi S, Tanemura M, Tomokuni A, Takemasa I, Umeshita K, Kanto T, Doki Y, Mori M. Circulating microRNA-21 as a novel biomarker for hepatocellular carcinoma. J Hepatol. 2012;56:167–175. doi: 10.1016/j.jhep.2011.04.026. [DOI] [PubMed] [Google Scholar]
- 46.Li J, Wang Y, Yu W, Chen J, Luo J. Expression of serum miR-221 in human hepatocellular carcinoma and its prognostic significance. Biochem Biophys Res Commun. 2011;406:70–73. doi: 10.1016/j.bbrc.2011.01.111. [DOI] [PubMed] [Google Scholar]
- 47.Xu J, Wu C, Che X, Wang L, Yu D, Zhang T, Huang L, Li H, Tan W, Wang C, Lin D. Circulating microRNAs, miR-21, miR-122, and miR-223, in patients with hepatocellular carcinoma or chronic hepatitis. Mol Carcinog. 2011;50:136–142. doi: 10.1002/mc.20712. [DOI] [PubMed] [Google Scholar]
- 48.Liu C, Yu J, Yu S, Lavker RM, Cai L, Liu W, Yang K, He X, Chen S. MicroRNA-21 acts as an oncomir through multiple targets in human hepatocellular carcinoma. J Hepatol. 2010;53:98–107. doi: 10.1016/j.jhep.2010.02.021. [DOI] [PubMed] [Google Scholar]