

Abstract
Little is known about the association between the muscle Ras (MRAS) gene rs6782181 polymorphism and serum lipid levels. The aim of the present study was to investigate the association between the MRAS rs6782181 polymorphism and serum lipid levels in the Mulao and Han populations. A total of 632 subjects of Han and 629 unrelated subjects of Mulao nationalities were randomly selected from our previous stratified randomized samples. Genotypes of the MARS rs6782181 polymorphism were determined via polymerase chain reaction and restriction fragment length polymorphism. The subjects with GG genotype had higher serum total cholesterol (TC), triglyceride (TG), low-density lipoprotein cholesterol (LDL-C), and apolipoprotein (Apo) B levels in Han, and higher serum TC and LDL-C levels in Mulao than the subjects with AA/AG genotypes (P < 0.05-0.01). Subgroup analyses showed that the subjects with GG genotype had higher TC, TG, high-density lipoprotein cholesterol (HDL-C), LDL-C, ApoAI and ApoB in Han males, lower ApoAI and the ratio of ApoAI to ApoB in Han females; and higher LDL-C levels in Mulao males but not in Mulao females than the subjects with AG/AA genotypes. The association of the MARS rs6782181 polymorphism and serum lipid levels is different between the Mulao and Han populations, or between males and females in the both ethnic groups. There may be an ethnic- and/or sex-specific association between the MRAS rs6782181 polymorphism and serum lipid levels in our study populations.
Keywords: Muscle Ras, MRAS, 3q22.3, single nucleotide polymorphism, serum lipid level, rs6782181
Introduction
Cardiovascular disease (CVD), which includes both coronary heart disease (CHD) and cerebrovascular disease (stroke), remains the one of the leading causes of death in western society, and is of growing concern in developing countries, despite the great advances have made in understanding its underlying pathophysiology [1-4]. It is generally accepted that hypercholesterolemia is a major health problem associated with an increased risk of CVD, especially low-density lipoprotein cholesterol (LDL-C) level elevation and conversely low level of high-density lipoprotein cholesterol (HDL-C) are mainly involved in disease development and progression [5-8], and serum triglyceride (TG) concentration plays a pivotal independent risk factor for atherosclerosis [9-11]. Dyslipidemia is a multi-factorial disease influenced by both environmental and genetic factors [12-14], accumulating evidences have shown that the heritability estimates of the interindividual variation give rise to a considerable genetic contribution [15-18].
Recently, a new susceptibility locus for dyslipidemia, rs6782181 single nucleotide polymorphism (SNP) was identified on chromosome 3q22.3 in Saudi individuals [19]. The muscle Ras (MRAS) gene resides on chromosome 3q22.3 and encodes a member of the membrane-associated Ras small GTPase proteins, which function as signal transducers in multiple processes including cell growth and differentiation [19,20]. Several studies revealed a region on 3q22.3, which encompasses the MRAS, rs9818870 SNP as a risk factor for CHD [21,22]. In the present study, our aim was to investigate the association between the MARS rs6782181 SNP and serum lipid levels in the Han and Mulao populations.
Materials and methods
Study subjects
There were 632 subjects of Han population and 629 unrelated subjects of Mulao population who were randomly selected from our previous stratified randomized samples [23]. All subjects were rural agricultural workers reside in Luocheng Mulao Autonomous County, Guangxi Zhuang Autonomous Region, People’s Republic of China. The participants of Han consisted of 267 (42.24%) males and 365 (57.76%) females, with a mean age of 53.40 ± 14.26 years. The subjects of Mulao consisted of 290 (46.10%) males and 339 (53.90%) females, with a mean age of 53.09 ± 14.41 years. Subjects with diseases related to atherosclerosis, CHD, diabetes or those who were using lipid-lowering medication (such as statins or fibrates, beta-blockers, diuretics, or hormones) were excluded from the study before the blood sample was taken. The study design was approved by the Ethics Committee of the First Affiliated Hospital, Guangxi Medical University. Written informed consent was obtained from all subjects before participation.
Epidemiological survey
The survey was carried out using internationally standardized methods, following a common protocol [24]. Information on demographics, socioeconomic status, and lifestyle factors was collected with standardized questionnaires. The intake of alcohol was quantified as the number of liang (about 50 g) of rice wine, corn wine, rum, beer, or liquor consumed during the preceding 12 months. Alcohol consumption was categorized into groups of grams of alcohol per day: ≤ 25 and > 25. Smoking status was categorized into groups of cigarettes per day: ≤ 20 and > 20. In the physical examination, several parameters such as height, weight, and waist circumference were measured. Sitting blood pressure was measured three times with the use of a mercury sphygmomanometer after a 5-minute of rest, and the average of the three measurements was recorded. Systolic blood pressure was determined by the first Korotkoff sound, and diastolic blood pressure by the fifth Korotkoff sound. Body weight, to the nearest 50 grams, was measured using a portable balance scale. Subjects were weighed in a minimum of clothing with shoes off. Height was measured, to the nearest 0.5 cm, using a stadiometer. From these two measurements BMI was calculated.
Biochemical measurements
Blood samples were obtained in the fasting state. Biochemical parameters including total cholesterol (TC), TG, HDL-C, LDL-C were measured by enzymatic methods with commercially available kits. Serum apolipoprotein (Apo) AI and ApoB concentrations were quantified by the immunoturbidimetric immunoassay using a commercial kit. Fasting blood glucose was determined by glucose meter.
DNA amplification and genotyping
Genomic DNA was isolated from peripheral blood leukocytes using the phenol-chloroform method. The extracted DNA was stored at 4°C until analysis. Genotyping of the MARS rs6782181 SNP was performed by polymerase chain reaction and restriction fragment length polymorphism (PCR-RFLP). PCR amplification was performed using 5’-CTGTAATCACTGCCAACTC-3’ and 5’-CAGCACGAACCTGTAAAA-3’ (Sangon, Shanghai, People’s Republic of China) as the forward and reverse primer pairs, respectively. Each amplification reaction was performed in a total volume of 25 μL, containing 2 μL of genomic DNA, 1 μL of each primer (10 pmol/L), 12.5 μL of 2 × Taq PCR Mastermix (constituent: 20 mM Tris-HCl, pH 8.3, 100 mM KCl, 3 mM MgCl2, 0.1 U Taq Polymerase/μL, 500 μM dNTP each; Sangon, Shanghai, People’s Republic of China), and 8.5 μL of ddH2O (DNase/RNase-free), processing started with 94°C for 5 min and followed by 45 s of denaturing at 94°C, 45 s of annealing at 51°C and 1 min of extension at 72°C for 30 cycles. The amplification was completed by a final extension at 72°C for 7 min. Then 10 U of TaiI enzyme was added directly to the PCR products (10 μL) and digested at 65°C overnight. After restriction enzyme digestion of the amplified DNA, genotypes were identified by electrophoresis on 2% ethidium-bromide stained agarose gels and visualizing with ultraviolet illumination. Genotypes were scored by an experienced reader blinded to the epidemiological and lipid results.
Diagnostic criteria
The normal values of serum TC, TG, HDL-C, LDL-C, ApoAI, ApoB levels, and the ratio of ApoAI to ApoB in our Clinical Science Experiment Center were 3.10-5.17, 0.56-1.70, 0.91-1.81, 2.70-3.20 mmol/L, 1.00-1.78, 0.63-1.14 g/L, and 1.00-2.50; respectively [23]. Hypertension was assessed according to the criteria of 1999 World Health Organization-International Society of Hypertension Guidelines for the management of hypertension [25].
Statistical analyses
Statistical analyses were performed by the statistical software package SPSS 16.0 (SPSS Inc., Chicago, Illinois). Qualitative variables were expressed as raw count and percentage. The quantitative variables were presented as mean ± standard deviation (serum TG levels were presented as medians and interquartile ranges). General characteristics between Mulao and Han were compared by Student’s unpaired t-test. Genotypic and allelic frequencies were calculated by direct counting, and the standard goodness-of-fit test was used to investigate departures from Hardy-Weinberg equilibrium. The difference in genotype distribution and sex ratio between the populations was test by chi-square analysis. Factors that may influence serum lipid concentrations: sex, age, BMI, blood pressure, alcohol consumption, cigarette smoking were adjusted for the statistical analysis. Relationship between serum lipid levels and genotypes and several environment factors were assessed by multiple linear regression analysis with stepwise modeling. A P value less than 0.05 (two-tailed) was regarded as statistically significant.
Results
General characteristics and serum lipid levels
The comparison of general characteristics and serum lipid levels between the Mulao and Han populations is summarized in Table 1. The levels of BMI and diastolic blood pressure was lower in Mulao than in Han (P < 0.01), whereas the level of height and ApoB were higher in Mulao than in Han (P < 0.05-0.001). There were no significant differences in the levels of age structure, weight, waist circumference, systolic blood pressure, pulse pressure, glucose, TC, TG, HDL-C, LDL-C, ApoAI and the ratio of ApoAI to ApoB between the two ethnic groups (P > 0.05 for all).
Table 1.
Comparison of demographic, lifestyle characteristics and serum lipid levels between Mulao and Han populations
| Parameter | Han | Mulao | t (χ2) | P |
|---|---|---|---|---|
| Number | 632 | 629 | ||
| Male/female | 267/365 | 290/339 | 1.903 | 0.168 |
| Age (years) | 53.40 ± 14.26 | 53.09 ± 14.41 | 0.394 | 0.694 |
| Height (cm) | 154.18 ± 8.27 | 155.28 ± 8.17 | -2.393 | 0.017 |
| Weight (kg) | 53.69 ± 9.09 | 52.67 ± 9.33 | 1.958 | 0.050 |
| Body mass index (kg/m2) | 22.56 ± 3.36 | 21.78 ± 3.04 | 4.344 | 0.000 |
| waist circumference (cm) | 75.47 ± 7.83 | 74.97 ± 8.52 | 1.089 | 0.277 |
| Cigarette smoking (n %) | ||||
| Nonsmoker | 453 (71.7) | 467 (74.2) | ||
| ≤ 20 cigarettes/day | 160 (25.3) | 133 (21.1) | 4.777 | 0.092 |
| > 20 cigarettes/day | 19 (3.0) | 29 (4.6) | ||
| Alcohol consumption [n (%)] | ||||
| Nondrinker | 498 (78.8) | 464 (73.8) | ||
| ≤ 25 g/day | 65 (10.3) | 62 (9.9) | 7.986 | 0.018 |
| > 25 g/day | 69 (10.9) | 103 (16.4) | ||
| Systolic blood pressure (mmHg) | 130.52 ± 19.49 | 129.48 ± 21.63 | 0.896 | 0.370 |
| Diastolic blood pressure (mmHg) | 82.81 ± 11.46 | 80.87 ± 11.58 | 2.983 | 0.003 |
| Pulse pressure (mmHg) | 47.71 ± 15.02 | 48.61 ± 16.27 | -1.017 | 0.309 |
| Glucose (mmol/L) | 6.17 ± 1.89 | 6.06 ± 1.68 | 1.214 | 0.225 |
| Total cholesterol (mmol/L) | 5.00 ± 0.87 | 5.04 ± 1.05 | -0.598 | 0.550 |
| Triglyceride (mmol/L) | 1.10 (0.85) | 1.08 (0.73) | 0.841 | 0.478 |
| HDL-C (mmol/L) | 1.73 ± 0.53 | 1.78 ± 0.45 | -1.738 | 0.082 |
| LDL-C (mmol/L) | 2.91 ± 0.78 | 2.98 ± 0.80 | -1.473 | 0.141 |
| Apolipoprotein (Apo) AI (g/L) | 1.33 ± 0.24 | 1.33 ± 0.40 | 0.309 | 0.757 |
| ApoB (g/L) | 0.86 ± 0.18 | 0.99 ± 0.57 | -5.587 | 0.000 |
| ApoAI/Apo B | 1.63 ± 0.49 | 1.59 ± 0.79 | 1.144 | 0.253 |
HDL-C: high-density lipoprotein cholesterol; LDL-C: low-density lipoprotein cholesterol.
Results of electrophoresis and genotyping
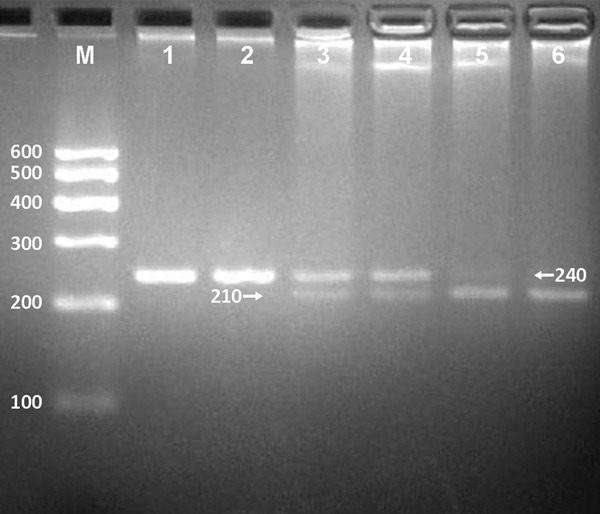
After the genomic DNA of the samples was amplified by PCR and imaged by 2.0% agarose gel electrophoresis, the purpose gene of 240 bp nucleotide sequences could be found in all samples (Figure 1). The genotypes identified were named according to the presence or absence of the enzyme restriction sites, when an A to G transversion at rs6782181 SNP. The presence of the cutting site indicates the G allele; while its absence indicates the A allele (cannot be cut). Therefore, the AA genotype is homozygote for the absence of the site (band at 240 bp), AG genotype is heterozygote for the absence and presence of the site (bands at 240-, 210- and 30-bp), and GG genotype is homozygote for the presence of the site (bands at 210- and 30-bp; Figure 2).
Figure 1.

Electrophoresis of PCR products and genotyping of the MARS rs6782181 polymorphism. Lane M, 100 bp marker ladder; lanes 1-5, samples. The 240 bp bands are the PCR products.
Figure 2.
Genotyping of the MARS rs6782181 SNP. Lane M, 100 bp marker ladder; lanes 1 and 2, AA genotype (240 bp); lanes 3 and 4, AG genotype (240-, 210- and 30-bp); lanes 5 and 6, GG genotype (210- and 30-bp). The 30 bp fragments were invisible in the gel owing to their fast migration speed.
Genotypic and allelic frequencies
The genotypic and allelic distribution of the rs6782181 SNP is revealed in Table 2. The genotypic distribution was followed Hardy-Weinberg equilibrium (HWE). The frequency of MARS rs6782181-G allele was 25.2% in Han and 26.3% in Mulao. There was no significant difference in either genotypic or allelic frequencies between Mulao and Han, or between males and females in both ethnic groups.
Table 2.
Comparison of the genotype and allele frequencies of rs6782181 polymorphism in the Mulao and Han populations [n (%)]
| Group | N | Genotype | Allele | HWE (P) | |||
|---|---|---|---|---|---|---|---|
|
| |||||||
| AA | AG | GG | A | G | |||
| Han | 632 | 359 (56.8) | 227 (35.9) | 46 (7.3) | 945 (74.8) | 319 (25.2) | 0.226 |
| Mulao | 629 | 346 (55.0) | 235 (37.4) | 48 (7.6) | 927 (73.7) | 331 (26.3) | 0.360 |
| χ 2 | 0.414 | 0.380 | |||||
| P | 0.813 | 0.537 | |||||
| Han | |||||||
| Male | 267 | 149 (55.8) | 97 (36.3) | 21 (7.9) | 395 (74.1) | 139 (25.9) | 0.355 |
| Female | 365 | 210 (57.5) | 130 (35.6) | 25 (6.8) | 550 (75.3) | 180 (24.7) | 0.429 |
| χ 2 | 0.322 | 0.308 | |||||
| P | 0.851 | 0.579 | |||||
| Mulao | |||||||
| Male | 290 | 151 (52.1) | 117 (40.3) | 22 (7.6) | 419 (72.2) | 161 (27.8) | 0.919 |
| Female | 339 | 195 (57.5) | 118 (34.8) | 26 (7.7) | 508 (74.9) | 170 (25.1) | 0.175 |
| χ 2 | 2.129 | 1.162 | |||||
| P | 0.345 | 0.281 | |||||
HWE: Hardy-Weinberg equilibrium.
Genotypes and serum lipid levels
As shown in Table 3, the subjects with GG genotype had higher serum TC, TG, LDL-C, and ApoB levels in Han, and higher serum TC and LDL-C levels in Mulao than the subjects with AA/AG genotypes (P < 0.05-0.01). When serum lipid parameters were compared according to the sex subgroups, the subjects with GG genotype had higher TC, TG, HDL-C, LDL-C, ApoAI and ApoB in Han males, lower ApoAI and the ratio of ApoAI to ApoB in Han females; and higher LDL-C levels in Mulao males but not in Mulao females than the subjects with AG/AA genotypes.
Table 3.
Comparison of serum lipid levels among the genotypes between the Mulao and Han populations
| Ethnic/Genotype | N | TC (mmol/L) | TG (mmol/L) | HDL-C (mmol/L) | LDL-C (mmol/L) | Apo AI (g/L) | Apo B (g/L) | ApoAI/ApoB |
|---|---|---|---|---|---|---|---|---|
| Han | ||||||||
| AA | 359 | 4.93 ± 0.81 | 1.09 (0.78) | 1.71 ± 0.40 | 2.87 ± 0.67 | 1.33 ± 0.23 | 0.85 ± 0.18 | 1.63 ± 0.49 |
| AG | 227 | 5.03 ± 0.88 | 1.07 (0.77) | 1.76 ± 0.68 | 2.91 ± 0.85 | 1.33 ± 0.23 | 0.85 ± 0.17 | 1.65 ± 0.50 |
| GG | 46 | 5.43 ± 1.09 | 1.55 (0.87) | 1.77 ± 0.59 | 3.26 ± 1.09 | 1.36 ± 0.37 | 0.95 ± 0.26 | 1.48 ± 0.49 |
| F | 6.983 | 8.080 | 0.838 | 5.312 | 0.401 | 6.200 | 2.433 | |
| P | 0.001 | 0.018 | 0.433 | 0.005 | 0.670 | 0.002 | 0.089 | |
| Han/male | ||||||||
| AA | 149 | 5.07 ± 0.87 | 1.18 (0.98) | 1.64 ± 0.41 | 2.96 ± 0.67 | 1.32 ± 0.25 | 0.91 ± 0.19 | 1.51 ± 0.46 |
| AG | 97 | 5.07 ± 0.86 | 1.23 (0.83) | 1.63 ± 0.35 | 2.82 ± 0.88 | 1.32 ± 0.28 | 0.87 ± 0.17 | 1.59 ± 0.55 |
| GG | 21 | 5.82 ± 0.81 | 1.55 (0.70) | 1.87 ± 0.37 | 3.47 ± 0.80 | 1.57 ± 0.24 | 1.04 ± 0.19 | 1.57 ± 0.41 |
| F | 7.367 | 7.407 | 3.445 | 6.282 | 8.757 | 7.065 | 0.801 | |
| P | 0.001 | 0.025 | 0.033 | 0.002 | 0.000 | 0.001 | 0.450 | |
| Han/female | ||||||||
| AA | 210 | 4.84 ± 0.76 | 1.02 (0.60) | 1.75 ± 0.38 | 2.80 ± 0.67 | 1.33 ± 0.21 | 0.81 ± 0.16 | 1.72 ± 0.49 |
| AG | 130 | 5.00 ± 0.89 | 0.97 (0.86) | 1.85 ± 0.84 | 2.97 ± 0.83 | 1.34 ± 0.19 | 0.83 ± 0.17 | 1.69 ± 0.45 |
| GG | 25 | 5.11 ± 1.20 | 1.23 (0.85) | 1.69 ± 0.72 | 3.09 ± 1.27 | 1.19 ± 0.38 | 0.87 ± 0.28 | 1.39 ± 0.54 |
| F | 2.116 | 1.871 | 1.517 | 2.996 | 5.220 | 1.789 | 5.118 | |
| P | 0.122 | 0.392 | 0.221 | 0.051 | 0.006 | 0.169 | 0.006 | |
| Mulao | ||||||||
| AA | 346 | 5.13 ± 0.94 | 1.04 (0.71) | 1.80 ± 0.47 | 3.04 ± 0.78 | 1.35 ± 0.39 | 1.02 ± 0.58 | 1.55 ± 0.65 |
| AG | 235 | 4.86 ± 1.17 | 1.12 (0.81) | 1.74 ± 0.43 | 2.86 ± 0.80 | 1.31 ± 0.42 | 0.95 ± 0.57 | 1.66 ± 0.96 |
| GG | 48 | 5.20 ± 1.07 | 1.13 (0.74) | 1.78 ± 0.38 | 3.10 ± 0.87 | 1.27 ± 0.39 | 1.03 ± 0.57 | 1.46 ± 0.77 |
| F | 5.311 | 1.527 | 1.238 | 4.360 | 1.227 | 0.984 | 2.147 | |
| P | 0.005 | 0.466 | 0.291 | 0.013 | 0.294 | 0.374 | 0.118 | |
| Mulao/male | ||||||||
| AA | 151 | 5.15 ± 0.88 | 1.12 (0.95) | 1.79 ± 0.56 | 3.02 ± 0.70 | 1.36 ± 0.41 | 1.11 ± 0.73 | 1.52 ± 0.75 |
| AG | 117 | 4.90 ± 1.10 | 1.17 (0.93) | 1.76 ± 0.45 | 2.80 ± 0.80 | 1.36 ± 0.43 | 0.96 ± 0.56 | 1.63 ± 0.67 |
| GG | 22 | 5.27 ± 1.00 | 1.14 (1.05) | 1.66 ± 0.35 | 3.15 ± 0.92 | 1.22 ± 0.36 | 1.07 ± 0.53 | 1.27 ± 0.51 |
| F | 2.715 | 1.488 | 0.709 | 3.511 | 1.192 | 1.683 | 2.529 | |
| P | 0.068 | 0.475 | 0.493 | 0.031 | 0.305 | 0.188 | 0.082 | |
| Mulao/female | ||||||||
| AA | 195 | 5.12 ± 0.99 | 1.03 (0.64) | 1.81 ± 0.39 | 3.06 ± 0.83 | 1.35 ± 0.38 | 0.94 ± 0.43 | 1.57 ± 0.57 |
| AG | 118 | 4.83 ± 1.23 | 1.03 (0.66) | 1.73 ± 0.41 | 2.91 ± 0.81 | 1.26 ± 0.41 | 0.94 ± 0.58 | 1.70 ± 1.17 |
| GG | 26 | 5.13 ± 1.15 | 1.08 (0.56) | 1.89 ± 0.39 | 3.06 ± 0.85 | 1.31 ± 0.42 | 1.00 ± 0.61 | 1.62 ± 0.92 |
| F | 2.787 | 0.199 | 2.574 | 1.240 | 1.636 | 0.144 | 0.845 | |
| P | 0.063 | 0.905 | 0.078 | 0.291 | 0.196 | 0.866 | 0.431 |
TC: total cholesterol; TG: triglyceride; HDL-C: high-density lipoprotein cholesterol; LDL-C: low-density lipoprotein cholesterol; ApoAI: Apolipoprotein AI; ApoB: Apolipoprotein B; ApoAI/ApoB: the ratio of Apolipoprotein AI to Apolipoprotein B. The value of TG was presented as median (interquartile range). The difference among the genotypes was determined by the Kruskal-Wallis test or the Wilcoxon-Mann-Whitney test.
Risk factors for serum lipid parameters
As described in Tables 4 and 5, multiple linear regression analyses showed that the levels of TC and LDL-C in Han but not in Mulao were correlated with genotypes (P < 0.05-0.01). When the regression analysis was performed according to the sex subgroups, we showed that the levels of TC and ApoAI in Han males, LDL-C levels in Han females were associated with genotypes but not in the Mulao population (P < 0.05-0.01).
Table 4.
Relationship between the lipid parameters and relative factors in Mulao and Han
| Lipid parameter | Risk factor | B | Std. Error | Beta | t | P |
|---|---|---|---|---|---|---|
| Han and Mulao | ||||||
| TC | Body mass index | 0.049 | 0.008 | 0.163 | 5.928 | 0.000 |
| Age | 0.010 | 0.002 | 0.155 | 5.525 | 0.000 | |
| Alcohol consumption | 0.093 | 0.037 | 0.069 | 2.504 | 0.012 | |
| Glucose | 0.032 | 0.015 | 0.060 | 2.141 | 0.032 | |
| TG | Waist circumference | 0.042 | 0.004 | 0.294 | 11.013 | 0.000 |
| Alcohol consumption | 0.192 | 0.043 | 0.118 | 4.428 | 0.000 | |
| Glucose | 0.057 | 0.017 | 0.089 | 3.364 | 0.001 | |
| Ethnic group | -0.165 | 0.061 | -0.071 | -2.689 | 0.007 | |
| HDL-C | Waist circumference | -0.008 | 0.002 | -0.134 | -3.541 | 0.000 |
| Alcohol consumption | 0.114 | 0.023 | 0.166 | 5.044 | 0.000 | |
| Gender | 0.123 | 0.033 | 0.124 | 3.707 | 0.000 | |
| Body mass index | -0.013 | 0.006 | -0.087 | -2.347 | 0.019 | |
| LDL-C | Body mass index | 0.049 | 0.007 | 0.201 | 7.388 | 0.000 |
| Age | 0.010 | 0.002 | 0.173 | 6.219 | 0.000 | |
| Glucose | 0.033 | 0.012 | 0.074 | 2.672 | 0.008 | |
| Ethnic group | 0.110 | 0.043 | 0.070 | 2.563 | 0.010 | |
| Cigarette smoking | -0.094 | 0.040 | -0.064 | -2.370 | 0.018 | |
| ApoAI | Alcohol consumption | 0.130 | 0.015 | 0.278 | 8.471 | 0.000 |
| Gender | 0.068 | 0.022 | 0.101 | 3.040 | 0.002 | |
| Waist circumference | -0.004 | 0.001 | -0.087 | -3.103 | 0.002 | |
| Pulse pressure | 0.001 | 0.001 | 0.061 | 2.205 | 0.028 | |
| ApoB | Waist circumference | 0.009 | 0.001 | 0.179 | 6.431 | 0.000 |
| Ethnic group | 0.137 | 0.023 | 0.159 | 5.882 | 0.000 | |
| Pulse pressure | 0.003 | 0.001 | 0.092 | 3.357 | 0.001 | |
| Glucose | 0.019 | 0.007 | 0.078 | 2.860 | 0.004 | |
| Gender | -0.051 | 0.024 | -0.058 | -2.109 | 0.035 | |
| ApoAI/ApoB | Waist circumference | -0.011 | 0.003 | -0.141 | -3.743 | 0.000 |
| Age | -0.004 | 0.001 | -0.092 | -3.335 | 0.001 | |
| Alcohol consumption | 0.151 | 0.030 | 0.164 | 5.040 | 0.000 | |
| Gender | 0.166 | 0.044 | 0.126 | 3.802 | 0.000 | |
| Body mass index | -0.023 | 0.008 | -0.113 | -3.045 | 0.002 | |
| Ethnic group | -0.079 | 0.036 | -0.060 | -2.195 | 0.028 | |
| Glucose | -0.021 | 0.010 | 0.057 | -2.028 | 0.043 | |
| Han | ||||||
| TC | Waist circumference | 0.012 | 0.006 | 0.109 | 2.171 | 0.030 |
| Age | 0.011 | 0.002 | 0.177 | 4.496 | 0.000 | |
| Genotype | 0.138 | 0.053 | 0.100 | 2.617 | 0.009 | |
| Body mass index | 0.034 | 0.013 | 0.131 | 2.596 | 0.010 | |
| Alcohol consumption | 0.114 | 0.050 | 0.087 | 2.270 | 0.024 | |
| Glucose | 0.036 | 0.018 | 0.079 | 2.035 | 0.042 | |
| TG | Waist circumference | 0.055 | 0.006 | 0.322 | 8.779 | 0.000 |
| Alcohol consumption | 0.352 | 0.074 | 0.173 | 4.730 | 0.000 | |
| Glucose | 0.111 | 0.025 | 0.158 | 4.370 | 0.000 | |
| HDL-C | Waist circumference | -0.010 | 0.003 | -0.153 | -3.846 | 0.000 |
| Gender | 0.231 | 0.058 | 0.215 | 3.986 | 0.000 | |
| Alcohol consumption | 0.092 | 0.037 | 0.114 | 2.458 | 0.014 | |
| Cigarette smoking | 0.112 | 0.052 | 0.111 | 2.172 | 0.030 | |
| LDL-C | Age | 0.011 | 0.002 | 0.206 | 5.309 | 0.000 |
| Body mass index | 0.049 | 0.009 | 0.211 | 5.593 | 0.000 | |
| Cigarette smoking | -0.298 | 0.072 | -0.200 | -4.143 | 0.000 | |
| Gender | -0.209 | 0.077 | -0.132 | -2.732 | 0.006 | |
| Genotype | 0.109 | 0.047 | 0.087 | 2.312 | 0.021 | |
| Glucose | 0.034 | 0.016 | 0.084 | 2.171 | 0.030 | |
| ApoAI | Alcohol consumption | 0.133 | 0.016 | 0.361 | 8.086 | 0.000 |
| Gender | 0.130 | 0.025 | 0.263 | 5.167 | 0.000 | |
| Cigarette smoking | 0.086 | 0.023 | 0.185 | 3.805 | 0.000 | |
| Body mass index | -0.010 | 0.003 | -0.131 | -3.486 | 0.001 | |
| ApoB | Waist circumference | 0.005 | 0.001 | 0.221 | 4.667 | 0.000 |
| Glucose | 0.014 | 0.004 | 0.146 | 4.010 | 0.000 | |
| Gender | -0.082 | 0.017 | -0.220 | -4.773 | 0.000 | |
| Body mass index | 0.010 | 0.003 | 0.179 | 3.844 | 0.000 | |
| Age | 0.002 | 0.000 | 0.131 | 3.619 | 0.000 | |
| Cigarette smoking | -0.038 | 0.016 | -0.108 | -2.383 | 0.017 | |
| ApoAI/ApoB | Waist circumference | -0.009 | 0.003 | -0.151 | -3.103 | 0.002 |
| Alcohol consumption | 0.143 | 0.033 | 0.193 | 4.398 | 0.000 | |
| Gender | 0.316 | 0.050 | 0.318 | 6.314 | 0.000 | |
| Cigarette smoking | 0.201 | 0.044 | 0.215 | 4.525 | 0.000 | |
| Body mass index | -0.027 | 0.007 | -0.187 | -3.868 | 0.000 | |
| Age | -0.004 | 0.001 | -0.108 | -2.942 | 0.003 | |
| Mulao | ||||||
| TC | Age | 0.010 | 0.003 | 0.134 | 3.419 | 0.001 |
| Body mass index | 0.050 | 0.014 | 0.144 | 3.668 | 0.000 | |
| TG | Waist circumference | 0.020 | 0.006 | 0.182 | 3.387 | 0.001 |
| Body mass index | 0.045 | 0.016 | 0.147 | 2.725 | 0.007 | |
| HDL-C | Body mass index | -0.038 | 0.006 | -0.259 | -6.760 | 0.000 |
| Alcohol consumption | 0.108 | 0.028 | 0.183 | 3.896 | 0.000 | |
| Gender | 0.093 | 0.042 | 0.104 | 2.220 | 0.027 | |
| LDL-C | Body mass index | 0.049 | 0.010 | 0.187 | 4.816 | 0.000 |
| Age | 0.008 | 0.002 | 0.143 | 3.680 | 0.000 | |
| ApoAI | Alcohol consumption | 0.002 | 0.021 | 0.193 | 4.879 | 0.000 |
| Waist circumference | -0.004 | 0.002 | -0.083 | -2.096 | 0.037 | |
| ApoB | Waist circumference | 0.012 | 0.003 | 0.173 | 4.413 | 0.000 |
| Pulse pressure | 0.004 | 0.001 | 0.116 | 2.969 | 0.003 | |
| ApoAI/ApoB | Waist circumference | -0.019 | 0.004 | -0.202 | -5.144 | 0.000 |
| Age | -0.005 | 0.002 | -0.096 | -2.430 | 0.015 | |
| Alcohol consumption | 0.136 | 0.046 | 0.130 | 2.936 | 0.003 | |
| Cigarette smoking | -0.132 | 0.063 | -0.092 | -2.097 | 0.036 | |
| Glucose | -0.040 | 0.019 | -0.085 | -2.141 | 0.033 |
TC: total cholesterol; TG: triglyceride; HDL-C: high-density lipoprotein cholesterol; LDL-C: low-density lipoprotein cholesterol; ApoAI: Apolipoprotein AI; ApoB: Apolipoprotein B.
Table 5.
Relationship between the lipid parameters and relative factors in male and female of Mulao and Han population
| Lipid parameter | Risk factor | B | Std. Error | Beta | t | P |
|---|---|---|---|---|---|---|
| Han/male | ||||||
| TC | Body mass index | 0.055 | 0.014 | 0.235 | 3.985 | 0.000 |
| Genotype | 0.253 | 0.081 | 0.184 | 3.112 | 0.002 | |
| Cigarette smoking | -0.182 | 0.087 | -0.123 | -2.082 | 0.038 | |
| TG | Waist circumference | 0.071 | 0.012 | 0.334 | 5.913 | 0.000 |
| Alcohol consumption | 0.351 | 0.114 | 0.174 | 3.082 | 0.002 | |
| Glucose | 0.102 | 0.051 | 0.114 | 2.013 | 0.045 | |
| HDL-C | Waist circumference | -0.013 | 0.003 | -0.256 | -4.467 | 0.000 |
| Alcohol consumption | 0.109 | 0.028 | 0.234 | 3.968 | 0.000 | |
| Cigarette smoking | 0.110 | 0.038 | 0.167 | 2.903 | 0.004 | |
| Age | 0.003 | 0.002 | 0.127 | 2.164 | 0.031 | |
| LDL-C | Body mass index | 0.047 | 0.012 | 0.225 | 3.877 | 0.000 |
| Cigarette smoking | -0.315 | 0.076 | -0.241 | -4.148 | 0.000 | |
| ApoAI | Alcohol consumption | 0.140 | 0.017 | 0.436 | 8.250 | 0.000 |
| Cigarette smoking | 0.078 | 0.024 | 0.173 | 3.270 | 0.001 | |
| Waist circumference | -0.006 | 0.002 | -0.170 | -3.275 | 0.001 | |
| Genotype | 0.065 | 0.022 | 0.154 | 2.960 | 0.003 | |
| ApoB | Waist circumference | 0.006 | 0.002 | 0.271 | 4.101 | 0.000 |
| Body mass index | 0.011 | 0.003 | 0.233 | 3.345 | 0.001 | |
| Age | 0.002 | 0.001 | 0.139 | 2.464 | 0.014 | |
| Cigarette smoking | -0.037 | 0.017 | -0.117 | -2.112 | 0.036 | |
| ApoAI/ApoB | Waist circumference | -0.013 | 0.004 | -0.214 | -3.386 | 0.001 |
| Alcohol consumption | 0.165 | 0.031 | 0.282 | 5.244 | 0.000 | |
| Cigarette smoking | 0.184 | 0.044 | 0.224 | 4.192 | 0.000 | |
| Body mass index | -0.027 | 0.008 | -0.209 | -3.307 | 0.001 | |
| Han/female | ||||||
| TC | Age | 0.017 | 0.003 | 0.283 | 5.637 | 0.000 |
| Waist circumference | 0.018 | 0.006 | 0.155 | 3.167 | 0.002 | |
| Glucose | 0.056 | 0.022 | 0.129 | 2.595 | 0.010 | |
| TG | Waist circumference | 0.041 | 0.006 | 0.308 | 6.380 | 0.000 |
| Glucose | 0.117 | 0.024 | 0.232 | 4.805 | 0.000 | |
| LDL-C | Age | 0.019 | 0.003 | 0.339 | 6.907 | 0.000 |
| Waist circumference | 0.020 | 0.005 | 0.189 | 3.905 | 0.000 | |
| Alcohol consumption | -0.477 | 0.189 | -0.123 | -2.525 | 0.012 | |
| ApoAI | Genotype | -0.040 | 0.019 | -0.112 | -2.155 | 0.032 |
| Cigarette smoking | 0.146 | 0.068 | 0.111 | 2.141 | 0.033 | |
| Body mass index | -0.008 | 0.004 | -0.105 | -2.028 | 0.043 | |
| ApoB | Waist circumference | 0.007 | 0.001 | 0.286 | 5.947 | 0.000 |
| Glucose | 0.015 | 0.004 | 0.172 | 3.516 | 0.000 | |
| Pulse pressure | 0.002 | 0.001 | 0.122 | 2.435 | 0.015 | |
| Age | 0.001 | 0.001 | 0.123 | 2.424 | 0.016 | |
| ApoAI/ApoB | Age | -0.008 | 0.002 | -0.220 | -4.286 | 0.000 |
| Cigarette smoking | 0.559 | 0.143 | 0.197 | 3.805 | 0.000 | |
| Body mass index | -0.034 | 0.008 | -0.209 | -4.244 | 0.000 | |
| Genotype | -0.082 | 0.039 | -0.105 | -2.109 | 0.036 | |
| Mulao/male | ||||||
| TC | Pulse pressure | 0.009 | 0.004 | 0.141 | 2.419 | 0.016 |
| TG | Waist circumference | 0.036 | 0.007 | 0.295 | 5.232 | 0.000 |
| HDL-C | Body mass index | -0.044 | 0.009 | -0.265 | -4.755 | 0.000 |
| Alcohol consumption | 0.117 | 0.032 | 0.206 | 3.688 | 0.000 | |
| LDL-C | Body mass index | 0.040 | 0.015 | 0.155 | 2.657 | 0.008 |
| ApoAI | Alcohol consumption | 0.129 | 0.026 | 0.277 | 4.899 | 0.000 |
| ApoB | Pulse pressure | 0.009 | 0.003 | 0.220 | 3.655 | 0.000 |
| Age | -0.006 | 0.003 | -0.138 | -2.300 | 0.022 | |
| ApoAI/ApoB | Waist circumference | -0.017 | 0.005 | -0.206 | -3.628 | 0.000 |
| Alcohol consumption | 0.145 | 0.045 | 0.182 | 3.200 | 0.002 | |
| Mulao/female | ||||||
| TC | Age | 0.016 | 0.004 | 0.208 | 3.941 | 0.000 |
| Body mass index | 0.056 | 0.019 | 0.155 | 2.934 | 0.004 | |
| TG | Body mass index | 0.067 | 0.013 | 0.265 | 5.039 | 0.000 |
| HDL-C | Body mass index | -0.033 | 0.007 | -0.258 | -4.899 | 0.000 |
| LDL-C | Body mass index | 0.059 | 0.014 | 0.218 | 4.216 | 0.000 |
| Age | 0.013 | 0.003 | 0.235 | 4.541 | 0.000 | |
| ApoB | Waist circumference | 0.013 | 0.003 | 0.207 | 3.922 | 0.000 |
| Glucose | 0.041 | 0.019 | 0.117 | 2.159 | 0.032 | |
| Age | 0.004 | 0.002 | 0.114 | 2.114 | 0.035 | |
| ApoAI/ApoB | Waist circumference | -0.019 | 0.006 | -0.179 | -3.369 | 0.001 |
| Age | -0.009 | 0.003 | -0.160 | -3.007 | 0.003 |
TC: total cholesterol; TG: triglyceride; HDL-C: high-density lipoprotein cholesterol; LDL-C: low-density lipoprotein cholesterol; ApoAI: Apolipoprotein AI; ApoB: Apolipoprotein B.
Discussion
Disorder of lipid metabolism is strongly associated with CVD [5-11]. It is well recognized that dyslipidemia is a complex trait caused by multiple genetic and environmental factors and their interactions [12-14,26]. Many literatures suggest that about 40-60% of the variation in serum lipid profiles is genetically determined [16,27]. The prevalence of dyslipidemia continues to increase worldwide, not only causing serious personal health problems but also imposing a substantial economic burden on societies [28,29]. Therefore, it is very important to understand and control the risk factors of dyslipidemia in some populations.
Little is known about the association between the MARS rs6782181 polymorphism and serum lipid levels. Alshahid et al. [19] reported that the rs6782181GG genotype was associated with the risk of obesity, hypercholesterolemia, hypertriglyceridemia and low HDL-C levels in the Saudi population. In the current study, we showed that the MARS rs6782181 SNP was associated with high serum TC, TG, LDL-C, and ApoB levels in Han, and higher serum TC and LDL-C levels in Mulao than the subjects with AA/AG genotypes. Subgroup analyses showed that these results were found only in males but not in females in both ethnic groups. The subjects with GG genotype in Han had higher TC, TG, HDL-C, LDL-C, ApoAI and ApoB in males, but lower ApoAI and the ratio of ApoAI to ApoB in females than the subjects with AG/AA genotypes. The subjects with GG genotype in Mulao had higher LDL-C levels in males but not in females than the subjects with AG/AA genotypes. These results suggested that the prevalence of the MARS rs6782181 SNP may have racial/ethnic and/or sex specificity. For Mulao nationality, one of the 55 minorities with population of 207,352 according to the fifth national census statistics of China in 2000, some particular customs must be considered. Firstly, the majority of the people live in Guangxi Zhuang Autonomous Region, People’s Republic of China, which are characterized by agriculture economy, and its inhabitants show similar life styles as well as eating habits, they prefer to eat cold foods along with acidic and spicy dishes, local bean soy sauce, pickled vegetables and animal offal’s which contain abundant saturated fatty acid. Secondly, there was a strict intra-ethnic marriage in Mulao society, the engagements were family arranged in childhood, usually with the girl being four or five years older than the boy. There was a preference for marriage to mother’s brother’s daughter. Therefore, for the relatively conservative and isolated minority in China, we believe that the genetic background and some lipid-associated genetic variants in this population may be different from those in Han nationality. The above evidence may partly explain the discrepancies of MARS polymorphism and serum lipid levels in Han and Mulao populations.
The reason for these conflicting results is not yet known, probably because of differences in the study population, experiment designs, sample size, and the methods used to measure serum lipid levels. Different racial/ethnic groups have different genetic background or the MARS rs6782181 SNP had a linkage disequilibrium with the other genes. Furthermore, environmental factors were also positively correlated with serum lipid levels [12-14]. In the present study, we showed that serum lipid parameters were associated with age, sex, alcohol consumption, cigarette smoking, BMI, and blood pressure in both ethnic groups. These findings suggest that the environmental factors play a key role in determining serum lipid levels in our study populations.
There are several potential limitations in our study. Firstly, the sample size may be not big enough. Secondly, despite we have detected the association of MARS rs6782181 SNP and serum lipid levels in this study, there are still many unmeasured genetic and environmental factors. Thirdly, the interactions of gene-gene, gene-environment, and environment-environment were not studied in the present investigation. Therefore, further studies with large sample size, especially with the consideration of gene-gene and gene-environment interactions, will be needed to confirm our findings.
In conclusion, this study showed that the association of the MARS rs6782181 SNP and serum lipid levels is different between the Mulao and Han populations, or between males and females in the both ethnic groups. There may be an ethnic- and/or sex-specific association between the MRAS rs6782181 SNP and serum lipid levels in our study populations. But further studies with large sample size are needed to confirm our findings.
Acknowledgements
This study was supported by the National Natural Science Foundation of China (No: 30960130).
Disclosure of conflict of interest
None.
References
- 1.Roberts R, Stewart AF. Genes and coronary artery disease: where are we? J Am Coll Cardiol. 2012;60:1715–1721. doi: 10.1016/j.jacc.2011.12.062. [DOI] [PubMed] [Google Scholar]
- 2.Satoh H, Nishino T, Tomita K, Tsutsui H. Fasting triglyceride is a significant risk factor for coronary artery disease in middle-aged Japanese men: Results from a 10-year cohort study. Circ J. 2006;70:227–231. doi: 10.1253/circj.70.227. [DOI] [PubMed] [Google Scholar]
- 3.Arai H, Yamamoto A, Matsuzawa Y, Saito Y, Yamada N, Oikawa S, Mabuchi H, Teramoto T, Sasaki J, Nakaya N, Itakura H, Ishikawa Y, Ouchi Y, Horibe H. Serum lipid survey and its recent trend in the general Japanese population in 2000. J Atheroscler Thromb. 2005;12:98–106. doi: 10.5551/jat.12.98. [DOI] [PubMed] [Google Scholar]
- 4.Hokanson JE, Austin MA. Plasma triglyceride level is a risk factor for cardiovascular disease independent of high-density lipoprotein cholesterol level: a meta-analysis of population- based prospective studies. J Cardiovasc Risk. 1996;3:213–219. [PubMed] [Google Scholar]
- 5.Shekelle RB, Shryock AM, Paul O, Lepper M, Stamler J, Liu S, Raynor WJ Jr. Diet, serum cholesterol, and death from coronary heart disease. The Western Electric study. N Engl J Med. 1981;304:65–70. doi: 10.1056/NEJM198101083040201. [DOI] [PubMed] [Google Scholar]
- 6.Gordon DJ, Rifkind BM. High-density lipoprotein--the clinical implications of recent studies. N Engl J Med. 1989;321:1311–1316. doi: 10.1056/NEJM198911093211907. [DOI] [PubMed] [Google Scholar]
- 7.Burnett JR. Lipids, lipoproteins, atherosclerosis and cardiovascular disease. Clin Biochem Rev. 2004;25:2. [PMC free article] [PubMed] [Google Scholar]
- 8.März W, Scharnagl H, Winkler K, Tiran A, Nauck M, Boehm BO, Winkelmann BR. Low-density lipoprotein triglycerides associated with low-grade systemic inflammation, adhesion molecules, and angiographic coronary artery disease: the Ludwigshafen Risk and Cardiovascular Health study. Circulation. 2004;110:3068–3074. doi: 10.1161/01.CIR.0000146898.06923.80. [DOI] [PubMed] [Google Scholar]
- 9.Olivecrona G, Olivecrona T. Triglyceride lipases and atherosclerosis. Curr Opin Lipidol. 2010;21:409–415. doi: 10.1097/MOL.0b013e32833ded83. [DOI] [PubMed] [Google Scholar]
- 10.Takahashi R, Taguchi N, Suzuki M, Cheng XW, Numaguchi Y, Tsukamoto H, Ikeda N, Murohara T, Okumura K. Cholesterol and triglyceride concentrations in lipoproteins as related to carotid intima-media thickness. Int Heart J. 2012;53:29–34. doi: 10.1536/ihj.53.29. [DOI] [PubMed] [Google Scholar]
- 11.Idei M, Hirayama S, Miyake N, Kon M, Horiuchi Y, Ueno T, Miyake K, Satoh N, Yoshii H, Yamashiro K, Onuma T, Miida T. Mean postprandial triglyceride concentration is an independent risk factor for carotid atherosclerosis in patients with type 2 diabetes. Clin Chim Acta. 2014;430:134–139. doi: 10.1016/j.cca.2013.12.022. [DOI] [PubMed] [Google Scholar]
- 12.Ordovas JM, Shen AH. Genetics, the environment, and lipid abnormalities. Curr Cardiol Rep. 2002;4:508–513. doi: 10.1007/s11886-002-0115-4. [DOI] [PubMed] [Google Scholar]
- 13.Ordovás JM, Robertson R, Cléirigh EN. Gene-gene and gene-environment interactions defining lipid-related traits. Curr Opin Lipidol. 2011;22:129–136. doi: 10.1097/MOL.0b013e32834477a9. [DOI] [PubMed] [Google Scholar]
- 14.Chaput JP, Pérusse L, Després JP, Tremblay A, Bouchard C. Findings from the Quebec Family Study on the Etiology of Obesity: Genetics and Environmental Highlights. Curr Obes Rep. 2014;3:54–66. doi: 10.1007/s13679-013-0086-3. [DOI] [PMC free article] [PubMed] [Google Scholar]
- 15.Elbers CC, Guo Y, Tragante V, van Iperen EP, Lanktree MB. Gene-centric meta-analysis of lipid traits in African, East Asian and Hispanic populations. PLoS One. 2012;7:e50198. doi: 10.1371/journal.pone.0050198. [DOI] [PMC free article] [PubMed] [Google Scholar]
- 16.Heller DA, de Faire U, Pedersen NL, Dahlén G, McClearn GE. Genetic and environmental influences on serum lipid levels in twins. N Engl J Med. 1993;328:1150–1156. doi: 10.1056/NEJM199304223281603. [DOI] [PubMed] [Google Scholar]
- 17.Iliadou A, Lichtenstein P, de Faire U, Pedersen NL. Variation in genetic and environmental influences in serum lipid and apolipoprotein levels across the lifespan in Swedish male and female twins. Am J Med Genet. 2001;102:48–58. doi: 10.1002/1096-8628(20010722)102:1<48::aid-ajmg1388>3.0.co;2-4. [DOI] [PubMed] [Google Scholar]
- 18.Pérusse L, Rice T, Després JP, Bergeron J, Province MA, Gagnon J, Leon AS, Rao DC, Skinner JS, Wilmore JH, Bouchard C. Familial resemblance of plasma lipids, lipoproteins and postheparin lipoprotein and hepatic lipases in the HERITAGE Family Study. Arterioscler Thromb Vasc Biol. 1997;17:3263–3269. doi: 10.1161/01.atv.17.11.3263. [DOI] [PubMed] [Google Scholar]
- 19.Alshahid M, Wakil SM, Al-Najai M, Muiya NP, Elhawari S, Gueco D, Andres E, Hagos S, Mazhar N, Meyer BF, Dzimiri N. New susceptibility locus for obesity and dyslipidaemia on chromosome 3q22.3. Hum Genomics. 2013;7:15. doi: 10.1186/1479-7364-7-15. [DOI] [PMC free article] [PubMed] [Google Scholar]
- 20.Watanabe-Takano H, Takano K, Keduka E, Endo T. M-Ras is activated by bone morphogenetic protein-2 and participates in osteoblastic determination, differentiation, and transdifferentiation. Exp Cell Res. 2010;316:477–490. doi: 10.1016/j.yexcr.2009.09.028. [DOI] [PubMed] [Google Scholar]
- 21.Erdmann J, Grosshennig A, Braund PS, König IR, Hengstenberg C. New susceptibility locus for coronary artery disease on chromosome 3q22.3. Nat Genet. 2009;41:280–282. doi: 10.1038/ng.307. [DOI] [PMC free article] [PubMed] [Google Scholar]
- 22.Ellis KL, Frampton CM, Pilbrow AP, Troughton RW, Doughty RN, Whalley GA, Ellis CJ, Skelton L, Thomson J, Yandle TG, Richards AM, Cameron VA. Genomic risk variants at 1p13.3, 1q41, and 3q22.3 are associated with subsequent cardiovascular outcomes in healthy controls and in established coronary artery disease. Circ Cardiovasc Genet. 2011;4:636–646. doi: 10.1161/CIRCGENETICS.111.960336. [DOI] [PubMed] [Google Scholar]
- 23.Li Q, Yin RX, Wei XL, Yan TT, Aung LH, Wu DF, Wu JZ, Lin WX, Liu CW, Pan SL. ATP-binding cassette transporter G5 and G8 polymorphisms and several environmental factors with serum lipid levels. PLoS One. 2012;7:e37972. doi: 10.1371/journal.pone.0037972. [DOI] [PMC free article] [PubMed] [Google Scholar]
- 24.People’s Republic of China-United States Cardiovascular and Cardiopulmonary Epidemiology Research Group. An epidemiological study of cardiovascular and cardiopulmonary disease risk factors in four populations in the People’s Republic of China. Baseline report from the P.R.C.-U.S.A. Collaborative Study. Circulation. 1992;85:1083–1096. doi: 10.1161/01.cir.85.3.1083. [DOI] [PubMed] [Google Scholar]
- 25.Guidelines Subcommittee. 1999 World Health Organization-International Society of Hypertension Guidelines for the Management of Hypertension. J Hypertens. 1999;17:151–183. [PubMed] [Google Scholar]
- 26.Dumitrescu L, Carty CL, Taylor K, Schumacher FR, Hindorff LA. Genetic determinants of lipid traits in diverse populations from the population architecture using genomics and epidemiology (PAGE) study. PLoS Genet. 2011;7:e1002138. doi: 10.1371/journal.pgen.1002138. [DOI] [PMC free article] [PubMed] [Google Scholar]
- 27.Pilia G, Chen WM, Scuteri A, Orrú M, Albai G, Dei M, Lai S, Usala G, Lai M, Loi P, Mameli C, Vacca L, Deiana M, Olla N, Masala M, Cao A, Najjar SS, Terracciano A, Nedorezov T, Sharov A, Zonderman AB, Abecasis GR, Costa P, Lakatta E, Schlessinger D. Heritability of cardiovascular and personality traits in 6,148 Sardinians. PLoS Genet. 2006;2:e132. doi: 10.1371/journal.pgen.0020132. [DOI] [PMC free article] [PubMed] [Google Scholar]
- 28.Schultz AB, Chen CY, Burton WN, Edington DW. The burden and management of dyslipidemia: practical issues. Popul Health Manag. 2012;15:302–308. doi: 10.1089/pop.2011.0081. [DOI] [PubMed] [Google Scholar]
- 29.Smith DG. Epidemiology of dyslipidemia and economic burden on the healthcare system. Am J Manag Care. 2007;3:S68–71. [PubMed] [Google Scholar]