

Abstract
Aberrant microRNA (miRNA) expression has been identified in various human solid cancers. However, whether the levels of miRNA expression in tumor cells have any effect on tumor progression has not been determined. In this proof-of-concept study, the restoration of high-level expression of the miR-17~92 cluster of miRNAs reveals its function as a tumor suppressor in murine solid cancer cells. Specifically, genetically engineered expression of higher levels of miR-17/20a in the miR-17~92 cluster in both murine breast cancer and colon cancer cells triggered natural killer (NK) cell recognition by inhibiting the expression of MHC class I (H-2D) through the Mekk2/Mek5/Erk5 pathway. Results from the mouse tumor studies were recapitulated using samples of human solid tumors. Together, these data indicate that miR-17/20amiRnas functions as a tumor suppressor by reprogramming tumor cells for NK cell-mediated cytotoxicity.
Keywords: miR-17/20a, miR-17~92 cluster, MHC class I, Mekk2/Erk5 pathway, colon cancer, breast cancer, NK cell tumor cytotoxicity
Introduction
MicroRNAs (miRNAs) are known to play key regulatory roles in physiological processes including cell differentiation, apoptosis, proliferation, metabolism, organ development, and tumor progression (1-4). Aberrant expression of miRNAs is a common feature in hematologic malignancies (5, 6) and solid cancers (7, 8), suggesting a potential role for miRNAs in cancer. It has been proposed that miRNAs function as integral parts of the molecular architecture of oncogene and tumor-suppressor networks (9). Although a small, specific subset of oncogenic miRNAs is upregulated in cancer, the expression and processing of most of these regulators are downregulated during tumorigenesis (10-12).
The miR-17~92 cluster produces a single polycistronic primary transcript that is processed to yield 6 individual mature miRNAs including miR-17, miR-18a, miR-19a, miR-20a, miR-19b, and miR-92a (13). There is evidence indicating that the miR-17~92 cluster inhibits tumor-cell proliferation and invasion in human solid cancers including breast cancer (14), hepatomas (15), and gastrointestinal stromal tumors (16). However, there are also studies supporting a role for miR-19a,b in promoting tumorigenesis in hematologic malignancies including B-cell lymphomas (5, 17). The molecular mechanisms underlying the miR-17~92 cluster-mediated pro- or anti-tumorigenic effects are not fully understood.
We hypothesize that miRNAs play dual regulatory roles in cancer progression—depending on their expression levels in tumor cells, miRNAs could be either pro-tumorigenic or anti-tumorigenic. To test this hypothesis, we employed a novel approach, restoring the expression levels of miRNAs in tumor cells to the same levels as those in the corresponding adjacent non-tumor tissue. The outcome of this approach could provide a rationale to investigate the therapeutic potential of using miRNAs to treat human cancers.
In this study, we demonstrate that as the expression level of the miR-17~92 cluster reached the level found in adjacent non-tumor cells, the miR-17~92 cluster serves as a tumor suppressor in the tumor cells. Specifically, we have delineated a potential mechanism by which miR-17/20a functions as a tumor suppressor—it mediates the inhibition of the Mekk2-regulated pathways leading to the down-regulation of MHC class I (H-2D) molecules expressed on tumor cells, and enhances the antitumor activity of natural killer (NK) cells.
Materials and Methods
Clinical Specimens
Human breast and colorectal specimens (primary lesion and adjacent normal) were collected at the time of surgery. All samples were collected with written informed consent from the patients, and the experiments were performed with the approval from the Institute Research Ethics Committee of Nanjing Medical University.
Reagents, Cell lines, and Plasmids
All cell lines were obtained from the American Type Culture Collection (ATCC, Manassas, VA, USA). Mouse CT26 and CMT-93 colon cancer cell lines were maintained in RPMI1640 (Invitrogen, Carlsbad, CA, USA), supplemented with 10% fetal bovine serum (Invitrogen, Carlsbad, CA, USA). Mouse 4T1 and 4TO7 breast cancer cell lines were maintained in DMEM (Invitrogen, Carlsbad, CA, USA), supplemented with 10% fetal bovine serum (Invitrogen, Carlsbad, CA, USA). All cell lines were tested regularly for potential mycoplasma contamination using a PCR-based assay and validated to be mycoplasma-free. No other authentication assays were performed.
To generate cell lines stably expressing the miR-17~92 cluster miRNAs, mouse cancer cells were seeded into 6-well plates, cultured overnight, and then transfected with the following expression vectors: MSCV-PIG-miR-Ctrl, MSCV-PIG-miR-17~92 WT, MSCV-ΔPIG-miR-17/20a, MSCV-ΔPIG-miR-18a, MSCV-ΔPIG-miR-19a,b, MSCV-ΔPIG-miR-92a, (MSCV-PIG is MSCV-Puro-IRES-GFP, kindly provided by Dr. Andrea Ventura, Memorial Sloan-Kettering Cancer Center, New York, ref. (5). Six hours after transfection, cells were returned to regular culture media containing 7.5 μg/mL puromycin (CT26) or 5 μg/mL puromycin (4T1) (Sigma, St. Louis, MO, USA). Two weeks after drug selection, GFP+ cells were sorted using a FACSAria™ II Flow Cytometer (BD Biosciences, San Jose, CA, USA) and then seeded into 96-well plates for monoclonal selection by serial dilution. pEh-Mekk2-YFP was kindly provided by Dr. Brian C. Schaefer (Uniformed Services University of the Health Sciences, Maryland, USA) (18). pGL3-B250 and pGL3-β2m were kindly donated by Dr. Peter J. van den Elsen (Leiden University Medical Centre, Leiden, The Netherlands) (19). ShNC and shMekk2 were purchased from Santa Cruz Biotechnology (Santa Cruz, CA, USA). pLV-miRNA vector and pLV-hsa-miR-17/20a were purchased from Biosettia (San Diego, CA, USA). psiCHECK2 vector was purchased from Promega (Madison, WI, USA).
Plasmid Construction
To construct psiCHECK2-Map3k2-3’UTR-WT, the Xho I - Not I 3’-UTR (Map3k2) fragment was PCR-amplified from CT26 genomic DNA, which contained two miR-17/20a binding sites, using the following primers: Forward: 5’ CCGCTCGAG(Xho I) CGGCAGCGGCGGCTTCGGTCC 3’; Reverse: 5’ TAAAGCGGCCGC(Not I)AAATCTTTCTATATTCCA 3’. The PCR cycle consisted of an initial step of 95°C for 3 minutes, followed by 30 cycles of 95°C for 1 minute, 51°C for 30s, and 72°C for 30s, followed by an elongation step of 72°C for 7 minutes. The wild-type Map3k2-3’-UTR was then inserted downstream from a Renilla luciferase reporter psiCHECK2 (Xho I and Not I sites; Promega, Madison, WI, USA). Map3k2-3’UTR-WT (+0 ~ +325 bp): 5’ ccgCTCGAGcgg(XhoI)CAGCGGCGGCTTCGGTCCTCCACCAGCTCCATCCTCGCGGCCACCTTCTCTCTTACTGCACTTT(miR-17/20a binding site1)CCTTTTTTATAAAAAAGAGAGATGGGGAGAAAAAGACAAGAGGGAAAATATTTCTCTTGATTCTTGGttaaatttgtttaataataatagtaaactaaattttttatatttaatctttttttCTTTACAAGAACTTGAAACTTCTTTTCTTTTTTTTAAAAGATTTTTATAATGTACTGATGTGGTTCAGAGCTATAAAGCACTTT(miR-17/20a binding site1)AGTACATAGTTGCTCCTTTTAGTACAAACAAATCATTTGGAATATAGAAAGATTatttGCGGCCGCttta 3’(Not I)
Mouse Models
To generate mouse tumor models, 1×10⁵ colon tumor cells were injected subcutaneously (s.c.) per mouse. Tumors were measured with a caliper, and tumor volumes were calculated using the formula length × width2 and presented as the mean ± SD. To generate a mouse tumor metastasis model, 1×10⁶ tumor cells per mouse were injected intravenously via the tail-vein. To generate a mouse model of breast cancer, 5×10⁴ 4T1 tumor cells per mouse were orthotopically injected into the mammary fat pads. Female BALB/c mice, C.B-17/SCID (CB17-Prkdcscid/J) mice and NSG (NOD-scid IL2Rg-/-) mice were purchased from the Jackson Laboratory (Bar Harbor, ME, USA). All animal studies were performed in accordance with protocols approved by the University of Louisville Institutional Animal Care and Use Committee (Louisville, KY, USA).
Immune-cell depletion
Groups of BALB/c mice were depleted of specific immune-cell populations. Briefly, for NK-cell depletion, BALB/c mice were injected i.p. with 50 μg of anti-asialo-GM1 Ab (eBioscience, San Diego, CA, USA) for 3 consecutive days beginning 5 days before implantation of tumor cells and continued every 3 days thereafter for the duration of the experiment. NK-cell depletion was confirmed by FACS analysis.
In Vivo Imaging of Tumor Metastasis
To monitor tumor cell metastasis in vivo, tumor cell lines were first labeled with a near-infrared lipophilic carbocyanine dye-dioctadecyl-tetramethylindotricarbocyanine iodide (DiR, Invitrogen, Carlsbad, CA, USA). Cells were incubated with the DiR dye (1×10⁷ cells in 10-ml 1X phosphate buffered saline (PBS) containing 3.5 μg/ml dye and 0.5% ethanol) for 30 minutes at 37°C (20). Thereafter, cells were washed twice with PBS and the viability of labeled cells was verified by trypan blue staining. Each mouse received 1×10⁶ DiR labeled tumor cells administered intravenously via the tail-vein. Mice were then imaged at scheduled time points using a Carestream Molecular Imaging system (Carestream Health, Woodbridge, CT, USA).
Real-Time PCR
Total RNA was isolated from tumor tissues or cells using RNeasy Mini Kit (Qiagen, Frederick, MD, USA). Quantitative real-time PCR (qRT-PCR) analysis of the mature miR-17~92 cluster in tumor tissues was performed using a Bulge-Loop™ miRNA qPCR system (Guangzhou RiboBio Co., Ltd, Guangzhou, China). Relative quantification of selected mRNA and pre-miR-17~92 was performed using a CFX96 Realtime System (Bio-Rad Laboratories, Hercules, CA, USA) and SsoFast EvaGreen Supermix (Bio-Rad Laboratories, Hercules, CA, USA), according to the manufacturers’ instructions. All primers were obtained from Eurofins MWG Operon (Huntsville, AL, USA). Expression values were normalized to cell number. PCRs for murine Gapdh were performed as positive controls. Sequences of the primers are listed as follows: pre-mmu-miR-17 fwd: 5’- CGGGTCAGAATAATGTCAA -3’, pre-mmu- miR-17 rev: 5’-CCGTCAGCATAATGCTACAA-3’; pre-mmu-miR-18a fwd: 5’-CGTGCGTGCTTTTTGTTCTAAGG-3’, pre-mmu-miR-18a rev: 5’-GCCGACATAACTTCTTATGCC-3’; pre-mmu-miR-19a fwd: 5’-CGCAGCCCTCTG TTAGTTT-3’, pre-mmu-miR-19a rev: 5’-AGCAGGCCACCATCAGTT-3’; pre-mmu-miR-19b fwd: 5’-GCACTGGTCTATGGTTAGTTT-3’, pre-mmu-miR-19b rev: 5’-ACACCACCACAGTCAGTTT-3’; pre-mmu-miR-20a fwd: 5’-CGGTGTGATGTGACAGCTT-3’, pre-mmu-miR-20a rev: 5’-TCGCCCTGGAGTTCTAC-3’; pre-mmu-miR-92a fwd: 5’-GGCTTTCTACACAGGTTGG-3’, pre-mmu-miR-92a rev: 5’-CTCAACAGGCCGGGACAA-3’; β-actin fwd: 5’-GATCTGGCACCACACCTTCT-3’, β-actin rev 5’-GGGGTGTTGAAGGTCTCAAA-3’; Gapdh fwd: 5’-GTTGTCTCCTGCGACTTCA-3’, Gapdh rev: 5’-GGTGGTCCAGGGTTTCTTA-3’.
Western Blotting
Western blots were performed as described previously (21). All primary antibodies (anti-Gapdh, anti-β-actin, anti-Mekk2, anti-p-Mek5, anti-Mek5, anti-p-Erk5, and anti-Erk5) were purchased from Santa Cruz Biotechnology (Santa Cruz, CA, USA). Blotted membranes were developed with the Odyssey imager (LiCor Inc., Lincoln, NE, USA).
Flow Cytometry
Cell lines were digested and centrifuged at 800x g and cell pellets were resuspended in FACS buffer (PBS, 1% BSA, 0.1% EDTA). Cells were pretreated with the FcγR-blocking mAb (eBioscience, San Diego, CA, USA) on ice for 10 minutes, followed by treatment with anti-mouse MHC class I (H-2D/H-2K, eBioscience, San Diego, CA, USA) or H-2D mAb (BioLegend, San Diego, CA, USA) on ice for 30 minutes. Whole tumor, lung or liver from each mouse was minced and digested for 30 minutes at 37°C in the presence of 30 μg/ml collagenase mix (Blenzyme) in HBSS. Completely digested tissues were centrifuged at 800x g and pellets were resuspended in FACS buffer (PBS, 1% BSA, 0.1% EDTA). Cells were pretreated with the FcγR-blocking mAb, followed by incubation on ice for 30 minutes with antibodies against DX5, CD3, CD4, CD8, F4/80, CD11c, CD11b, Gr-1, Perforin, Granzyme B, or IFN-γ (eBioscience, San Diego, CA, USA). All samples were analyzed with the Accuri C6 Flow Cytometer System (Accuri Cytometers, Ann Arbor, MI, USA). After an initial gating on forward-versus-side scatter plots, cell populations were gated on all viable leukocytes. Subsets of populations were defined using antibodies against DX5, CD3, CD4, CD8, F4/80, CD11c, CD11b, or Gr-1. Intracellular-labeled cells were pretreated for intracellular staining (eBioscience, San Diego, CA, USA). Data were analyzed using FlowJo FACS software (Treestar, Inc., San Carlos, CA).
Luciferase Assays
5×10⁴ CT26 cells were seeded into individual wells of a 24-well plate, cultured overnight, and then transfected with Renilla luciferase constructs together with different doses of 20 μM miRNA mimics (miScript miRNA Mimic, Qiagen, Chatsworth, CA, USA) for mmu-miR-17 and/or mmu-miR-20a mimics using Lipofectamine 2000 (Invitrogen). After 24 hours of incubation, Renilla luciferase activities were evaluated using the Dual-Luciferase Reporter Assay system (Cat#1910, Promega, Madison, WI, USA). For MHC I promoter reporter assay, 5×10⁴ CT26 cells, miR-Ctrl or miR-17~92 cells were seeded into individual wells of a 24-well plate, cultured overnight, and then transfected with MHC I promoter reporters, pGL3-B250 or pGL3-β2m, or together with plasmids encoding pre-miR-17/20a or/and Mekk2, or together with plasmids encoding shMekk2 or/and Mekk2 using Lipofectamine 2000 (Invitrogen, Carlsbad, CA, USA). After 24 hours of incubation, luciferase activities were evaluated using the Luciferase Reporter Assay system (Cat#E1500, Promega, Madison, WI, USA).
Cytotoxicity Assay
DX5+ or DX5- effector cells were purified from mouse spleens using MACS sorting as described (22). Splenic leukocytes were stained with biotinylated anti-DX5 (eBioscience, San Diego, CA, USA) followed by incubation with anti-PE streptavidin MACS beads. Thereafter, DX5+ or DX5- cells were isolated by magnetic cell sorting using the MACS system (Miltenyi Biotec, Bergisch Gladbach, Germany). To determine NK-cell cytotoxicity in vitro, target cells were digested and washed three times, and adjusted to 1 × 10⁵ cells/mL. Serially diluted splenic leukocytes or purified DX5 positive/negative cells were mixed with target cells at various effector:target (E:T) ratios and incubated for 3 hour at 37°C. Cells were harvested and stained with anti-PI antibody (eBioscience, San Diego, CA, USA). Thereafter, GFP+ PI- subsets were analyzed with the Accuri C6 Flow Cytometer System (Accuri Cytometers, Ann Arbor, MI, USA). Data were analyzed using FlowJo FACS software (Treestar, Inc., San Carlos, CA).
Immunohistochemistry
Immunohistochemistry was performed on formalin fixed, paraffin embedded tissue sections. Serial 4 μm sections were stained with hematoxylin and eosin (H&E) for morphological analysis. For tissue immunofluorescence staining, slides were washed three times (5 minutes each) with PBST (PBS, 0.1% Tween 20). Tissues were permeabilized by incubating the slides in 1% Triton X-100 in PBS at 25°C for 15 minutes and then washed three times in PBST. After blocking for 1 hour at 25°C in blocking buffer (PBS containing 10% BSA), slides were incubated overnight in a humidity chamber with anti-mouse/human antibodies. Antibodies were diluted 1:50 in blocking buffer. The following antibodies were used: anti-DX5-PE, anti-CD4-PE, anti-CD8-PE, anti-F4/80-PE, anti-Gr-1-PE, anti-CD11c-PE, anti-MHC class I-PE (BD Biosciences, San Jose, CA, USA), anti-Mekk2, and anti-p-Erk5 antibodies (Santa Cruz Biotechnology, Santa Cruz, CA, USA). Following another three PBST washes, slides were incubated with Alexa 594-conjugated or Alexa 647-conjugated goat anti-mouse/rabbit secondary antibody at a 1:500 dilution (Molecular Probes, Eugene, OR, USA). Slides were then washed and nuclei counterstained with DAPI. For cell immunofluorescence staining, cell lines were seeded into a chamber slide (Lab-Tek™ II Chamber Slide™ System, Thermo Fisher Scientific, San Jose, CA, USA) and cultured overnight. Slides were then processed as described previously for tissue immunofluorescence staining.
Results
Restoration of the expression levels of the miR-17~92 cluster inhibits the growth of solid tumor in immunocompetent but not in immunodeficient mice
To address the potential role of the miR-17~92 cluster in regulating tumor progression, we analyzed the expression pattern of this cluster in human colon tumor tissues. Expression levels of the miR-17~92 cluster in human adjacent non-tumor colon tissues were almost 50-fold higher than those in the highly metastatic tumor tissues (Supplementary Fig. S1A). To determine whether the expression levels of miR-17~92 correlate with tumor progression, we analyzed the potential correlation between the expression levels of the miR-17~92 cluster and the metastatic capacity in mouse colon and breast cancers. We found that the expression levels of the miR-17~92 cluster were significantly lower in CT26 and 4T1 cancer cells with higher metastatic capacity (Supplementary Fig. S1B) than in the non-metastatic CMT-93 colon cancer and 4T07 breast cancer cells.
To determine whether restoring the expression levels of the miR-17~92 cluster has an impact on tumor growth we stably transfected CT26 cells with PIG-miR-17~92, an expression vector encoding the miR17~92 cluster miRNAs (Supplementary Fig. S1C). We generated subclones of transfected CT26 cells expressing high levels of the miR-17~92 cluster (CT26/miR-17~92) that are close to the levels expressed in the adjacent non-tumor tissue. After implantation into BALB/c mice, the CT26/miR-17~92 tumor cells grew much slower than the CT26/miR-Ctrl cells (Fig. 1A upper). In contrast, when the transfected tumor cells were subcutaneously injected into NSG mice (NOD-scid IL2Rg-/-, NK and T cells-null immunodeficient mice), no significant difference in the growth of the tumor cells was observed (Fig. 1A lower). This result was replicated using the 4T1 mouse breast cancer cells (Fig. 1B). In summary, when compared to that of the miR-Ctrl expression of the miR-17~92 cluster significantly inhibited the growth of tumor cells in immunocompetent mice but not in immunodeficient mice lacking NK and T cells, indicating that higher levels of the miR-17~92 cluster increase the sensitivity of tumor cells to attack by the host’s immune cells.
Figure 1. MiR-17/20a inhibits tumor growth in vivo.
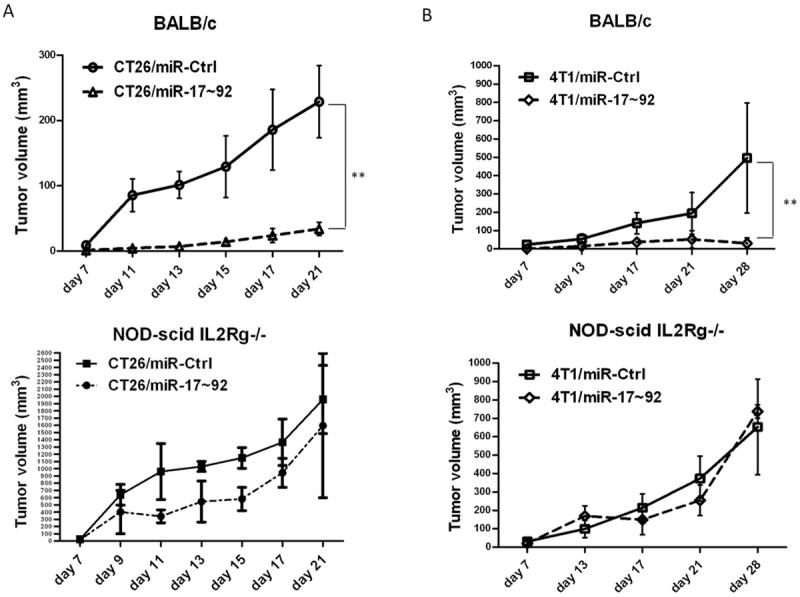
(A) Growth curves of control (miR-Ctrl) and miR-17~92 cluster (miR-17~92) tumors by subcutaneous injection of CT26/miR-Ctrl and CT26/miR-17~92 monoclonal cells into BALB/c mice (upper panel) or NOD-scid IL2Rg-/- mice (lower panel 5 mice per group). Error bars represent standard deviation (±SD) (two-way ANOVA; ** p<0.01). (B) Growth curves of control (miR-Ctrl) and miR-17~92 cluster (miR-17~92) tumors by orthotopical injection of 4T1/miR-Ctrl and 4T1/miR-17~92 monoclonal cells into the mammary fat pads in BALB/c mice (upper panel) or NOD-scid IL2Rg-/- mice (lower panel 5 mice per group). Error bars represent standard deviation (±SD) (two-way ANOVA; ** p<0.01).
Recruitment and activation of NK cells through down-regulation of MHC class I molecules expressed on tumor cells by miR-17~92
To determine which subset of the host’s immune cells plays crucial roles in the prevention/elimination of tumor growth, we analyzed tumor-infiltrating immune cells in the 4T1 breast and CT26 colon tumors. There was a significant increase in the number of DX5+ CD3- IFN-γ+ NK cells infiltrating the 4T1/miR-17~92 tumors and CT26/miR-17~92 tumors when compared to miR-Ctrl tumors (Fig. 2A and 2B). Furthermore, when compared to that of the miR-Ctrl, the expression of the miR-17~92 cluster (CT26/miR-17~92) resulted in significant inhibition of tumor growth in T cell-deficient but not in NK cell-sufficient C.B-17/SCID mice (data not shown). We used anti-asialo-GM1 antibodies to deplete NK cells in BALB/c mice to assess the role of NK cells on tumor growth in vivo. Anti-asialo-GM1 antibody-mediated depletion of NK cells in CT26/miR-17~92 tumor-bearing mice led to a significant increase in tumor growth in comparison with CT26/miR-17~92 tumor-bearing mice injected with a control isotype IgG antibody (Fig. 2C), suggesting that NK cells play critical roles in the miR-17~92-mediated suppression of tumor growth in vivo. These results also suggest that high levels of miR-17~92 are required for NK cell-mediated inhibition of tumor growth since there was no difference in tumor growth in CT26/miR-Ctrl tumor-bearing mice treated with NK cell-depletion antibody or a control isotype IgG antibody (Fig. 2C).
Figure 2. NK cells play critical roles in the suppression of murine breast and colon tumor growth in vivo.
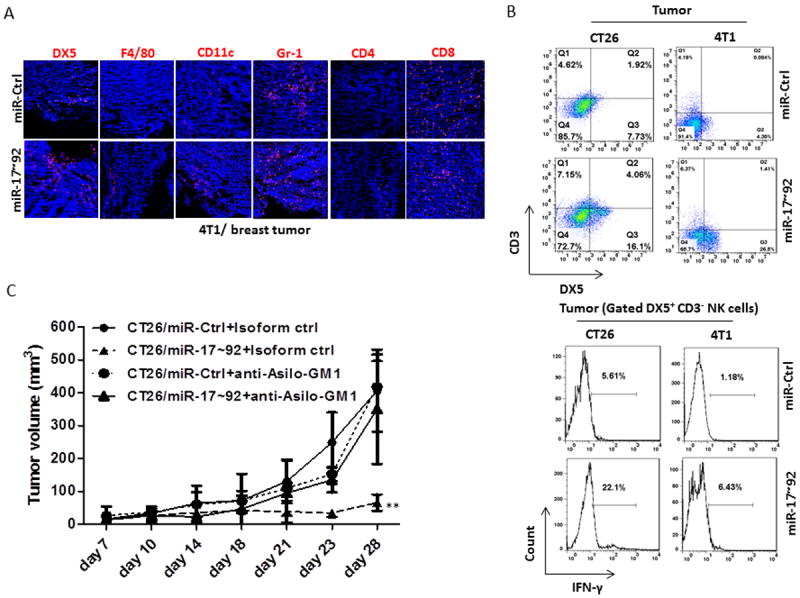
(A) Immunofluorescent staining showing DX5+, F4/80+, CD11c+, Gr-1+, CD4+, and CD8+ immune cells infiltrated into tumors at 28 days after orthotopic injection of 4T1/miR-Ctrl or 4T1/miR-17~92 monoclonal cells into the mammary fat pads in BALB/c mice.
(B) Leukocytes were isolated from 28-day tumor after injected orthotopically with 4T1/miR-Ctrl and 4T1/miR-17~92 monoclonal cells into the mammary fat pads or subcutaneously injected CT26/miR-Ctrl and CT26/miR-17~92 monoclonal cells into BALB/c mice. The DX5+ CD3- NK cells were analyzed by flow cytometry (upper panel). Lower panel shows FACS analysis of IFN-γ expressed in DX5+CD3- NK cells isolated from 14-day tumors from BALB/c mice after subcutaneous injection of CT26/miR-Ctrl, CT26/miR-17~92, and orthotopic injection of 4T1/miR-Ctrl and 4T1/miR-17~92 tumor cells.
(C) Growth curves of CT26/miR-Ctrl or CT26/miR-17~92 tumors in BALB/c mice injected intraperitoneally with a control anti-IgG Ab, and anti-Asilo-GM1 in NK cell-depleted BALB/c mice as indicated (5 mice per group). Error bars (A, B) represent standard deviation (±SD) (two-way ANOVA; ** p<0.01).
NK cells are innate immune cells with effector functions via the recognition of MHC class I molecules. Therefore we tested whether miR-17~92 cells had impaired expression of MHC class I molecules, which subsequently triggered the activation of NK cells. To determine the role of miR-17~92 in the regulation of MHC class I expression, cell lines with varying levels of miR-17~92 were analyzed for their expression of MHC class I surface molecules. As expected, there was a significant decrease in the expression of MHC class I (H-2D) in CT26/miR-17~92 cells compared to that in CT26/miR-Ctrl cells (Supplementary Fig. 2A).
To determine which microRNA(s) in the miR-17~92 cluster contributed to the suppression of MHC class I expressed on tumor cells, we analyzed the expression levels of MHC class I (H-2D) in CT26 cells expressing various deleted forms of miR-17~92 (ΔmiR-17/20a, ΔmiR-18a, ΔmiR-19a,b and ΔmiR-92a). We found that the deletion of miR-17/20a, but not other members of the miR-17~92 cluster, increased the expression level of MHC class I (H-2D) (Fig. 3A), indicating that miR-17/20a is responsible for the miR-17~92-mediated suppression of MHC class I (H-2D) expression. CT26 colon cancer cells expressing a deleted form of miR-17/20a (ΔmiR-17/20a) did not exhibit suppressed tumor growth, further supporting the role of miR-17/20a in the inhibition of tumor growth (Fig. 3B).
Figure 3. MiR-17/20a enhances NK cell recognition by suppressing the expression of MHC class I.
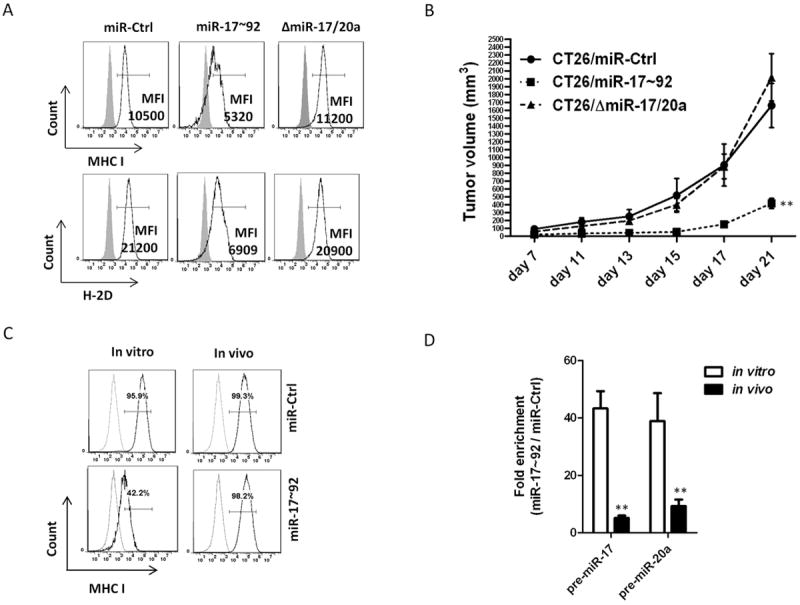
(A) The expression levels of MHC class I (H-2D/H-2K) and H-2D in CT26/miR-Ctrl, CT26/miR-17~92 and CT26/ΔmiR-17/20a cell lines were analyzed by flow cytometry. The mean fluorescence intensity (MFI) of MHC class I+ or H-2D+ cells is indicated.
(B) Growth curves of CT26/miR-Ctrl, CT26/miR-17~92 and CT26/ΔmiR-17/20a tumors in BALB/c mice (5 mice per group). Error bars represent standard deviation (±SD) (two-way ANOVA; ** p<0.01).
(C) The expression levels of MHC class I (H-2D/H-2K) in CT26/miR-Ctrl and CT26/miR-17~92 recovered from tumors (14 days after subcutaneous injection of CT26/miR-Ctrl or CT26/miR-17~92 monoclonal cells into BALB/c mice) were analyzed by flow cytometry.
(D) Expression of pre-miR-17, and pre-miR-20a in tumor cells recovered from tumors (14 days after subcutaneous injection of CT26/miR-Ctrl or CT26/miR-17~92 monoclonal cells into BALB/c mice) was reduced compared to in vitro cultures of the same tumor cell lines as measured by real-time PCR. Error bars represent standard deviation (±SD) (Student’s t-test; ** p<0.01).
To determine whether MHC class I is critical for the escape of tumor cells from NK-cell recognition and killing in vivo, we analyzed the expression levels of MHC class I in tumor cells from immunocompetent mice. There was a dramatic increase in the expression levels of MHC class I (H-2D) in the surviving miR-17~92-expressing tumor cells recovered from the tumors (Fig. 3C). Furthermore, the surviving miR-17~92-expressing cells recovered from tumors implanted in BALB/c mice showed significant increases in MHC class I promoter activity compared to that of non-implanted parental miR-17~92-expressing tumor cells (Supplementary Fig. 2B). The expression levels of miR-17/20a were reduced significantly in surviving tumor cells isolated from miR-17~92 tumors (Fig. 3D). These data suggest that higher levels of miR-17/20a in tumor cells result in the down-regulation of MHC class I and the subsequent activation of NK cells that kill tumor cells.
MiR-17/20a suppresses MHC class I via the Erk5 signaling pathway by targeting Mekk2
To define the molecular mechanism underlying the down-regulation of MHC class I expression by miR-17/20a, we analyzed miR-17/20a targets predicted by public algorithms (TargetScan and RNABrid). We did not find any genes predicted to be associated with the regulation of MHC class I. However, the sequence of Map3k2 encoding Mekk2, an upstream regulator of the Erk5 pathway, was predicted to have four potential conserved miR-17/20a binding sites within its 3’ untranslated region (3’-UTR) with lower minimum free-energy (mfe) (Fig. 4A and Supplementary Fig. S3A). As shown in previous findings, the Erk5 pathway transcriptionally regulates the MHC class I promoter (23,24), therefore, we hypothesized that miR-17/20a suppresses Erk5 signaling by directly binding to sites within the 3’-UTR of Map3k2, thereby suppressing MHC class I (H-2D) expression. To test this hypothesis, we constructed luciferase reporter vectors encoding the top two predicted wild-type miR-17/20a binding sites (Fig. 4A), and assessed their activity in CT26 cells. The wild-type miR-17/20a binding site-reporters showed reduced luciferase expression in cells expressing miR-17/20a but not in cells expressing miR-Ctrl. This was further confirmed by transfection of mutant miR-17 or mutant-miR-20a in which the Map3k2-3’UTR binding sites were mutated (Fig. 4B). We then examined whether forced expression of miR-17/20a affect the endogenous levels of Map3k2 proteins (Mekk2). As expected, there was a dramatic reduction of Map3k2 proteins (Mekk2) in cells expressing high levels of miR-17/20a compared with that of controls (Fig. 4C). Mekk2 has been shown to activate the Mek5/Erk5 pathway (25). We found that forced higher expression of miR-17~92 decreased the levels of Mekk2, phosphorylated-Mek5 (p-Mek5), and phosphorylated-Erk5 (p-Erk5) (Fig. 4D), but it had no effect on the Mek4/Mek7/Jnk pathways (data not shown). We performed luciferase-reporter assays to determine whether the activation of the Mekk2/Erk5 pathway directly affects the promoters of the MHC class I genes. Transient expression of miR-17/20a in CT26 cells was sufficient to reduce luciferase expression from the promoters of HLA-B and β2M, while restoration of Mekk2 expression reversed the suppressive effect of miR-17/20a (Supplementary Fig. 3B). Together, our data suggest that tumor cells escape NK-cell recognition by upregulating MHC class I expression via the Mekk2/Erk5 pathway.
Figure 4. MiR-17/20a suppresses the expression of MHC class I via the Erk5 signal pathway by targeting Mekk2.
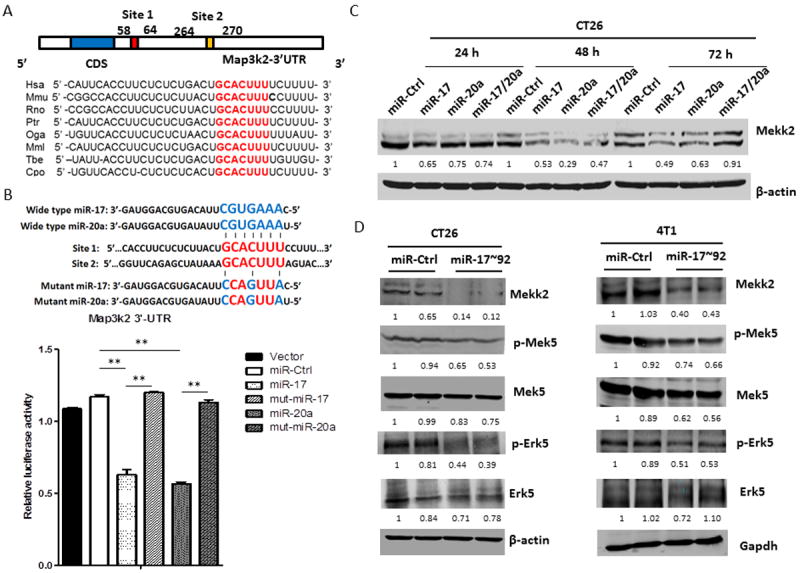
(A) Schematic representation of the mouse Map3k2 3’-UTR. MiR-17/20a complementary sites are indicated (vertical red lines).
(B) Schematic representation of mutant sites of miR-17 and miR-20a (upper panel). HEK293T cells were co-transfected with wild-type Map3k2 3’-UTR luciferase reporter plasmids, together with miR-17 mimic, miR-20a mimic or mutant miR-17, mutant miR-20a (Thermo scientific) as indicated. Renilla luciferase activity was measured 24 hours after transfection. Error bars represent standard deviation (±SD) (one-way ANOVA; ** p<0.01).
(C) Western blots showing expression of Mekk2 in CT26 cells after transient transfection with miR-Ctrl, miR-17, miR-20a or miR-17/20a for 24, 48 or 72 hours. β-actin was used as a loading control.
(D) Western blots showing expression of Mekk2, p-Mek5, Mek5, p-Erk5 and Erk5 in CT26/miR-Ctrl and CT26/miR-17~92 cell lines (left panel) or 4T1/miR-Ctrl and 4T1/miR-17~92 cell lines (right panel). β-actin or Gapdh was used as a loading control.
Mekk2/Erk5 pathway is targeted by miR-17/20a in NK cell-mediated immunosurveillance in vivo
Restoration of Mekk2 expression reversed miR-17/20a-mediated inhibition of MHC class I expression, followed by decreased tumor-cell killing by purified DX5+ splenic leukocytes in vitro (Fig. 5A). Furthermore, forced expression of Mekk2 in miR-17~92 cells promoted tumor growth and metastasis in vivo (Fig. 5B and 5C). Taken together, these observations indicate that miR-17/20a suppresses MHC class I via the Erk5 signaling pathway by targeting Mekk2.
Figure 5. Activation of Mekk2/Erk5 pathway is required for tumor cells to escape from NK cell-mediated immune surveillance.
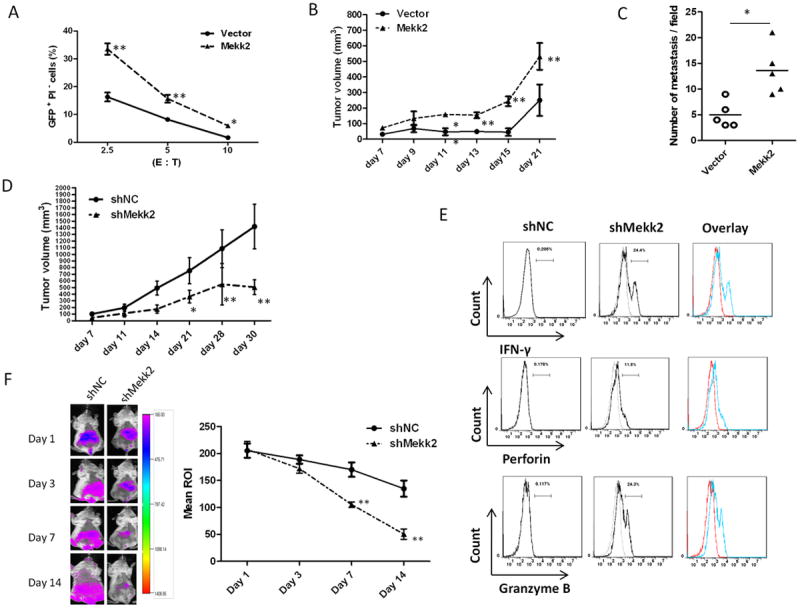
(A) The cytotoxicity of purified DX5+ splenic leukocytes from BALB/c mice to CT26/miR-17~92 cells transfected with control vector or pEh-Mekk2-YFP in vitro for 48 h. The percentage of GFP+PI- cells was analyzed after co-culture of spleen effector cells (E) with target cells (T) at different ratios for 3 h.
(B) Growth curves of CT26/miR-17~92 tumors in BALB/c mice. CT26/miR-17~92 cells transiently transfected with control vector or pEh-Mekk2-YFP. 48 hours after transfection, 5×10⁵ transfected cells were subcutaneously injected into BALB/c mouse (5 mice per group). Tumors were measured with a caliper, and tumor volumes were calculated using the formula length × width2.
(C) Histogram shows the number of metastases per field of sectioned lung. Tissues harvested on day 14 after BALB/c mice having been intravenously injected with CT26/miR-17~92 monoclonal cells transiently transfected with control vector or pEh-Mekk2-YFP. Error bars represent median value (Student’s t-test, *p<0.05).
(D) Growth curves of shNC and shMekk2 tumors in BALB/c mice that were subcutaneously injected with shNC cells or shMekk2 cells stably expressing shRNA targeting Mekk2 (5×10⁵ per mice, 5 mice per group). Error bars represent standard deviation (±SD) (Two-way ANOVA; **p<0.01).
(E) FACS analysis shows IFN-γ, Perforin and Granzyme B in DX5+CD3- NK cells from shMekk2 tumor compared with shNC tumor on day 14 after subcutaneous injection of BALB/c mice. A representative graph (n=5) is shown.
(F) shNC and shMekk2 cell lines were labeled with DiR dye. The labeled cells were intravenously injected into 6-week old female BALB/c mice. Tumor cell metastasis was monitored using a live imaging system (left panel shows a sample image of a mouse at each time point). The means of DiR fluorescent signal intensity (right panel) at diffident time points (Mean ROI = Sum Intensity/Area, n=5). Error bars (A, B, D, F) represent standard deviation (±SD) (Two-way ANOVA; **p<0.01).
We next determined whether the expression of Mekk2 has a role in the down-regulation of MHC class I in tumor cells. We evaluated the surface expression of MHC class I (H-2D) on cells transfected with shRNA targeting Mekk2 (shMekk2) or a control scrambled sequence (shNC). As expected, there was a significant reduction of MHC class I (H-2D) on shMekk2 cells compared with that on control shNC cells (Supplementary Fig. 4B). We investigated the effect of restoring the expression of Mekk2 on the promoters of the MHC class I genes. As expected, knockdown of Mekk2 expression reduced luciferase activity compared with shRNA control, while overexpression of Mekk2 reversed the suppressive effect of shMekk2 (Supplementary Fig. 4C). To determine whether the suppression of the Erk5 pathway leads to the activation of NK cells in vivo, we analyzed the profiles of cytotoxic markers released from NK cells of mice injected with CT26 cells transfected with either shMekk2 or shNC. Knockdown of Mekk2 in tumor cells decreased tumor size and caused a higher number of Granzyme B+ Perforin+ IFNγ+ activated NK cells in the tumor (Fig. 5D and 5E), in agreement with the in vivo results shown in Fig. 5B and 5C. When tumor cells with an inactivated Erk5 pathway were injected into immunocompetent mice, the tumor cells were mostly eliminated in comparison with tumor cells transfected with the control vector (Fig. 5F). Taken together, these data demonstrate that inhibiting Erk5 activation via a knockdown of Mekk2 leads to prevention of tumor growth and metastasis through the activation of NK cells in vivo.
MiR-17/20a is significantly down-regulated in human solid cancers
To determine the potential role of the miR-17~92 cluster in regulating human tumor progression, we assessed the expression levels of miR-17/20a in 14 tumor samples of human colorectal cancer and 12 corresponding adjacent non-tumor colon tissues by quantitative RT-PCR (qRT-PCR). Results from analysis of human samples recapitulated our mouse tumor data; we showed a significant reduction of the levels of both miR-17 and miR-20a in human colorectal cancer tumor samples compared with those in the corresponding adjacent normal colon tissues (Fig. 6A). Finally, we evaluated whether the Mekk2/Erk5 activity was associated with the expression levels of the miR-17/20a in human colon tissues. We found that the Mekk2/Erk5 pathway was highly activated in tumors with low expression levels of miR-17/20a; in contrast, the Mekk2/Erk5 activity was suppressed in the corresponding adjacent normal colon tissues, which expressed higher levels of miR-17/20a (Fig. 6B). Results from the human studies are in agreement with the data generated from mouse cancer models, strongly supporting that miR-17/20a is a negative regulator of the Mekk2/Erk5 pathway.
Figure 6. Clinical association between the expression levels of miR-17~92 and the activity of the MEKK2/ERK5 pathway in human colon tumor samples.
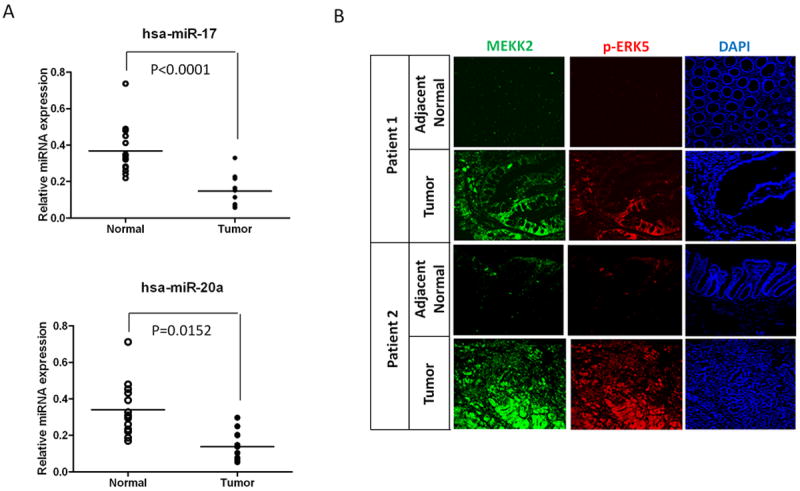
(A) The expression levels of the hsa-miR-17 and hsa-miR-20a in 14 human colorectal tumor tissues and 12 adjacent non-tumor colon tissues using the Student’s t test.
(B) Immunofluorescent staining showing the expression of MEKK2 and p-ERK5 in paired human colon cancer and adjacent non-tumor tissues. Original magnification ×10.
Discussion
In this study we demonstrated that the expression of higher levels of miR-17/20a in the miR-17~92 cluster inhibits tumor growth in vivo. We also showed that miR-17/20a suppresses tumor growth by enhancing NK-cell recognition via targeting the Mekk2/Mek5/Erk5 pathway. Our findings provide a rationale for developing a therapeutic strategy to treat certain cancers by targeted-delivery of miR-17/20a.
The antitumor effect of NK cells has been shown in clinical studies. Results from an epidemiology study have also suggested that low peripheral blood NK cell activity is correlated with increased cancer risk (26). NK-cell infiltration into colorectal tumor tissue is correlated with a better disease prognosis (27). NK-cell activation is controlled by a balance of stimulatory and inhibitory signaling incurred when target-cell engagement occurs.
The relationship between immunosuppression and imbalanced miRNA expression has been observed in various human cancer cell lines and tumor samples (28, 29). However, the potential role of restoring microRNAs expression in tumor cells on the modulation of NK-cell tumor cytotoxicity has rarely been reported (30, 31). Our data demonstrate that higher levels of miR-17/20a suppress the expression of MHC class I on tumor cells by targeting the Mekk2/Mek5/Erk5 pathway, which in turn, enhances NK-cell recognition. This finding is in agreement with results reported by Charni and colleagues showing that knockdown of Erk5, which is downstream of the Mekk2-mediated pathway in leukemia cells, effectively attenuates their tumor activity by down-regulating MHC class I expression leading to activation of NK cells (23). Our observation delineates the mechanism of suppression and reveals that the Mekk2/Mek5/Erk5 pathway is the major pathway that contributes to the suppression of MHC class I expression in miR-17~92-expressing cells. Moreover, we found that higher levels of miR-17/20a mediated the targeting of MHC class I more efficiently and rapidly for inducing NK cell-mediated tumor cytotoxicity compared to shRNA knockdown of Erk5 reported by others (32). This suggests that Mekk2 may regulate more molecules/pathways that play a role in modulating the expression of MHC class I. Our finding that miR-17/20a targets MHC class I provides a rationale to develop targeted-delivery of miR-17/20a into tumor tissue for cancer therapy as well as other diseases associated with dysregulated MHC class I expression.
Aberrant microRNA expression has been identified in various human solid cancers (10). Whether restoration of the miRNA levels expressed in tumor cells to the levels expressed in the adjacent non-tumor tissue has any effect on tumor progression has not been studied. In this report, we described for the first time that the restoration of the expression levels of the miR-17~92 cluster miRNAs in both murine breast cancer and colon cancer cells also restores its function as a tumor suppressor. Specifically, the restoration of miR-17/20a within the miR-17-92 cluster plays a dominant role in the inhibition of tumor growth by enhancing NK-cell recognition via directly targeting the Mekk2/Mek5/Erk5 pathway. From a therapeutic stand point, this finding is significant. An appealing property of miRNAs as therapeutic agents is their capacity to target multiple genes, making them extremely efficient in regulating distinct biological processes in the context of a network. Therefore, developing therapeutic strategies to restore homeostasis by modifying the levels of miRNA expression would be more efficient than targeting individual genes or proteins.
Results from this study raised several new challenging questions for future studies. We found that surviving miR-17~92-expressing tumor cells recovered from the tumors still expressed miR-17~92-GFP (data not shown), indicating that the transgene was not lost. However, the machinery in the tumor microenvironment that prevents miR-17~92-mediated down-regulation of MHC class I expression on tumor cell is not yet known. We have demonstrated that miR-17/20a suppressed Map3k2 expression by directly binding to the Map3k2 3’UTR. Although there are four potential miR-17/20a binding sites in the Map3k2 3’UTR, we were only able to PCR amplify the genomic DNA fragment covering the first two sites which have lower energy requirement for binding. Since we failed to PCR the fragment covering all four computationally predicted binding sites for the Map3k2 3’UTR (more than 10kb in full-length), we cannot exclude the regulatory effect of additional binding sites on the expression of the Map3k2 protein.
Also, there is some discrepancy between the results we presented in this manuscript, and data published by others in terms of miR-17~92-mediated effects on either pro-tumor or antitumor progression. Previous observations support the dominant role of miR-19a and miR-19b in promoting tumorigenesis and in tumor angiogenesis (1, 11, 13, 17). Recently, miR-20a has been reported to promote tumor metastasis by down-regulating Fas expression on osteosarcoma tumor cell lines (33). However, there is also increasing evidence to support the function of the miR-17~92 cluster in tumor suppression in breast cancer (14), hepatomas (15), and human gastrointestinal stromal tumors (34). Loss of heterozygosity at 13q12-q13 (the locus of the miR-17-92 cluster) is associated with tumor progression and poor prognosis, including breast cancer, squamous cell carcinoma of the larynx, retinoblastoma, and hepatocellular carcinoma 35,36). Moreover, using a high-resolution array-based comparative genomic hybridization in human tumor specimens, the miR~17-92 cluster was deleted in 16.5% of ovarian cancers, 21.9% of breast cancers, and 20.0% of melanoma 37,38). There are a number of possibilities that could explain the discrepancies of these studies. Unlike siRNAs, one miRNA could regulate a number of genes, and the potential effects on targeted genes could be dependent on the levels of that miRNA. In addition, the accessibility and availability of the miRNA targeted genes that reside in the same compartment of the cells is dependent on many factors. It is conceivable that different tumor microenvironments such as those in osteosarcomas and lymphomas tested in other studies could be different from the colon cancer and breast cancer microenvironment we tested in our study. Therefore, the results generated from these studies support the need to further identify factors that regulate miR-17 or miR-20a as a pro- or anti-tumorigenic miRNA.
In summary, restoration of the expression level of miR-17/20a enhances NK-cell recognition by targeting the Mekk2/Mek5/Erk5 pathway. This finding not only uncovers the molecular mechanism underlying the miR-17/20a enhancement of immune responses against tumor growth, but it opens up a new approach for developing a therapeutic strategy to treat certain types of cancer by targeted delivery of miR-17/20a.
Supplementary Material
Acknowledgments
We thank Dr. Andrea Ventura (Memorial Sloan-Kettering Cancer Center, New York, USA) for providing pMSCV PIG, PIG-miR-17~92 WT, ΔPIG-miR-17/20a, ΔPIG-miR-18a, ΔPIG-miR-19a,b, and ΔPIG-miR-92a; Dr. Brian C Schaefer (Uniformed Services University of the Health Sciences, Maryland, USA) for providing pEh-Mekk2-YFP; Dr. Peter J. van den Elsen (Leiden University Medical Centre, Leiden, the Netherlands) for providing pGL3-B250 and pGL3-β2m. This work was supported by grants from the National Institutes of Health (NIH) (UTR000875A, RO1AT004294); and the Louisville Veterans Administration Medical Center (VAMC) Merit Review Grants (H.-G.Z.). We thank Dr. Jerald Ainsworth for editorial assistance.
Footnotes
Contribution: H.J. and H.-G.Z. designed the research, analyzed and interpreted data, and drafted the manuscript; J.Y., and D.M. interpreted findings and drafted the manuscript; and P.W., X.L., Q.W., Z.-B.D., X.Z., J.M., L.Z., and B.W., performed experiments and interpreted data.
Conflict of Interest: there are none to declare.
References
- 1.He L, Thomson JM, Hemann MT, Hernando-Monge E, Mu D, Goodson S, et al. A microRNA polycistron as a potential human oncogene. Nature. 2005;435:828–33. doi: 10.1038/nature03552. [DOI] [PMC free article] [PubMed] [Google Scholar]
- 2.Cloonan N, Brown MK, Steptoe AL, Wani S, Chan WL, Forrest AR, et al. The miR-17-5p microRNA is a key regulator of the G1/S phase cell cycle transition. Genome Biol. 2008;9:R127. doi: 10.1186/gb-2008-9-8-r127. [DOI] [PMC free article] [PubMed] [Google Scholar]
- 3.Bjork JK, Sandqvist A, Elsing AN, Kotaja N, Sistonen L. miR-18, a member of Oncomir-1, targets heat shock transcription factor 2 in spermatogenesis. Development. 2010;137:3177–84. doi: 10.1242/dev.050955. [DOI] [PubMed] [Google Scholar]
- 4.Budde H, Schmitt S, Fitzner D, Opitz L, Salinas-Riester G, Simons M. Control of oligodendroglial cell number by the miR-17-92 cluster. Development. 2010;137:2127–32. doi: 10.1242/dev.050633. [DOI] [PubMed] [Google Scholar]
- 5.Mu P, Han YC, Betel D, Yao E, Squatrito M, Ogrodowski P, et al. Genetic dissection of the miR-17~92 cluster of microRNAs in Myc-induced B-cell lymphomas. Genes Dev. 2009;23:2806–11. doi: 10.1101/gad.1872909. [DOI] [PMC free article] [PubMed] [Google Scholar]
- 6.Medina PP, Nolde M, Slack FJ. OncomiR addiction in an in vivo model of microRNA-21-induced pre-B-cell lymphoma. Nature. 2010;467:86–90. doi: 10.1038/nature09284. [DOI] [PubMed] [Google Scholar]
- 7.Volinia S, Calin GA, Liu CG, Ambs S, Cimmino A, Petrocca F, et al. A microRNA expression signature of human solid tumors defines cancer gene targets. Proc Natl Acad Sci U S A. 2006;103:2257–61. doi: 10.1073/pnas.0510565103. [DOI] [PMC free article] [PubMed] [Google Scholar]
- 8.Yanaihara N, Caplen N, Bowman E, Seike M, Kumamoto K, Yi M, et al. Unique microRNA molecular profiles in lung cancer diagnosis and prognosis. Cancer Cell. 2006;9:189–98. doi: 10.1016/j.ccr.2006.01.025. [DOI] [PubMed] [Google Scholar]
- 9.Zhang B, Pan X, Cobb GP, Anderson TA. microRNAs as oncogenes and tumor suppressors. Dev Biol. 2007;302:1–12. doi: 10.1016/j.ydbio.2006.08.028. [DOI] [PubMed] [Google Scholar]
- 10.Lu J, Getz G, Miska EA, Alvarez-Saavedra E, Lamb J, Peck D, et al. MicroRNA expression profiles classify human cancers. Nature. 2005;435:834–8. doi: 10.1038/nature03702. [DOI] [PubMed] [Google Scholar]
- 11.Kumar MS, Lu J, Mercer KL, Golub TR, Jacks T. Impaired microRNA processing enhances cellular transformation and tumorigenesis. Nat Genet. 2007;39:673–7. doi: 10.1038/ng2003. [DOI] [PubMed] [Google Scholar]
- 12.Ozen M, Creighton CJ, Ozdemir M, Ittmann M. Widespread deregulation of microRNA expression in human prostate cancer. Oncogene. 2008;27:1788–93. doi: 10.1038/sj.onc.1210809. [DOI] [PubMed] [Google Scholar]
- 13.Mendell JT. miRiad roles for the miR-17-92 cluster in development and disease. Cell. 2008;133:217–22. doi: 10.1016/j.cell.2008.04.001. [DOI] [PMC free article] [PubMed] [Google Scholar]
- 14.Yu Z, Willmarth NE, Zhou J, Katiyar S, Wang M, Liu Y, et al. microRNA 17/20 inhibits cellular invasion and tumor metastasis in breast cancer by heterotypic signaling. Proc Natil Acad Sci U S A. 2010;107:8231–6. doi: 10.1073/pnas.1002080107. [DOI] [PMC free article] [PubMed] [Google Scholar]
- 15.Lin YH, Liao CJ, Huang YH, Wu MH, Chi HC, Wu SM, et al. Thyroid hormone receptor represses miR-17 expression to enhance tumor metastasis in human hepatoma cells. Oncogene. 2013;32:4509–18. doi: 10.1038/onc.2013.309. [DOI] [PubMed] [Google Scholar]
- 16.Gits CM, van Kuijk PF, Jonkers MB, Boersma AW, van Ijcken WF, Wozniak A, et al. MiR-17-92 and miR-221/222 cluster members target KIT and ETV1 in human gastrointestinal stromal tumours. Br J Cancer. 2013;109:1625–35. doi: 10.1038/bjc.2013.483. [DOI] [PMC free article] [PubMed] [Google Scholar]
- 17.Olive V, Bennett MJ, Walker JC, Ma C, Jiang I, Cordon-Cardo C, et al. miR-19 is a key oncogenic component of mir-17-92. Genes Dev. 2009;23:2839–49. doi: 10.1101/gad.1861409. [DOI] [PMC free article] [PubMed] [Google Scholar]
- 18.Schaefer BC, Ware MF, Marrack P, Fanger GR, Kappler JW, Johnson GL, et al. Live cell fluorescence imaging of T cell MEKK2: redistribution and activation in response to antigen stimulation of the T cell receptor. Immunity. 1999;11:411–21. doi: 10.1016/s1074-7613(00)80116-8. [DOI] [PubMed] [Google Scholar]
- 19.Gobin SJ, van Zutphen M, Westerheide SD, Boss JM, van den Elsen PJ. The MHC-specific enhanceosome and its role in MHC class I and beta(2)-microglobulin gene transactivation. J Immunol. 2001;167:5175–84. doi: 10.4049/jimmunol.167.9.5175. [DOI] [PubMed] [Google Scholar]
- 20.Ilkovitch D, Lopez DM. The liver is a site for tumor-induced myeloid-derived suppressor cell accumulation and immunosuppression. Cancer Res. 2009;69:5514–21. doi: 10.1158/0008-5472.CAN-08-4625. [DOI] [PMC free article] [PubMed] [Google Scholar]
- 21.Zhang HG, Kim H, Liu C, Yu S, Wang J, Grizzle WE, et al. Curcumin reverses breast tumor exosomes mediated immune suppression of NK cell tumor cytotoxicity. Biochim Biophys Acta. 2007;1773:1116–23. doi: 10.1016/j.bbamcr.2007.04.015. [DOI] [PMC free article] [PubMed] [Google Scholar]
- 22.Arase H, Saito T, Phillips JH, Lanier LL. Cutting edge: the mouse NK cell-associated antigen recognized by DX5 monoclonal antibody is CD49b (alpha 2 integrin, very late antigen-2) J Immunol. 2001;167:1141–4. doi: 10.4049/jimmunol.167.3.1141. [DOI] [PubMed] [Google Scholar]
- 23.Charni S, Aguilo JI, Garaude J, de Bettignies G, Jacquet C, Hipskind RA, et al. ERK5 knockdown generates mouse leukemia cells with low MHC class I levels that activate NK cells and block tumorigenesis. J Immunol. 2009;182:3398–405. doi: 10.4049/jimmunol.0803006. [DOI] [PMC free article] [PubMed] [Google Scholar]
- 24.Charni S, de Bettignies G, Rathore MG, Aguilo JI, van den Elsen PJ, Haouzi D, et al. Oxidative phosphorylation induces de novo expression of the MHC class I in tumor cells through the ERK5 pathway. J Immunol. 2010;185:3498–503. doi: 10.4049/jimmunol.1001250. [DOI] [PubMed] [Google Scholar]
- 25.Sun W, Kesavan K, Schaefer BC, Garrington TP, Ware M, Johnson NL, et al. MEKK2 associates with the adapter protein Lad/RIBP and regulates the MEK5-BMK1/ERK5 pathway. J Biol Chem. 2001;276:5093–100. doi: 10.1074/jbc.M003719200. [DOI] [PubMed] [Google Scholar]
- 26.Levy S, Herberman R, Lippman M, d’Angelo T. Correlation of stress factors with sustained depression of natural killer cell activity and predicted prognosis in patients with breast cancer. J Clin Oncol. 1987;5:348–53. doi: 10.1200/JCO.1987.5.3.348. [DOI] [PubMed] [Google Scholar]
- 27.Menon AG, Janssen-van Rhijn CM, Morreau H, Putter H, Tollenaar RA, van de Velde CJ, et al. Immune system and prognosis in colorectal cancer: a detailed immunohistochemical analysis. Lab Invest. 2004;84:493–501. doi: 10.1038/labinvest.3700055. [DOI] [PubMed] [Google Scholar]
- 28.Gaziel-Sovran A, Segura MF, Di Micco R, Collins MK, Hanniford D, Vega-Saenz de Miera E, et al. miR-30b/30d regulation of GalNAc transferases enhances invasion and immunosuppression during metastasis. Cancer Cell. 2011;20:104–18. doi: 10.1016/j.ccr.2011.05.027. [DOI] [PMC free article] [PubMed] [Google Scholar]
- 29.Schickel R, Boyerinas B, Park SM, Peter ME. MicroRNAs: key players in the immune system, differentiation, tumorigenesis and cell death. Oncogene. 2008;27:5959–74. doi: 10.1038/onc.2008.274. [DOI] [PubMed] [Google Scholar]
- 30.Stern-Ginossar N, Gur C, Biton M, Horwitz E, Elboim M, Stanietsky N, et al. Human microRNAs regulate stress-induced immune responses mediated by the receptor NKG2D. Nat Immunol. 2008;9:1065–73. doi: 10.1038/ni.1642. [DOI] [PubMed] [Google Scholar]
- 31.Yadav D, Ngolab J, Lim RS, Krishnamurthy S, Bui JD. Cutting edge: down-regulation of MHC class I-related chain A on tumor cells by IFN-gamma-induced microRNA. J Immunol. 2009;182:39–43. doi: 10.4049/jimmunol.182.1.39. [DOI] [PMC free article] [PubMed] [Google Scholar]
- 32.Charni S, Aguilo JI, Garaude J, de Bettignies G, Jacquet C, Hipskind RA, et al. ERK5 knockdown generates mouse leukemia cells with low MHC class I levels that activate NK cells and block tumorigenesis. J Immunol. 2009;182:3398–405. doi: 10.4049/jimmunol.0803006. [DOI] [PMC free article] [PubMed] [Google Scholar]
- 33.Huang G, Nishimoto K, Zhou Z, Hughes D, Kleinerman ES. miR-20a encoded by the miR-17-92 cluster increases the metastatic potential of osteosarcoma cells by regulating Fas expression. Cancer Res. 2012;72:908–16. doi: 10.1158/0008-5472.CAN-11-1460. [DOI] [PMC free article] [PubMed] [Google Scholar]
- 34.Gits CM, van Kuijk PF, Jonkers MB, Boersma AW, van Ijcken WF, Wozniak A, et al. MiR-17-92 and miR-221/222 cluster members target KIT and ETV1 in human gastrointestinal stromal tumours. Br J Cancer. 2013;109:1625–35. doi: 10.1038/bjc.2013.483. [DOI] [PMC free article] [PubMed] [Google Scholar]
- 35.Tsang YS, Lo KW, Leung SF, Choi PH, Fong Y, Lee JC, et al. Two distinct regions of deletion on chromosome 13q in primary nasopharyngeal carcinoma. Int J Cancer. 1999;83:305–8. doi: 10.1002/(sici)1097-0215(19991029)83:3<305::aid-ijc3>3.0.co;2-d. [DOI] [PubMed] [Google Scholar]
- 36.Eiriksdottir G, Johannesdottir G, Ingvarsson S, Bjornsdottir IB, Jonasson JG, Agnarsson BA, et al. Mapping loss of heterozygosity at chromosome 13q: loss at 13q12-q13 is associated with breast tumour progression and poor prognosis. Eur J Cancer. 1998;34:2076–81. doi: 10.1016/s0959-8049(98)00241-x. [DOI] [PubMed] [Google Scholar]
- 37.Lin YW, Sheu JC, Liu LY, Chen CH, Lee HS, Huang GT, et al. Loss of heterozygosity at chromosome 13q in hepatocellular carcinoma: identification of three independent regions. Eur J Cancer. 1999;35:1730–4. doi: 10.1016/s0959-8049(99)00205-1. [DOI] [PubMed] [Google Scholar]
- 38.Shao J, Li Y, Wu Q, Liang X, Yu X, Huang L, et al. High frequency loss of heterozygosity on the long arms of chromosomes 13 and 14 in nasopharyngeal carcinoma in Southern China. Chin Med J. 2002;115:571–5. [PubMed] [Google Scholar]
Associated Data
This section collects any data citations, data availability statements, or supplementary materials included in this article.