Anatomical Magnetic Resonance Imaging (MRI) provides detailed information about the morphological features – usually shape and size -- of various brain regions in vivo. Recent availability of MRI scanners having field strengths of 3 Tesla or higher, have yielded images of exquisite quality in which brain tissues are differentiated with excellent spatial resolution, and in which investigators can delineate brain structures and study their correlations with various clinical, psychological, and other biological measures. Typical morphological features of interest include the volumes of specific regions (e.g., the frontal lobes, amygdala, hippocampus, or basal ganglia) and the localized volumes of subregions (e.g., the dentate gyrus of the hippocampus, or the basolateral nucleus of the amygdala) that are inferred from curves that describe the surfaces of that brain region. Quantification of the sizes and shapes of structures is termed morphometry and can be accomplished using either manual or automated techniques.
Reliable and accurate morphometry requires certain preparatory work with the images, termed “preprocessing”, that facilitates identification of tissue types and brain regions. MRI scanning, for example, necessarily introduces random noise into the MRI signal that each voxel encodes as a gray scale intensity. Typically we reduce noise by smoothing the image with a special filter that preserves the boundaries between differing brain tissues. In addition to random noise, images contain a systematic drift in image intensity that is caused by a systematic spatial variation in the main magnetic field (B°), as well as a nonsystematic spatial variation in image intensity that is caused by variation in the radiofrequency (RF) pulse from the MRI scanner. These variations in image intensity can cause some pixels that represent white matter to appear instead more like cortical gray matter, and vice versa. These variations in pixel intensities cause errors in the delineation of brain regions and therefore can introduce errors into morphological measures. Correction of variations in intensity of the image is challenging because these variations vary across scanners and across the individuals being scanned. Nevertheless, several acceptable and automated methods are commonly available.
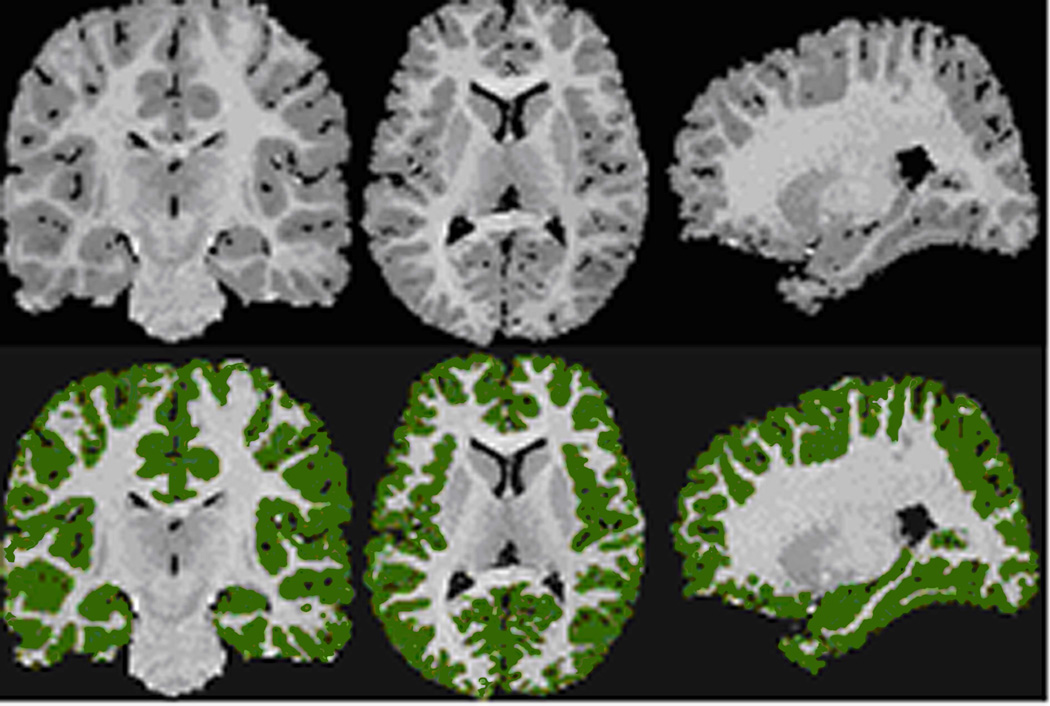
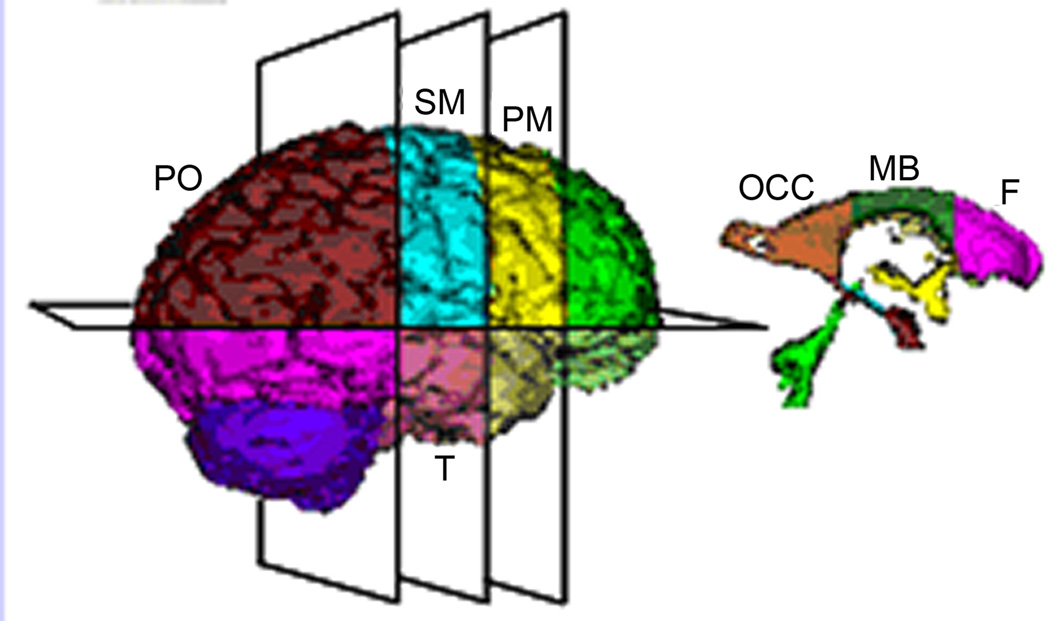
The next step in the processing of images typically involves division of the brain into various tissue types (e.g., brain vs. nonbrain tissue, cerebrospinal fluid (CSF) vs. surrounding white or gray matter, and gray matter vs. white matter), a process termed “segmentation” of the tissues (Fig. 1). Automated and manual methods for segmenting tissues all rely to some extent on differences in pixel intensity across varies tissue types. After segmentation, individual tissues can be subdivided into anatomically relevant regions, a process termed “parcellation” of those tissues (Fig. 2). Ventricular CSF, for example, may be divided into the lateral bodies, temporal horns, and the 3rd and 4th ventricles. Similarly, subcortical gray matter can be divided into the caudate, putamen, globus pallidus, nucleus accumbens, and thalamus. Parcellation may performed by manually defining the boundaries of those regions, or it may be performed using automated methods, such as those that are based on a statistical model of that brain region that has been learned from regions delineated in images previously obtained in different individuals. It can also be performed using anatomical landmarks within the brain that are separate from those within the region being defined, such as the anterior and posterior commissures. Once tissues have been parcellated, those regions of interest can be characterized. The most common characterization historically has been measurement of regional volumes. This provides a single number for the volume of that region in each individual, a relatively coarse characterization of an anatomically and functionally complicated structure.
Fig. 1.
Cortical Segmentation divides the brain into various tissue types. Left: Coronal; Middle: Axial; Right: Parasagittal Views. Top: Original Gray Scale Image; Bottom: Segmented Cortical Gray Matter (Green). Images are in standard orientation.
Fig. 2.
Parcellation subdivided individual tissue type into anatomically relevant subregions. Planar sections used to subdivide the cerebrum and ventricles. PM=premotor; SM=sensorimotor; PO=parieto-occipital; T=temporal; OCC=occipital horns; MB=midbody; F=frontal horns
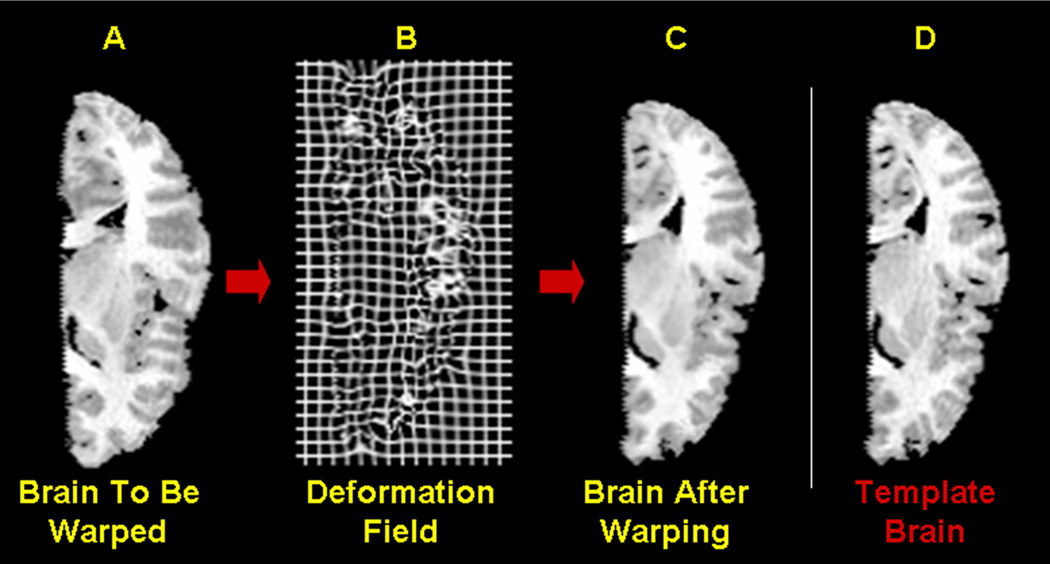
Finer grained analyses of a defined region typically require transformation of the brain and individual regions into a standard spatial orientation and position, such that the corresponding structures and points in correspond roughly with one another across different brains (Fig. 3), a process termed “spatial normalization.” Brains are normalized through rotation, translation (shifting linearly along the three spatial dimensions), scaling (making the entire brain uniformly bigger or smaller), and reslicing (cutting the image into parallel “slices” that correspond with one another across brains). Automated computer algorithms now permit the spatial normalization of images that is fast, precise, and highly reproducible. Spatial normalization allows us to compare across individuals or groups of individuals various biologically important features of the brain, such as the thickness of the cortex, the shapes of brain regions, or the volumes of small and highly localized portions of larger regions of interest.
Fig. 3.
Spatial Normalization transforms a subject image into the standard space defined by the reference image such that the two images are best superimposed in the standard space. (a) The reference image (b) The subject image. (c) The normalized subject image, which matches closes with the reference image (a). (d) A rectangular grid deformed by the same amount as the subject image, displays the smooth deformation that was applied to the subject image.
Two popular techniques for the fine-grained morpohological analysis of brain regions and that require spatial normalization include Voxel Based Morphometry (VBM) and so-called tensor based morphometry, or analysis of surface contours. VBM is a simple, yet powerful, tool for the quantitative, automated, and fine-grained assessment of morphologic features of the brain and its subregions. VBM, however, assumes that a voxel in the common space measures the same morphological feature of the brain across all normalized images, an assumption that may not be true even in healthy individuals. Although the high-dimensional, nonlinear deformation of brain images and the smoothing of anatomical features typically improve the matching of these morphological features, these operations may also reduce differences in these features in unknown and unpredictable ways, particularly in diseased brains. In addition, maps of group differences in VBM studies typically plot statistical significance levels at each pixel of the image, giving the impression of great precision, the pixel intensities being compared across groups are influenced by anatomical features and pixel intensities of brain regions at a distance from the pixel where the significance level is portrayed, because anatomical features and pixel intensities across the entire brain usually influence precisely how the brains are spatially normalized. Thus, significant findings reported in small structures are often spurious and not reproducible.
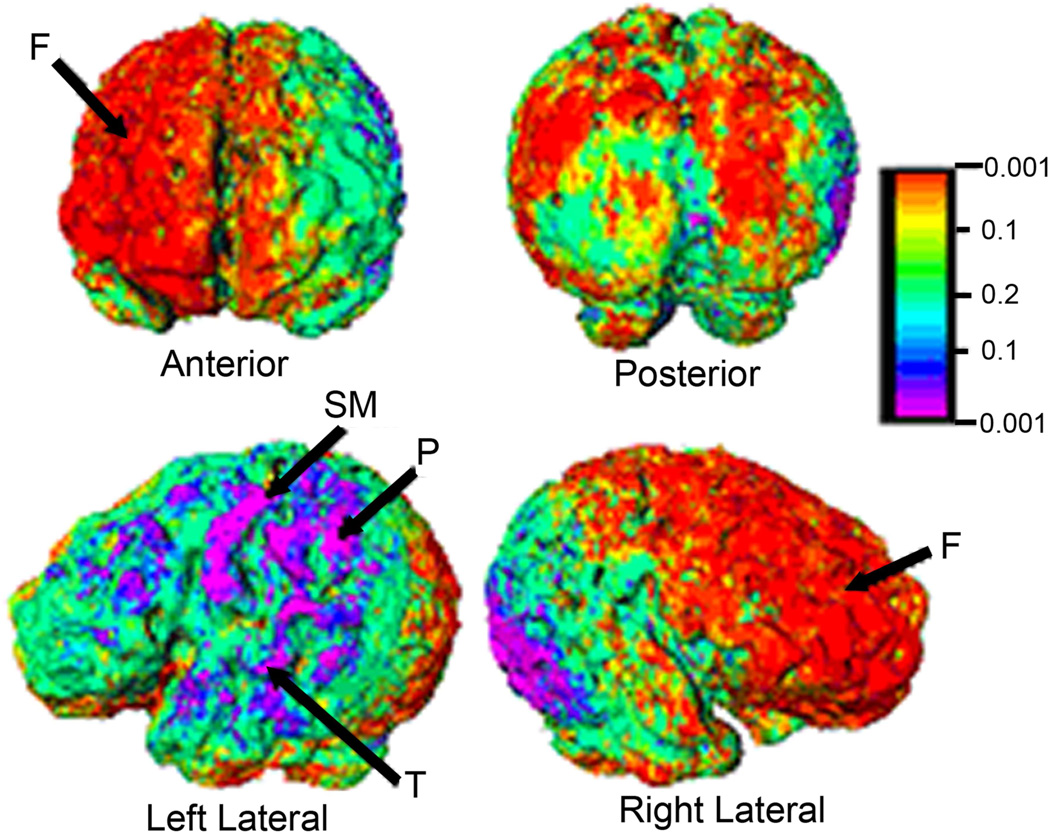
The analysis of morphological surfaces (the analyses of the shapes and localized volumes at the surfaces of brain regions) assumes that variation in those shapes and volumes is determined by variation in the cellular components of the tissue underlying points of the surface that correspond across individuals (Fig. 4). These points are determined using previously defined regions of interest, which minimized or eliminates the influences of spatially distant features of the brain on the surface measure, though substantially increasing the labor involved in surface analyses compared with VBM. Surface analyses are also typically limited to the study of one brain structure at a time, unlike VBM.
Fig. 4.
Surface Morphometry localizes volumetric differences across brain structures, which can help to implicate specific subnuclei in neuropsychiatric disorders. Results comparing morphologies of the cortical surface in 14 term and 10 preterm infants. The right frontal cortices (anterior view) were enlarged in preterm infants. Sensorimotor and parietal cortices on the left were reduced in size in the preterm group. The results were unchanged whether sex and Postmenstrual Age (PMA) at time of scan were statistical covariates. The color bar depicts associated P-values F=frontal; P=parietal; SM=sensorimotor; T=temporal.
Variations in the morphological features of the brain are presumed to be caused by the addition, subtraction, or reorganization of cellular elements within the tissue studied, variation caused by variation across individuals in genetic and epigenetic influences on brain development. Those influences vary systematically across diagnostic entitites and can therefore be detected by comparing morphological features of the brain across groups. Anatomical MRI also allows assessment of the correlations of quantitative measures of morphological variation with a host of other clinically relevant measures of the participants, such as their genotype, the severity of their symptoms, or their performance on cognitive and other behavioral tasks. These correlations help to identify the biological determinants of variability in morphological features and the consequences of that variability on cognitive, emotional, and behavioral functioning to understand better the brain bases of developmentally based neuropsychiatric disorders. Brain regions that are smaller than a few cubic millimeters cannot yet be delineated reliably with MRI, and thus anatomical MRI alone cannot inform us about the cellular or other ultrastructural determinants of macroscopic variability in brain structure. As MRI methods and technologies continue to evolve, however, the capabilities of anatomical MRI will undoubtedly also evolve, and along with them, so will the usefulness of anatomical imaging in the study of the pathophysiology of childhood psychiatric disorders.
Acknowledgments
This work was supported in part by NIMH grants MH068318 and K02-74677, NIDA grant DA017820, and the Suzanne Crosby Murphy Endowment at Columbia University.
Footnotes
Financial disclosure
Disclosure: The authors report no conflicts of interest.


