Abstract
Objectives
Cartilage fatigue, due to mechanical work, may account for precocious development of degenerative joint disease in the temporomandibular joint (TMJ). This study compared energy densities (mJ/mm3) in TMJs of three diagnostic groups.
Setting and Sample Population
Sixty-eight subjects (44 women, 24 men) gave informed consent. Diagnostic criteria for temporomandibular disorders (DC/TMD) and imaging were used to group subjects according to presence of jaw muscle or joint pain (+P) and bilateral disc displacement (+DD).
Material and Methods
Subjects (+P+DD, n=16; −P+DD, n=16; and −P−DD, n=36) provided cone-beam computed tomography and magnetic resonance images, and jaw tracking data. Numerical modeling was used to determine TMJ loads (Fnormal). Dynamic stereometry was used to characterize individual-specific data of stress-field dynamics during 10 symmetrical jaw closing cycles. These data were used to estimate tractional forces (Ftraction). Energy densities were then calculated as . ANOVA and Tukey-Kramer post-hoc analyses tested for intergroup differences.
Results
Mean ±standard error energy density for the +P+DD group was 12.7±1.5 mJ/mm3 and significantly greater (all adjusted p<0.04) when compared to −P+DD (7.4±1.4 mJ/mm3) and −P−DD (5.8±0.9 mJ/mm3) groups. Energy densities in −P+DD and −P−DD groups were not significantly different.
Conclusion
Diagnostic group differences in energy densities suggest that mechanical work may be a unique mechanism which contributes to cartilage fatigue in subjects with pain and disc displacement.
Keywords: human, cartilage, temporomandibular joint, mechanics, fatigue
Introduction
The etiological variables that result in the precocious development of degenerative joint disease of the TMJ have yet to be elucidated. The biomechanical and biochemical integrity of articular tissue is likely to be dependent on the magnitude and frequency of applied mechanical work imposed on a volume of the TMJ disc. This is also known as energy density (mJ/mm3). Biphasic modeling of contact mechanics has shown that energy density produced by plowing tractional forces is balanced by an internal strain energy in the collagen-glycosaminoglycan matrix, and pressurization of the interstitial fluid (1,2).
Like all synovial joints, failure of the articulating tissues is thought to involve an interactive process between mechanical fatigue, oxidative stresses, and inflammation (3). The variables determining the rate of mechanical fatigue of articulating surfaces are the frequency, magnitude, and concentration of mechanical strains, and innate susceptibility of the tissue. Why destruction of the articular tissues occurs earlier in the TMJ compared to knees and hips may be due to these variables (4).
Current evidence suggests that fatigue of the TMJ disc may involve magnitude of joint loads and the consequent mechanical stresses and strains imposed on the tissue (5–8). Data reported by Iwasaki and co-workers indicated that significant differences in joint loads exist amongst TMD diagnostic subgroups (9) and suggest that there are unique mechanisms of cartilage failure within diagnostic subgroups. Magnitude and frequency of TMJ loads are likely to affect the rate of articular tissue mechanical fatigue. Equally important is the routine mechanical work imposed on cartilage due to tractional forces, which are a combination of frictional and plowing forces that occur when a stress-field moves over the surface and causes deformation of the cartilage matrix (10,11).
The objective of the current project was to test the hypothesis that energy densities in the TMJs of subjects with bilateral disc displacement with and without pain were significantly higher than in individuals with normal joints and without pain.
Material and Methods
The protocols used in this project were approved by two university institutional review boards. Sixty-eight informed and consenting subjects participated in this study. Inclusion and classification of subjects were based on Diagnostic Criteria for TMD (DC/TMD) (12) and bilateral magnetic resonance images (MRI) of TMJs (13). Subjects with a history of frank trauma to the TMJ were excluded. According to jaw muscle or TMJ pain status (+P=presence of pain) and disc position (+DD=disc displacement), female (n=44) and male (n=24) subjects were categorized into 3 groups: +P+DD (n=16; 15 females, 1 male; average age 34.9 years), −P+DD (n=16; 12 females, 4 males; average age 33.6 years), and −P−DD (n=36; 17 females, 19 males; average age 30.7 years).
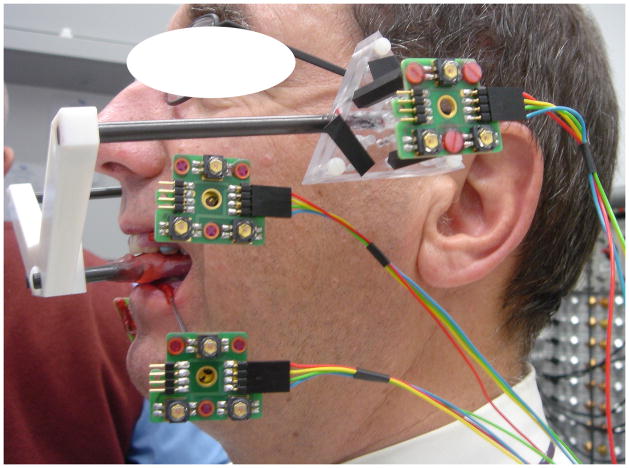
Dynamic stereometry of the TMJ was used to estimate the magnitudes of the variables used in energy density calculations. The process required the three-dimensional software reconstruction of each subject’s anatomical structures, captured from MRI, and the animation of these structures using motion tracking data (14). MRI of each subject were made from serial oblique sagittal slices perpendicular to the main condylar axis of each TMJ using a 1.5 T MRI tomographic apparatus (Siemens Magnetom™, Siemens Medical Solutions USA, Inc., Malvern, PA) with TMJ surface coils of 12 cm radius. During the process of scanning, each subject bit into a custom occlusal registration appliance that carried a head reference system (3 contrast spheres) to enable integration of MRI with recordings from jaw tracking. Static recordings were produced while each subject was biting into the occlusal appliance which carried a head reference system (Fig. 1). As well, motion recordings of the jaws (jaw tracking) were produced while each subject performed 10 symmetrical opening and closing movements. Motion tracking was possible by using an opto-electronic system (Fig. 1). Two triangular target frames, carrying 3 non-collinear light emitting diodes (LEDs) each, defined maxillary and mandibular coordinate systems. The target frames were fixed temporarily to vestibular surfaces of maxillary and mandibular canines and first premolars on one side by means of custom splints. The LEDs determined head- and mandible-related coordinate systems. The time-varying maxillary and mandibular LED positions were recorded by 3 linear cameras with fixed geometry and resolution of better than 5 μm at a sampling frequency of 200 Hz. Motion of the lower jaw was calculated relative to the head, thus, head motion was eliminated.
Fig. 1.
Opto-electronic system for jaw tracking - Three triangular target frames, carrying 3 non-collinear light emitting diodes (LEDs) each, defined reference, maxillary and mandibular coordinate systems. The target frames for the jaws were fixed temporarily to facial surfaces of maxillary and mandibular canines and first premolars on one side by means of custom splints.
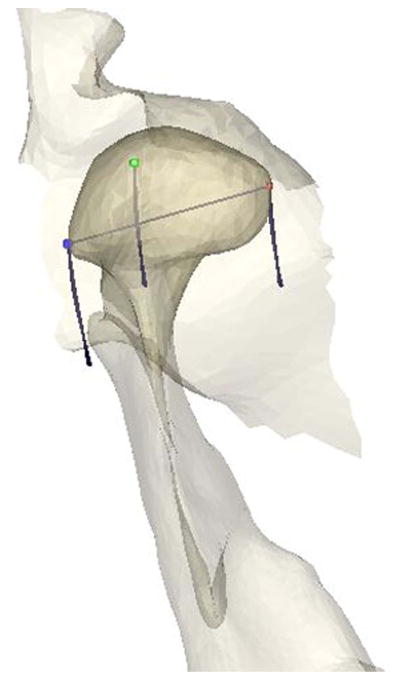
Software reconstruction and animation of the TMJ were performed on a graphics workstation by means of custom software. MR scans were segmented for extraction and vectorial description of anatomical structures as well as for determination of the centers of the reference spheres. Segmentation of the anatomy was obtained first by tracing on each MR slice object contours defined by driving points of spline functions. To construct a software model from the MR slices in 3 dimensions, the contour sets were triangulated and the resulting surfaces were represented realistically by means of shading algorithms (Fig. 2). Resolution was improved by calculating inter-slice surface points and applying a smoothing algorithm. Animation of the TMJ was achieved by means of mathematical transformations, using the computer to calculate continuously the spatial positions of all vertices of polygons describing the recorded surfaces. Tests of the system showed maximum errors of 0.9%.
Fig. 2.
TMJ Anatomy Reconstruction and Kinematics - Anatomy of the TMJ (right-side fossa, condyle, and ramus shown from superior view) was reconstructed from MR slices. MR scans were segmented for extraction and vectorial description of anatomical structures as well as for determination of the reference common to MRI and jaw tracking. Animation of the TMJ was achieved by means of mathematical transformations, using the computer to calculate continuously the spatial positions of all vertices of polygons describing the recorded surfaces. Lines depict the jaw closing paths of three landmarks: Lateral pole of condyle (blue), condylion (green) and medial pole of condyle (red).
Magnitudes of the variables of interest (aspect ratio, (a/h); compressive strain, (Δh/h); linear distance (ΔD) and velocity (V) of stress-field translation; cartilage volume (Q)) for each subject were determined from the reconstructed and animated MRI for each subject over 5 ms time intervals. The stress-field in the TMJ was located by finding the area of minimum condyle-fossa/eminence distance. For each sampling time of mandibular motion, the 30 smallest adjacent condyle-fossa/eminence distances, measured between polygon vertices, were identified. These distances were averaged to determine the minimum condyle-fossa/eminence distance or disc thickness, h. The centroid of the area defined by these 30 minimum distances was calculated and defined the mediolateral position of the stress-field, D. The standard deviation of the positions of the 30 minimum distances about the centroid was also calculated to determine the radius of the stress-field, a. The path of D was displayed graphically in a planar coordinate system representing the condylar surface. The mediolateral axis corresponded to the direction of the condylar long axis. The coordinates of the mediolateral position of D were smoothed over 30 ms, and velocity of the stress-field translation (V, mm/s) calculated for each jaw closing movement. Volume of cartilage (Q, mm3) under the leading edge of the translating stress-field was also measured. The magnitudes of these variables were used in an empirically-derived equation (15) and the results employed to determine instantaneous mechanical work and energy densities in the right and left TMJs of each subject during the jaw closing movement.
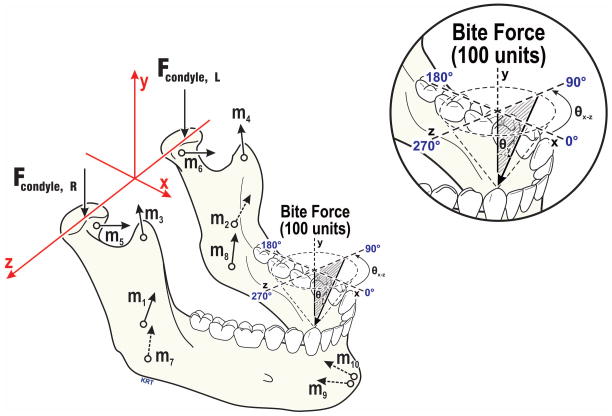
The calculation of TMJ tractional forces (Ftraction) required an estimation of the subject-specific TMJ normal (perpendicular) forces (Fnormal). To accomplish this, a computer modeling approach was used. The modeling method has been described (9,16,17). Briefly, each subject’s three-dimensional craniomandibular geometry (Fig. 3) was developed from standardized cone-beam computed tomography images. Bilateral sagittal effective eminence shapes were characterized via dynamic stereometry. These data were used in a numerical model which employed an objective function of minimization of the sum of muscle forces squared to predict contralateral (left) condyle loads consequent to 20 N vertical and non-vertical loads applied to the mandibular canine. Load vectors ranged from 0° to 40° from vertical (θy, Fig. 3), with azimuth plane angles (θxz) ranging from 0° to 350°. Computer model-predicted contralateral Fnormal were averaged for a given subject.
Fig. 3.
Craniomandibular geometry used in numerical modeling of jaw loading - The axis system and force vectors involved are illustrated for biting at right canine. The force vectors based on individual subjects’ anatomy included: TMJs (Fcondyle; R=right, L=left), and muscles representing five muscle pairs (m1,2=masseter, m3,4=anterior temporalis, m5,6=lateral pterygoid, m7,8=medial pterygoid, m9,10=anterior digastric muscles). Bite forces were modeled to mimic in vivo biting conditions, characterized by angles in the occlusal plane (θxz, 0–350°, illustrated above occlusal plane, and relative to vertical (θy, 0–40° shown as shaded, where 0° is normal to the occlusal plane). All TMJ and muscle forces required for static equilibrium were expressed relative to the 100-unit applied bite force.
Data collected from individual subjects were input to the empirically-derived equation (15) describing the relationship between stress-field geometry and dynamics, and a tractional coefficient (f=Ftraction/Fnormal). Tractional force (Ftraction) estimates were then determined using the product of the tractional coefficient and average contralateral TMJ forces for the subject (Ftraction= f×Fnormal) and used in work and energy density calculations for each of 10 jaw closing movements. Instantaneous mechanical work done (W, mJ) was calculated continuously over 5 ms intervals during cyclic movement of the mandible by the equation:
Instantaneous energy density calculations over 5 ms time intervals during cyclic movement of the mandible were accomplished using the equation:
The energy densities for the 10 jaw closing movements were averaged for each subject and then diagnostic group means were calculated. Analysis of variance, followed by Tukey-Kramer post hoc analyses tested for significant diagnostic group differences (adjusted P <0.05) in mean energy densities for jaw closing.
Results
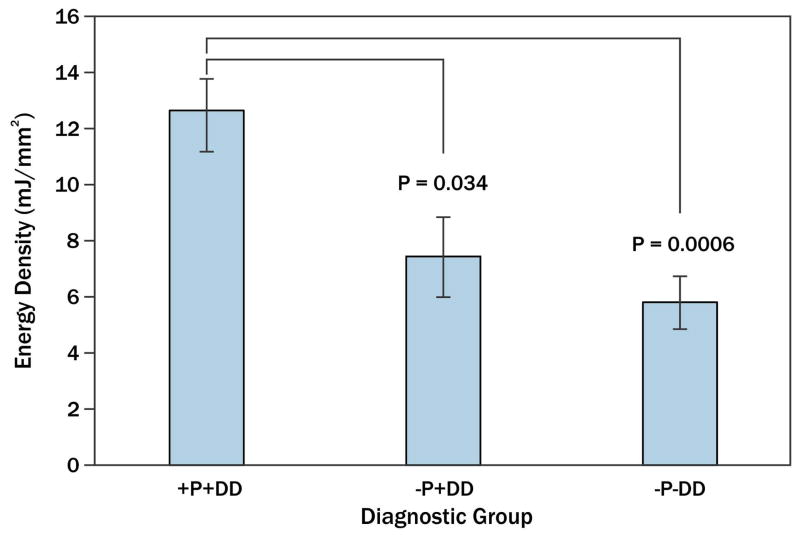
Amongst all subjects, average energy densities for 10 jaw closing movements ranged from 0.1 to 81.6 mJ/mm3. Amongst diagnostic groups, mean energy densities for jaw closing (±standard error) were: 12.7±1.5 mJ/mm3 for the +P+DD group, 7.4±1.4 mJ/mm3 for the −P+DD group, and 5.8±0.9 mJ/mm3 for the −P−DD group. Mean energy densities for the +P+DD group were significantly higher compared to −P+DD (p=0.034) and −P−DD (p=0.0006) groups (Fig. 4), while those for the −P+DD and −P−DD groups were not significantly different (p=0.61).
Fig. 4.
TMJ energy densitites in three TMD diagnostic groups – Mean energy densities for subjects with (+) and without (−) pain (P) and disc displacement (DD) are shown, where vertical lines indicate standard errors above and below the means. Results for the +P+DD groups were significantly higher compared to −P+DD (p=0.034) and −P−DD (p=0.0006) groups.
Discussion
Due to the lack of vascularity of the TMJ disc, the movement of solutes throughout the TMJ disc matrix is determined by osmotic pressure for fluid absorption, and mechanical loading for exudation. Higher cell density and nutrient consumption rates in the TMJ disc, compared to hyaline cartilage and the intervertebral disc, make the TMJ disc fibroblasts vulnerable to oxidative stress (3,18). Stress-field translation related plowing forces (2,15) move fluids through the disc to ensure adequate nutrition to disc fibroblasts. However, energy densities of sufficient magnitude potentiate the fatigue of the collagen fibers of the disc. The significantly higher energy densities in +P+DD subjects may be a unique contributing mechanism for mechanical fatigue of the TMJ which resulted in the disc displacement in this diagnostic subgroup.
Although there were no significant differences in energy densities between −P+DD and −P−DD subjects, the trend to slightly higher values in −P+DD subjects likely reflected the effect of higher TMJ loads in −P+DD subjects. Previous work reported that during normal function, TMJ loads in −P+DD subjects were 40 to 60% higher for similar biting conditions compared to +P+DD and −P−DD subjects (9). In addition, new data suggest that frequency of loading may be different amongst diagnostic groups; specifically, there is evidence that chronic low-level loading of the mandible is more prevalent in −P+DD women (19,20). Given group differences in contact mechanics, and differences in loading behaviors, it is possible that distinct variables contribute to fatigue of TMJ discs in TMD diagnostic subgroups.
A limitation of the current study is that no analyses of gender effects could be conducted because of the lower frequency of male compared to female participants in the +P+DD and −P+DD groups. Whether or not the number of males in the −P-DD group may have contributed to significantly lower energy densities of the diagnostic group requires further scrutiny. Future studies are needed to investigate gender differences in TMJ energy densities. In addition, longitudinal follow-up of currently healthy individuals with relatively high and low energy densities could reveal whether or not these individuals have different risks for development of TMD.
Conclusions
Diagnostic group differences in mechanical energy densities suggest that mechanical work in general, and energy density (mJ/mm3) specifically, may be a unique mechanism of cartilage fatigue in TMD subjects with pain and disc displacement.
Clinical Relevance.
Articular cartilage failure may be related to a mechanical fatigue process. The precocious development of degenerative joint disease of the TMJ, compared to post-cranial joints such as the knee, may be due to a unique mechanism which concentrates mechanical work per unit volume of the TMJ disc during normal function. The findings of this study suggest that in patients with myofascial or TMJ pain and bilateral disc displacement, average energy densities are more than twice those seen in healthy individuals, and may be a unique mechanism contributing to cartilage fatigue in this TMD diagnostic subgroup.
Acknowledgments
The authors thank the subjects for their participation. Stefan Erni, Alessandro Gallo, Michala Čadová, Vera Colombo and Eveline Studer contributed to computer programing, and data analysis and management at University of Zurich. Khawaja S. Nasir helped in subject recruitment and diagnosis at the University at Buffalo. This project was supported by NIDCR (R01 DE016417, JN-PI).
References
- 1.Spilker RL, Nickel JC, Iwasaki LR. A biphasic finite element model of in vitro plowing tests of the temporomandibular joint disc. Ann Biomed Eng. 2009;37:1152–64. doi: 10.1007/s10439-009-9685-2. [DOI] [PubMed] [Google Scholar]
- 2.Guo H, Nickel JC, Iwasaki LR, Spilker RL. An augmented Lagrangian method for sliding contact of soft tissue. J Biomech Eng. 2012;134:084503-1–6. doi: 10.1115/1.4007177. [DOI] [PMC free article] [PubMed] [Google Scholar]
- 3.Shi C, Kuo J, Bell PD, Yao H. Anisotropic solute diffusion tensor in porcine TMJ discs measured by FRAP with spatial Fourier analysis. Ann Biomed Eng. 2010;38:3398–408. doi: 10.1007/s10439-010-0099-y. [DOI] [PMC free article] [PubMed] [Google Scholar]
- 4.Nickel JC, Iwasaki LR, Gallo LM, Palla S, Marx DB. Tractional forces, work, and energy densities in the human TMJ. In: Kapila SD, McNamara JA, editors. Temporomandibular Disorders and Orofacial Pain - Separating Controversy from Consensus. Ann Arbor, MI: Needham Press; 2009. pp. 427–50. [PMC free article] [PubMed] [Google Scholar]
- 5.Allen KD, Athanasiou KA. Viscoelastic characterization of the porcine temporomandibular joint disc under unconfined compression. J Biomech. 2006;39:312–22. doi: 10.1016/j.jbiomech.2004.11.012. [DOI] [PubMed] [Google Scholar]
- 6.Beatty MW, Nickel JC, Iwasaki LR, Leiker M. Mechanical response of the porcine temporomandibular joint disc to an impact event and repeated tensile loading. J Orofac Pain. 2003;17:160–6. [PubMed] [Google Scholar]
- 7.Juran CM, Dolwick MF, McFetridge PS. Shear mechanics of the TMJ disc: relationship to common clinical observations. J Dent Res. 2013;92:193–8. doi: 10.1177/0022034512468749. [DOI] [PMC free article] [PubMed] [Google Scholar]
- 8.Tanaka E, Hirose M, Yamano E, Dalla-Bona DA, Fujita R, Tanaka M, et al. Age-associated changes in viscoelastic properties of the bovine temporomandibular joint disc. Eur J Oral Sci. 2006;114:70–3. doi: 10.1111/j.1600-0722.2006.00265.x. [DOI] [PubMed] [Google Scholar]
- 9.Iwasaki LR, Crosby MJ, Marx DB, Gonzalez Y, McCall WD, Jr, Ohrbach R, et al. Human temporomandibular joint eminence shape and load minimization. J Dent Res. 2010;89:722–7. doi: 10.1177/0022034510364492. [DOI] [PMC free article] [PubMed] [Google Scholar]
- 10.Ateshian GA, Lai WM, Zhu WB, Mow VC. An asymptotic solution for the contact of two biphasic cartilage layers. J Biomech. 1994;27:1347–60. doi: 10.1016/0021-9290(94)90044-2. [DOI] [PubMed] [Google Scholar]
- 11.Linn FC. Lubrication of animal joints. I. The arthrotripsometer. J Bone Joint Surg. 1967;49:1079–98. [PubMed] [Google Scholar]
- 12.Dworkin SF, LeResche L. Research diagnostic criteria for temporomandibular disorders: review, criteria, examinations and specifications, critique. J Craniomandib Disord. 1992;6:301–55. [PubMed] [Google Scholar]
- 13.Ahmad M, Hollender L, Anderson Q, Kartha K, Ohrbach R, Truelove EL, et al. Research diagnostic criteria for temporomandibular disorders (RDC/TMD): development of image analysis criteria and examiner reliability for image analysis. Oral surgery, oral medicine, oral pathology, oral radiology, and endodontics. 2009;107:844–60. doi: 10.1016/j.tripleo.2009.02.023. [DOI] [PMC free article] [PubMed] [Google Scholar]
- 14.Gallo LM. Modeling of temporomandibular joint function using MRI and jaw-tracking technologies--mechanics. Cells Tissues Organs. 2005;180:54–68. doi: 10.1159/000086199. [DOI] [PubMed] [Google Scholar]
- 15.Nickel JC, Iwasaki LR, Beatty MW, Marx DB. Tractional forces on porcine temporomandibular joint discs. J Dent Res. 2009;88:736–40. doi: 10.1177/0022034509340161. [DOI] [PubMed] [Google Scholar]
- 16.Iwasaki LR, Crosby MJ, Gonzalez Y, McCall WD, Marx DB, Ohrbach R, et al. Temporomandibular joint loads in subjects with and without disc displacement. Orthop Rev (Pavia) 2009;1:90–93. doi: 10.4081/or.2009.e29. [DOI] [PMC free article] [PubMed] [Google Scholar]
- 17.Nickel JC, Gonzalez YM, McCall WD, Ohrbach R, Marx DB, Liu H, et al. Muscle Organization in Individuals with and without Pain and Joint Dysfunction. J Dent Res. 2012;91:568–73. doi: 10.1177/0022034512445909. [DOI] [PMC free article] [PubMed] [Google Scholar]
- 18.Kuo J, Wright GJ, Bach DE, Slate EH, Yao H. Effect of mechanical loading on electrical conductivity in porcine TMJ discs. J Dent Res. 2011;90:1216–20. doi: 10.1177/0022034511415275. [DOI] [PMC free article] [PubMed] [Google Scholar]
- 19.Iwasaki LR, Gonzalez YM, Marx DB, Gallo LM, CNJ Masticatory muscle duty factors in humans. Orthod Craniofac Res. doi: 10.1111/ocr.12085. in press. [DOI] [PMC free article] [PubMed] [Google Scholar]
- 20.Raphael KG, Janal MN, Sirois DA, Dubrovsky B, Wigren PE, Klausner JJ, et al. Masticatory muscle sleep background electromyographic activity is elevated in myofascial temporomandibular disorder patients. J Oral Rehabil. 2013;40:883–91. doi: 10.1111/joor.12112. [DOI] [PMC free article] [PubMed] [Google Scholar]


