

Summary
Background
The aim of the study was to analyse MR images of the brain, including advanced MR techniques, such as single voxel spectroscopy (MRS) and diffusion tensor imaging (DTI), in children with X-linked adrenoleukodystrophy (X-ALD) before and after haematopoietic stem cell transplantation (HSCT) and to establish the imaging criteria which may be helpful in the assessment of disease staging, qualification to HSCT and follow-up.
Material/Methods
Seven boys, aged 5–10 years, (mean 8.14 years) with biochemically proved X-ALD, underwent plain MR imaging with a 1.5 T unit before and after HSCT. Structural images were analyzed using an MRI severity scale (Loes scale). In one patient the follow-up examinations included MRS with the assessment of metabolite ratios (NAA/Cr, Cho/Cr, mI/Cr), as well as DTI with evaluation of fractional anisotropy (FA) and apparent diffusion coefficient (ADC) in several white matter tracts.
Results
Two boys had an MRI severity score before HSCT equal to <8 points, and after HSCT they showed no clinical or radiological progression. In 5 patients with a higher severity score (from 8 to 16 points, mean 10.9) before HSCT, clinical and radiological progression was observed (MRI severity score from 17 to 25 points, mean 20.9). Follow-up advanced MRI techniques in one boy showed metabolic alterations, as well as decreased FA and ADC values in all evaluated areas.
Conclusions
Children at an early stage of X-ALD (below 8 points in MRI severity scale) are more likely to benefit from HSCT. DTI and MRS seem to be more useful imaging methods to assess the progression of X-ALD.
MeSH Keywords: Adrenoleukodystrophy, Diffusion Tensor Imaging, Magnetic Resonance Imaging, Magnetic Resonance Spectroscopy
Background
X-linked adrenoleukodystrophy (X-ALD) is caused by a defective transporter protein (ABCDP) in the peroxisomal β-oxidation, which results in the accumulation of very long-chain fatty acids (VLCFA) in tissues (white matter of the central nervous system, adrenal cortex, testes) and blood. X-ALD diagnosis is based on the detection of VLCFA levels in blood [1–3]. Children with early-stage X-ALD could benefit from haematopoietic stem cell transplantation (HSCT) which may decrease the neurologic symptoms [1,4]. The most important clinical dilemma is to find out the subgroup of patients who are most likely to benefit from this treatment.
An MRI severity scoring system, called the “Loes scale”, has been used for the evaluation of cerebral changes in patients with X-ALD before HSCT, as well as to follow up disease progression [5]. This MRI Severity Scale evaluates the degree and extent of pathological hyperintense regions in conventional MR images, such as T2-weighted images and FLAIR (fluid-attenuated inversion recovery sequence) images [5]. This scale does not include the advanced MR techniques for evaluation of cerebral alterations in patients with X-ALD.
It is well known that advanced MR techniques, such as magnetic resonance spectroscopy (MRS) and diffusion tensor imaging (DTI) allow for in vivo assessment of the cerebral metabolic and microstructural alterations, which is much further beyond the structural MRI evaluation [6,7].
Magnetic resonance spectroscopy (MRS) has enabled the studies of certain metabolites in a variety of pathological processes that affect the central nervous system (CNS). MRS can show the changes in metabolite profiles even in normal-appearing white (NAWM) and normal-appearing grey matter (NAGM) [6,8].
Diffusion tensor imaging (DTI) provides measures of 3D anisotropic diffusion of water molecules within tissues. By measuring the fractional anisotropy (FA) and apparent diffusion coefficient (ADC) parameters, it is possible to delineate the characteristic changes in brain tissues at the level of the cellular microarchitecture, as well as to show the changes in NAWM and NAGM that are not visible on plain MRI [7,9]. These advanced MR techniques may offer a potentially unique insight into pathophysiology of CNS involvement in patients with X-ALD.
The purpose of our study was to analyse MR images of the brain, including advanced MRI techniques, such as single voxel spectroscopy (MRS) and diffusion tensor imaging (DTI) in children with X-ALD, before and after HSCT. We also aimed to establish the imaging criteria which may be helpful in the assessment of disease staging, qualification to HSCT and follow-up. Additionally, we attempted to evaluate the possible correlations between MRI examinations and the clinical data such as clinical outcomes of the study patients and the laboratory findings (VLCFA levels).
Material and Methods
Patients
Seven boys, aged 5–10 years, (mean age 8.14 years) with biochemically proved X-ALD, were enrolled in the study. The diagnosis of X-ALD was based on the neurological symptoms, magnetic resonance imaging findings, elevated level of VLCFA in blood samples, and family screening. The pre-transplant duration of neurological symptoms in symptomatic patients ranged from 2 to 7 years. One of the patients was asymptomatic (patient 1), another one (patient 2) was diagnosed owing to X-ALD diagnosis confirmation in his brother (that patient had also neurological disturbances due to congenital cytomegalovirus [CMV] infection).
All boys underwent allogeneic HSCT, 5 boys from among matched unrelated donors, and two from among matched sibling donors. The mean age at the time of HSCT for patients with X-ALD was 8.14 years (ranging from 5 to 10 years). Sibling donors were evaluated for VLCFA levels and accepted only if the acid levels remained within the normal range. Two patients (1 and 3) were subjected to transplantation twice because of graft rejection. Conditioning regimens were as follows: busulfan (Bu)/cyclophosphamide (Cy)-based in 2 cases, treosulfan (Treo)/fludarabine (Flu)/Cy-based in 3 cases, and Treo/Cy-based in other cases. Acute Graft versus Host Disease (aGvHD) prophylaxis included either antithymocyte globulin (ATG) plus cyclosporine A (CSA)/methotrexate (Mtx) – in HSCT from unrelated donors or ATG/CSA – in HSCT from matched related donors.
The clinical characteristics of the study group are shown in Table 1.
Table 1.
The clinical characteristics of the study group.
| Patient | Clinical symptoms before HSCT | Age at HSCT, years | Alive/post-HSCT follow-up, years | VLCFA before HSCT | VLCFA after HSCT | |||
|---|---|---|---|---|---|---|---|---|
|
| ||||||||
| C24:0/C22:0 | C26:0/C22:0 | Time from HSCT | C24:0/C22:0 | C26:0/C22:0 | ||||
| Patient 1 (9-y.o.) | Asymptomatic | 8.5 | 8 | 1.586 | 0.063 | 8 m | 1.422↓ | 0.032↓ |
| 9.5 | 7 | 3 y | 1.355↓ | 0.022↓ | ||||
|
| ||||||||
| Patient 2 (5-y.o.) | X-ALD found in brother | 4.7 | 5.8 | 1.959 | 0.134 | 1.5y | 1.535↓ | 0.080↓ |
| 4 y | 1.511↓ | 0.075↓ | ||||||
| 5 y | 1.503↓ | 0.054↓ | ||||||
|
| ||||||||
| Patient 3 (7-y.o.) | Since 6th y. | 6.5 | Progression and death | 1.578 | 0.060 | 2 m | 0.079↓ | 0.017↓ LO |
| 6.8 | ||||||||
|
| ||||||||
| Patient 4 (10-y.o.) | Since 7th y. | 10.8 | 4.3 | 1.575 | 0.049 | 10 m | 0.968↓ | 0.030↓ LO |
| 6 m | 1.468↓ | 0.103↑ | ||||||
|
| ||||||||
| Patient 5 (8-y.o.) | Since 7th y. | 7.8 | 5.8 | 1.733 | 0.075 | 4 y | 2.01↑ | 0.100↑ |
| 5 y | 1.913↑ | 0.123↑ | ||||||
|
| ||||||||
| Patient 6 (8-y.o.) | Since 7th y. | 8.5 | 6.5 | 1.702 | 0.070 | 8 m | 1.112↓ | 0.040↓ |
| 1 y | 0.608↓ | 0.017 ↓LO | ||||||
|
| ||||||||
| Patient 7 (10-y.o.) | Since 2nd y. | 10.3 | 10.4 | 1.492 | 0.033 | 8 m | 1.274↓ | 0.020↓ |
VLCFA – very long chain fatty acids; VLCFA level within normal limits: C24: 0/C22: 0 <0.960, C26: 0/C22: 0 <0.030. ↑ – increase of VLCFA levels after HSCT; ↓ – decrease of VLCFA levels after HSCT; y – year(s); o – old; m – month(s); LO – patient treated with the Lorenzo’s oil; HSCT – haematopoietic stem cell transplantation.
The study was conducted in accordance with the guidelines of the local University Ethics Committee for conducting research involving humans. Parents or legal guardians of all patients provided their signed informed consent to participate in the examination.
Blood samples
Blood samples of 1–2 mL were taken from patients after a 12-hour overnight fast. The next step was centrifugation for 4 minutes at 3000 g. The serum was separated and stored frozen at −20°C before the analysis [10].
VLCFA analysis
Analysis of VLCFA levels, as the methyl esters, was carried out in accordance with the method described by Stradomska TJ [10].
Serum VLCFA levels (C26:0, C24:0, C22:0) were determined by a gas chromatography technique. Fat acids were esterified with a mixture of methanol and acetyl chloride. The fatty acid methyl esters were extracted in the next step with hexane and separated by capillary column gas chromatography using a Hewlett Packard 5890 series II GC equipped with a capillary column (OV-1 30 m, 0.25ID). The ionization detector was flamed. The programmed separation included an initial temperature of 140°C for 1 minute, followed by an incremental increase of 8°C/min to 280°C for 10 minutes. Concentrations of VLCFA were calculated with HP-Chem-Station Software (Hewlett Packard) with tricosanoic acid as an internal standard. Identification of the fatty acid methyl esters was performed by using commercially available fatty acid standards (Sigma Chemical Co, St. Louis, Mo., USA) [10].
MR imaging protocol
MR imaging was performed on a 1.5 T Signa Hdx scanner (GE Healthcare, Medical System) using a 16-channel coil dedicated for head and spine imaging. In 2 boys MRI examinations were performed under general anesthesia due to their young age (5 and 7 years). All children underwent plain MR imaging before and after HSCT.
Conventional sequences included: axial, sagittal and coronal T2-weighted images, axial T1-weighted and FLAIR (fluid-attenuated inversion recovery sequence) images, diffusion-weighted imaging (DWI), as well as 3D FSPGR (fast spoiled gradient-echo) T1-weighted images after contrast administration.
MR Severity Scale
For the analysis of MR images we used the MRI Severity Scale, which was designed for X-ALD by Loes DJ et al. [5]. In this scale different brain regions are assessed, including: parieto-occipital white matter (WM), anterior temporal WM, frontal WM, corpus callosum, basal ganglia, cerebellum, as well as visual pathway, auditory pathway, and projection fibers (Table 2). Global atrophy is also evaluated in the MRI Severity Scale. Each region was scored as 0 if normal, 0.5 if unilateral involvement was present, and 1 if the lesion or atrophy was bilateral. The maximum severity score is 34; a score of ≥1 is considered abnormal.
Table 2.
MRI Severity Scale [5].
|
Parieto-occipital WM (maximum 4) Anterior temporal WM (maximum 4) Frontal WM (maximum 4)
|
Visual pathway (maximum 4)
|
Corpus callosum (maximum 5)
|
Auditory pathway (maximum 4)
|
| Basal ganglia (maximum 1) |
Projection fibers (maximum 2)
|
Cerebellum (maximum 2)
|
Global atrophy (maximum 4)
|
Each region is scored as 0 if normal, 0.5 if unilateral involvement is present, and 1 if the lesion or atrophy is bilateral. The maximum severity score is 34; a score of ≥1 is considered abnormal. WM – white matter.
Magnetic resonance spectroscopy (MRS)
In one boy (patient 3) the MRS examination was performed after 4 and 11 weeks following HSCT, using the Single Voxel Spectroscopy (SVS) technique (PRESS sequence). The data acquisition parameters were as follows: TR=1500 ms, TE=35 ms, number of acquisitions – 128, time of acquisition – 3 min 45 s.
Using the localizing axial T2-weighted images of the brain, two voxels of 2×2×2 cm (8 cm3) were placed in the grey and white matter. The voxels were located in the following 2 regions: within the normal-appearing grey matter of the anterior cingulate gyrus – ACG (Figure 1A) and within the affected white matter region of the left parietal lobe – PWM (parietal white matter) (Figure 1B). The total acquisition time was 3 min 45 s for each voxel. MRS data were post-processed using algorithms provided by the manufacturer (GE workstation, ADW 4.4). Each spectrum was automatically fitted to four peaks corresponding to the levels of N-acetylaspartate (NAA) (2.02 ppm), total creatine (Cr) (3.03 ppm), choline-containing compounds (Cho) (3.23 ppm) and myo-inositol (mI) (3.56 ppm). Ratios of NAA, Cho, and mI to creatine (NAA/Cr, Cho/Cr, mI/Cr, respectively) were calculated and analyzed.
Figure 1.

Representative T2-weighted images (transverse cross-section) indicating voxel locations. Single-voxel magnetic resonance spectroscopy was performed in two regions: within the normal-appearing grey matter of the anterior cingulate gyrus – ACG (A) and within the affected white matter region of the left parietal lobe – PWM (parietal white matter) (B).
Diffusion Tensor Imaging (DTI)
One boy underwent DTI examinations at 4 and 11 weeks following HSCT. DTI studies were performed using a single-shot SE-EPI sequence in 25 coding directions with the following parameters: TR 8500 ms, TE 100 ms, matrix 128×128, FOV 24×24 cm, number of acquisitions=2, b values 0 and 1000 s/mm2. Axial 5-mm-thick slices with no spacing were obtained. The total acquisition time was 7 min 29 s. DTI data were post-processed on commercial workstations (GE Healthcare, ADW 4.4.) using Functool software to generate color-coded and parametric maps of FA and ADC. FA, as well as ADC measurements were obtained using small, circular ROIs (size 51 mm2) within the selected white matter fibers under control of color-coded maps. The evaluated fibers were defined using available anatomy atlases and publications [11]. FA and ADC measurements were performed on axial slices within fourteen white matter fiber tracts. The association fibers included inferior longitudinal fasciculi (ILFs) at the level of the midbrain, inferior fronto-occipital fasciculi (IFOFs) at the level of inferior aspects of the thalami laterally to the occipital horns of the lateral ventricles, superior longitudinal fasciculi (SLFs) at the level of superior aspects of the lateral ventricles and bilateral posterior cingulum (PC) fibers. The assessed commissural tracts included the genu (GCC) and splenium (SCC) of the corpus callosum at the level of the basal ganglia (Figure 2). The examined projection tracts included posterior limbs of the internal capsules (PLICs) and middle cerebellar peduncles (MCPs).
Figure 2.

Diffusion tensor imaging. Examples of measurements within the corpus callosum at the level of the basal ganglia, small ROIs within the genu (green ROI) and splenium (red ROI) of the corpus callosum are visible: on a colour-coded map (A), FA map (B), as well as ADC map (C).
Results
The level of VLCFA
The VLCFA before and after HSCT is presented in Table 1. In two asymptomatic boys (patient 1 and 2) VLCFA levels, mainly as C26:0/C22:0 decreased by 40–60% and remained at that level at 3 and 5 years after transplantation. Two boys (patient 6 and 7) showed reduction of C24:0/C22:0 and C26:0/C22:0 ratios of about 40%. In patient 6, after initial improvement, neurological deterioration was observed, and that is when the Lorenzo’s oil (LO) was implemented, which had been a known factor biochemically decreasing serum VLCFA levels. In patients 3 and 4, the Lorenzo’s oil was administrated after HSCT, which caused a decrease in the C24:0/C22:0 and C26:0/C22:0 parameters to normal values. Patient 5 showed a slight decrease in VLCFA levels after HSCT, but subsequently a severe increase of VLCFA levels even above the output levels was observed.
Reduction of VLCFA levels after HSCT correlated with MRI results in (patient 1 and 2) and their increase, in turn, correlated with MRI severity score and clinical progression in patient 5. Patients 3,4 and 6 after transplantation were treated with LO, which resulted in the reduction of these biomarker levels, independently of conducted HSCT. One of 7 patients in that study (patient 3) died after HSCT because of progression of the disease.
Plain MR imaging findings
In one boy, X-ALD was incidentally diagnosed in MRI examination performed after head trauma. In one patient, suspicion of X-ALD was raised due to the disease found in the older brother and the MRI study confirmed the diagnosis afterwards. In the other 5 children the MRI examinations were performed because of neurological symptoms.
In 6 patients, MR imaging showed changes typical for X-ALD in the occipitoparietal white matter, 1 boy (patient 4) had involvement of the frontal lobe, which was recognised as atypical X-ALD (Figure 3).
Figure 3.

MR imaging, axial T2-weighted image (A), axial T1-weighted image after contrast administration (B). Patient 4 revealed involvement of both frontal lobes, which was recognised as atypical X-ALD.
The results of the MRI Severity Scale before and after HSCT are shown in Table 3. Two boys had an MRI severity score of <8 points before HSCT and they showed no clinical or radiological progression after transplantation. In 5 other patients with a higher severity score (from 8 to 16 points, mean 10.9) before HSCT, there was clinical and radiological progression (MRI severity score from 17 to 25 points, mean 20.9).
Table 3.
The results of MRI Severity Scale before and after HSCT.
| Patient | Clinical symptoms before HSCT | MRI before HSCT – points | Clinical outcome after HSCT | MRI after HSCT – points |
|---|---|---|---|---|
| Patient 1 (9-y.o.) | Asymptomatic | 6 | No progression | 6 |
| Patient 2 (5-y.o.) | X-ALD found in brother | 7 | No progression | 7 |
| Patient 3 (7-y.o.) | Since 6th y. | 8 | Clinical progression and death | 17 |
| Patient 4 (10-y.o.) | Since 7th y. | 8.5 | Clinical progression | 16.5 |
| Patient 5 (8-y.o.) | Since 7th y. | 16 | Clinical progression | 22 |
| Patient 6 (8-y.o.) | Since 7th y. | 16 | Clinical progression | 25 |
| Patient 7 (10-y.o.) | Since 2nd y. | 16 | Clinical progression | 24 |
HSCT – haematopoietic stem cell transplantation.
In one boy (patient 3), the MRI examinations, including the advanced MRI techniques, were performed at 4 (MRS 1, DTI 1) and 11 weeks (MRS 2, DTI 2) after HSCT due to the clinical progression of the neurological symptoms and loss of vision at week 11 after HSCT. The follow-up conventional MRI examination in that boy (patient 3) performed 11 weeks after HSCT showed a reduction of pathological contrast enhancement as well as a decrease of the edema region of the white matter, which suggested regression of the active inflammatory process (Figure 4). There were signs of only mild brain cortico-subcortical atrophy present.
Figure 4.

MR imaging in patient 3, contrast-enhanced axial T1-weighted images performed 4 weeks (A) and 11 weeks (B) after HSCT. The follow-up MR examination performed 11 weeks after HSCT (B) showed a reduction of pathological contrast enhancement compared to the previous study (A).
Magnetic resonance spectroscopy (MRS) findings in initial and follow-up studies
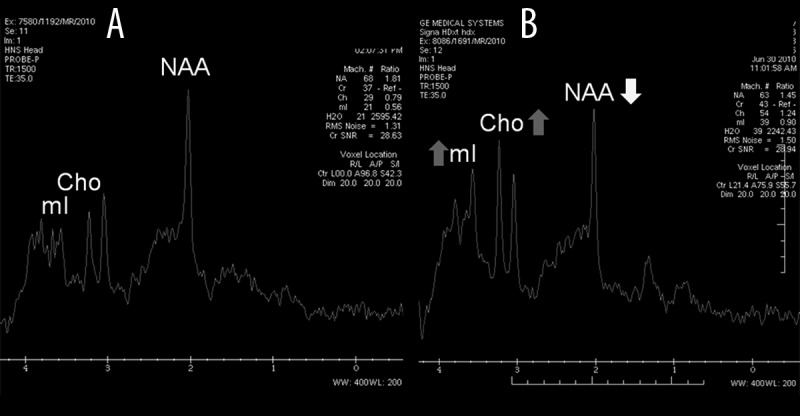
In MRS 1, we found a significantly decreased NAA/Cr ratio within the involved white matter of the left parietal lobe (PWM) (the level was as low as undetectable), increased Cho/Cr ratio (Cho/Cr=1.76), as well as increased mI/Cr ratio (mI/Cr=1.09) (Figure 5A), while the metabolite ratios within the normal-appearing grey matter of the anterior cingulate gyrus (ACG) were normal: NAA/Cr=1.81; Cho/Cr=0.79; mI/Cr=0.56 (Figure 6A).
Figure 5.

MR spectroscopy (MRS) in patient 3 performed 4 weeks (A) and 11 weeks (B) after HSCT within the parietal white matter (PWM). There was a significantly decreased NAA/Cr ratio within the involved white matter of the left parietal lobe (PWM) (the level was as low as undetectable), increased Cho/Cr ratio (Cho/Cr=1.76), as well as increased mI/Cr ratio (mI/Cr=1.09) (A). The follow-up MRS (B) showed further decrease of NAA, as well as the decrease of Cho level (NAA/Cr undetectable, Cho/Cr=1.16) and the increase of mI (mI/Cr=1.17).
Figure 6.
MR spectroscopy (MRS) in patient 3 performed 4 weeks (A) and 11 weeks (B) after HSCT within the anterior cingulate gyrus (ACG) region. The metabolite ratios within the normal-appearing grey matter of ACG were initially normal: NAA/Cr=1.81; Cho/Cr=0.79; mI/Cr=0.56 (A). Despite the normal appearance of the grey matter of ACG, the follow-up examination revealed the reduction of NAA/Cr ratio (NAA/Cr=1.45), as well as the increase of Cho/Cr and mI/Cr ratios (Cho/Cr=1.24 and mI/Cr=0.90, respectively) (B).
The follow-up MRS 2 showed further decrease of NAA, as well as the decrease of Cho level (NAA/Cr undetectable, Cho/Cr=1.16), and the increase of mI (mI/Cr=1.17) in PWM (Figure 5B). Despite the normal appearance of the grey matter of ACG we found a reduction of NAA/Cr ratio (NAA/Cr=1.45), as well as the increase of Cho/Cr and mI/Cr ratios (Cho/Cr=1.24 and mI/Cr=0.90, respectively) (Figure 6B).
Diffusion Tensor Imaging (DTI) findings in initial and follow-up studies
Table 4 shows the FA and ADC values in the selected white matter tracts in DTI examinations performed at 4 (DTI 1, FA1) and 11 weeks (DTI 2, FA2) after HSCT in patient 3.
Table 4.
FA and ADC values of the selected white matter tracts in patient 3.
| White matter tracts | FA values in patient 3 | ADC values in patient 3 [×10−3 mm2/s] | ||
|---|---|---|---|---|
| 4th week after HSCT | 11th week after HSCT | 4th week after HSCT | 11th week after HSCT | |
| Right MCP | 0.768 | 0.687 | 0.758 | 0.687 |
| Left MCP | 0.779 | 0.700 | 0.736 | 0.725 |
| Right ILF | 0.178 | 0.178 | 1.66 | 1.32 |
| Left ILF | 0.214 | 0.169 | 1.38 | 1.22 |
| Right IFOF | 0.485 | 0.398 | 0.933 | 0.825 |
| Left IFOF | 0.441 | 0.397 | 0.921 | 0.806 |
| GCC | 0.744 | 0.505 | 0.872 | 0.846 |
| SCC | 0.235 | 0.156 | 1.84 | 1.74 |
| Right PLIC | 0.544 | 0.521 | 0.842 | 0.701 |
| Left PLIC | 0.533 | 0.528 | 0.795 | 0.748 |
| Right SLF | 0.264 | 0.222 | 1.27 | 0.803 |
| Left SLF | 0.229 | 0.187 | 1.33 | 0.871 |
| Right PC | 0.262 | 0.227 | 1.10 | 0.975 |
| Left PC | 0.243 | 0.222 | 1.29 | 1.16 |
MCP – middle cerebellar peduncle; ILF – inferior longitudinal fasciculus; IFOF – inferior fronto-occipital fasciculus; GCC – genu of the corpus callosum; SCC – splenium of the corpus callosum; PLIC – posterior limb of the internal capsule; SLF – superior longitudinal fasciculus; PC – posterior cingulum; HSCT – haematopoietic stem cell transplantation.
The follow-up DTI examination (DTI 2) revealed decreased values of FA in almost all evaluated white matter tracts, with exception of the left inferior longitudinal fasciculus (ILF). The decrease of FA value was found within the genu (GCC) and splenium (SCC) of the corpus callosum, as follows: FA1 of GCC=0.744; FA2 of GCC=0.505, FA1 of SCC=0.235, FA2 of SCC=0.156. We also found decreased ADC values in all analyzed white matter tracts as shown in Table 4.
Discussion
X-ALD is one of the most common leukodystrophies. Approximately 80% of X-ALD patients exhibit CNS involvement [4]. Typically, a plain MRI examination shows a bilateral white matter lesion hyperintense on T2-weighted images, involving the periventricular and deep white matter of the posterior parietal and occipital lobes [12]. Rarely the predominantly frontal, or unilateral, or both occipital and frontal white matter involvement has been reported, and called atypical X-ALD [13]. In our study, one boy (patient 4) presented frontal white matter involvement (Figure 3).
Histopathologically, the center of the lesion is characterized by almost a complete loss of axons and myelin, accompanied by attenuated astrogliosis. Active demyelination occurs at the edge of the lesion and is associated with axonal damage and loss as well as inflammation. Outside the lesion, the white matter is apparently normal [12,14].
To date, haematopoietic stem cell transplantation (HSCT) has been shown as the only way of treatment to significantly enhance long-term survival and disease stabilization in X-ALD patients with cerebral involvement [1,4,15]. However, the most paramount thing is careful consideration by the medical team and patients’ guardians regarding the appropriateness of HSCT, especially for patients with a rapidly progressing, very severe cerebral disease with marked clinical dysfunction. It was reported that only patients with early-stage X-ALD could benefit from HSCT, which may decrease the neurological symptoms [16]. As mentioned above, the MRI severity scoring system, called the “Loes scale”, has been used for the assessment of cerebral changes in patients with X-ALD before HSCT. Moreover, Loes scores measured before HSCT have been shown to correlate with long-term outcome in patients with X-ALD. It was documented that a pre-HSCT score of <9 is associated with an overall survival rate of approximately 85%, while a score of ≥9 is associated with an overall survival rate of approximately 40% [4,16]. Regarding our results, they seem to suggest that only children with pre-transplant Loes score below 8 points could benefit from HSCT, as in our study where the stabilization of the disease (no progression) was observed in two boys who presented with Loes scores of 6 and 7. On the other hand, it should be stressed that two other patients with Loes scores of 8 and 8.5 showed disease progression after HSCT.
As mentioned above, plain MR examination has a high sensitivity for the detection of white matter abnormalities. These pathological findings associated with T2 hyperintensity of the white matter are highly variable and include hypomyelination, demyelination, axonal loss, gliosis, interstitial edema, as well as cystic white matter degeneration. Application of advanced MR techniques, such as MRS and DTI, may improve the pathological specificity of MR imaging findings. Moreover, these quantitative methods enable to show the alterations within the normal-appearing white and grey matter (NAWM and NAGM) [8,9]. However, it should be stressed that MRS results are not specific for X-ALD. This method has value in the assessment of NAWM and NAGM as well as in the evaluation of progression of the disease but not in the diagnostics.
MRS can reveal cerebral metabolic changes. The most important metabolites which are analyzed in MRS are: N-acetylaspartate (NAA), choline (Cho) and myo-inositol (mI). NAA is a marker of neuronal health, viability and amount. The reduction of NAA is an indicator of neuroaxonal loss or dysfunction. Both Cho and mI are in vivo markers of glial cell inflammation and activation. Choline is a marker of cellular membrane turnover. Elevated levels of Cho are believed to reflect cellular proliferation due to infection or inflammation. On the other hand, increased mI levels are thought to be related to CNS inflammation and gliosis, which may underlie neuronal dysfunction [9,12].
In our study, we performed MRS and DTI examinations in one boy (patient 3) at 4 and 11 weeks after HSCT due to rapid disease progression. Within the involved white matter of the left parietal lobe (PWM) we found a significantly decreased NAA/Cr ratio (the level was as low as undetectable), increased Cho/Cr ratio, as well as increased mI/Cr ratio (Figure 5A). The follow-up MRS showed further decease of NAA, as well as a decrease of Cho level and the increase of mI in PWM (Figure 5B).
Our MRS findings coincide with previous reports concerning X-ALD, showing the decrease in NAA/Cr ratio within white matter lesions, which can be ascribed to axonal damage and loss, the increase in Cho/Cr ratio as related to enhanced membrane turnover associated with active demyelination [12,17,18]. The high level of mI/Cr ratio may reflect astrogliosis [12,19].
It should be stressed that despite the normal appearance of the grey matter of the anterior cingulate gyrus (ACG) at 11 weeks after HSCT we found a reduction of NAA/Cr ratio (NAA/Cr=1.45), as well as an increase of Cho/Cr and mI/Cr ratios (Cho/Cr=1.24 and mI/Cr=0.90, respectively) (Figure 6B), compared to MRS results obtained 4 weeks after HSCT (metabolite ratios as follows: NAA/Cr=1.81; Cho/Cr=0.79; mI/Cr=0.56) (Figure 6A). Similar metabolic alterations within NAWM and NAGM in patients with X-ALD have also been documented [12,17,18].
DTI enables the quantitative assessment of white matter integrity by measuring the fractional anisotropy (FA) and apparent diffusion coefficient (ADC) values. The FA parameter reflects the directionality and coherence of water self-diffusion: tissues with highly regular fibers have high anisotropy, whereas those with less regular fibers, demonstrate low anisotropy [7,9]. The ADC is an indicator of the average diffusion a water molecule experiences within a voxel and is independent of the directionality of water diffusion. For example, cerebrospinal fluid exhibits a high ADC because there are no barriers to diffusion, whereas tissues such as the white or grey matter will exhibit lower ADC because of cellular barriers to diffusion [7,9].
In our study, the follow-up DTI examination performed after HSCT revealed decreased values of FA in almost all evaluated white matter tracts, with exception of the left inferior longitudinal fasciculus (ILF). Moreover, we observed decreased FA values also within normal-appearing brain regions, for example in the genu of the corpus callosum (GCC). The FA value of GCC decreased from 0.744 to 0.505 in the follow-up DTI examination. In the literature there are some other reports showing similar changes within NAWM tracts in X-ALD [12,16]. All these findings confirmed that advanced MR techniques such as DTI and MRS can be used to monitor disease progression and effects of therapy not only in X-ALD, but also in other demyelinating disorders [12].
Furthermore, we also found decreased ADC values in all analyzed white matter tracts. Our results are in agreement with the data from the literature. It has been reported that ADC values fluctuate to a large degree for several months after HSCT, showing decreased ADC values in the early period after HSCT [12,16]. The decreased value of ADC reflects restricted diffusion, which means the presence of edema of the involved white matter in the acute stage of the disease [16].
Although we do not know the exact pathomechanism of the disease, it is believed that VLCFAs play a key role. In patient 1, 6 and 7, the decreasing VLCFA levels (down to the X-ALD heterozygote levels) were found after HSCT. Similar results in patients after successful transplantation were presented in previous studies [20–22].
VLCFA levels in patient 2 also decreased significantly (40%). However, that remained to be quite a high score. The observed increase of VLCFA levels (patient 5) after HSCT may suggest graft rejection [23] or clinical progression, which was confirmed by MRI examination.
In our study, in patient 1 and 2, the reduction of VLCFA levels after HSCT was associated with good MRI results (no changes in Loes scores, no progression of the disease). Moreover, the increase in VLCFA levels in patient 5 was also correlated with MRI severity score (increase of Loes scores from 16 before HSCT to 22 after HSCT) and clinical progression. These results suggest a direct correlation between VLCFA biomarker levels and MRI severity scores.
The introduction of LO treatment after HSCT makes accurate interpretation of the results of VLCFA impossible in these patients.
Adrenoleukodystrophy is characterized by a large variety of phenotypes, from the most severe, childhood form, to mild adrenomyeloneurophaty manifesting only in the 3rd–4th decade of life. Elevated VLCFA levels are already detected during infancy [22,24], mainly through family screening. However, there is no correlation between the genotype and phenotype; furthermore, there are no markers indicative of phenotypes which will develop in patients in the future. Therefore, it is very difficult to reliably assess treatment results in asymptomatic patients.
There are some limitations of this study. Firstly, our study included a small number of patients, which is related to the fact that X-ALD is a relatively rare disease. Moreover, the MRS and DTI values were measured in one case only, therefore we could not carry out a proper statistical analysis and our findings are not statistically significant. Nevertheless, our study is very important from a clinical point of view, especially for doctors who take care of children with X-ALD.
Conclusions
Children with early-stage X-ALD (below 8 points in the MRI Severity Scale) are more likely to benefit from HSCT, which indicates the significance of MRI in qualification of patients to HSCT. DTI and MRS seem to be more useful imaging methods to assess the progression of the metabolic disease compared to conventional MRI, and in our opinion they should be incorporated in the MRI examination protocols in patients with X-ALD. Moreover, our results suggest a direct link between VLCFA levels and MRI severity scores.
Footnotes
Conflicts of interest
We declare that we have no conflict of interest.
Source of support: Supported by Wroclaw Medical University Grant ST-591
References
- 1.Engelen M, Kemp S, Poll-The BT. X-linked adrenoleukodystrophy: pathogenesis and treatment. Curr Neurol Neurosci Rep. 2014;14(10):486. doi: 10.1007/s11910-014-0486-0. [DOI] [PubMed] [Google Scholar]
- 2.Engelen M, Kemp S, de Visser M, et al. X-linked adrenoleukodystrophy (X-ALD): clinical presentation and guidelines for diagnosis, follow-up and management. Orphanet J Rare Dis. 2012;7:51. doi: 10.1186/1750-1172-7-51. [DOI] [PMC free article] [PubMed] [Google Scholar]
- 3.Moser HW, Raymond GV, Dubey P. Adrenoleukodystrophy: new approaches to a neurodegenerative disease. J Am Med Assoc. 2005;294:3131–34. doi: 10.1001/jama.294.24.3131. [DOI] [PubMed] [Google Scholar]
- 4.Miller WP, Rothman SM, Nascene D, et al. Outcomes after allogeneic hematopoietic cell transplantation for childhood cerebral adrenoleukodystrophy: the largest single-institution cohort report. Blood. 2011;118:1971–78. doi: 10.1182/blood-2011-01-329235. [DOI] [PubMed] [Google Scholar]
- 5.Loes DJ, Fatemi A, Melhem ER, et al. Analysis of MRI patterns aids prediction of progression in X-linked adrenoleukodystrophy. Neurology. 2003;61:369–74. doi: 10.1212/01.wnl.0000079050.91337.83. [DOI] [PubMed] [Google Scholar]
- 6.Mandal PK. In vivo proton magnetic resonance spectroscopic signal processing for the absolute quantitation of brain metabolites. Eur J Radiol. 2012;81:e653–64. doi: 10.1016/j.ejrad.2011.03.076. [DOI] [PubMed] [Google Scholar]
- 7.Choudhri AF, Chin EM, Blitz AM, Gandhi D. Diffusion tensor imaging of cerebral white matter: technique, anatomy, and pathologic patterns. Radiol Clin North Am. 2014;52:413–25. doi: 10.1016/j.rcl.2013.11.005. [DOI] [PubMed] [Google Scholar]
- 8.Bladowska J, Zimny A, Koltowska A, et al. Evaluation of metabolic changes within the normal appearing gray and white matters in neurologically asymptomatic HIV-1-positive and HCV-positive patients: Magnetic resonance spectroscopy and immunologic correlation. Eur J Radiol. 2013;82:686–92. doi: 10.1016/j.ejrad.2012.11.029. [DOI] [PubMed] [Google Scholar]
- 9.Bladowska J, Zimny A, Knysz B, et al. Evaluation of early cerebral metabolic, perfusion and microstructural changes in HCV-positive patients: A pilot study. J Hepatol. 2013;59:651–57. doi: 10.1016/j.jhep.2013.05.008. [DOI] [PubMed] [Google Scholar]
- 10.Stradomska TJ, Tylki-Szymańska A, Bentkowski Z. Very long-chain fatty acids in Rett syndrome. Eur J Pediatr. 1999;158:226–29. doi: 10.1007/s004310051055. [DOI] [PubMed] [Google Scholar]
- 11.Jellison BJ, Field AS, Medow J, et al. Diffusion tensor imaging of cerebral white matter: a pictorial review of physics, fiber tract anatomy, and tumor imaging patterns. Am J Neuroradiol. 2004;25:356–69. [PMC free article] [PubMed] [Google Scholar]
- 12.Voorn JP, Pouwels PJW, Powers JM, et al. Correlating quantitative MR imaging with histopathology in X-linked adrenoleukodystrophy. Am J Neuroradiol. 2011;32:481–89. doi: 10.3174/ajnr.A2327. [DOI] [PMC free article] [PubMed] [Google Scholar]
- 13.Sener RN. Atypical X-linked adrenoleukodystrophy: new MRI observations with FLAIR, magnetization transfer contrast, diffusion MRI, and proton spectroscopy. Magnetic Resonance Imaging. 2002;20:215–19. doi: 10.1016/s0730-725x(02)00489-7. [DOI] [PubMed] [Google Scholar]
- 14.Powers JM. Demyelination in peroxisomal diseases. J Neurol Sci. 2005;15:206–7. doi: 10.1016/j.jns.2004.10.012. [DOI] [PubMed] [Google Scholar]
- 15.Barfield RC, Kasow KA, Hale GA. Advances in pediatric hematopoietic stem cell transplantation. Cancer Biol Ther. 2008;7:1533–39. doi: 10.4161/cbt.7.10.7046. [DOI] [PubMed] [Google Scholar]
- 16.McKinney AM, Nascene D, Miller WP, et al. Childchood cerebral X-linked adrenoleukodystrophy: diffusion tensor imaging measurements for prediction of clinical outcome after hematopoietic stem cell transplantation. Am J Neuroradiol. 2013;34:641–49. doi: 10.3174/ajnr.A3232. [DOI] [PMC free article] [PubMed] [Google Scholar]
- 17.Eichler FS, Itoh R, Barker PB, et al. Proton MR spectroscopic and diffusion tensor brain MR imaging in X-linked adrenoleukodystrophy: initial experience. Radiology. 2002;225:245–52. doi: 10.1148/radiol.2251011040. [DOI] [PubMed] [Google Scholar]
- 18.Eichler FS, Barker PB, Cox C, et al. Proton MR spectroscopic imaging predicts lesion progression on MRI in X-linked adrenoleukodystrophy. Neurology. 2002;58:901–7. doi: 10.1212/wnl.58.6.901. [DOI] [PubMed] [Google Scholar]
- 19.Hattingen E, Raab E, Franz K, et al. Myo-inositol: a marker of reactive astrogliosis in glial tumors? NMR Biomed. 2008;21:233–41. doi: 10.1002/nbm.1186. [DOI] [PubMed] [Google Scholar]
- 20.Suzuki Y, Isogai K, Teramoto T, et al. Bone marrow transplantation for the treatment of X-linked adrenoleukodystrophy. J Inherit Metab Dis. 2000;23:453–58. doi: 10.1023/a:1005656029200. [DOI] [PubMed] [Google Scholar]
- 21.Shapiro E, Krivit W, Lockman L, et al. Long-term effect of bone-marrow transplantation for childhood-onset cerebral X-linked adrenoleukodystrophy. Lancet. 2000;356:713–18. doi: 10.1016/S0140-6736(00)02629-5. [DOI] [PubMed] [Google Scholar]
- 22.Stradomska TJ, Tylki-Szymańska A. Serum very long-chain fatty acids levels determined by gas chromatography in the diagnosis of peroxisomal disorders. Folia Neuropathol. 2009;47:306–13. [PubMed] [Google Scholar]
- 23.Stradomska TJ, Drabko K, Moszczyńska E, Tylki-Szymańska A. Monitoring of very long-chain fatty acids levels in X-linked adrenoleukodystrophy, treated with haematopoietic stem cell transplantation and Lorenzo’s Oil. Folia Neuropathol. 2014;52:159–63. doi: 10.5114/fn.2014.43787. [DOI] [PubMed] [Google Scholar]
- 24.Zgorzalewicz-Stachowiak M, Stradomska TJ, Bartkowiak Z, Galas-Zgorzalewicz B. Cerebral childhood and adolescent X-linked adrenoleukodystrophy. Clinical presentation, neurophysiological, neuroimaging and biochemical investigations. Folia Neuropathol. 2006;44:319–26. [PubMed] [Google Scholar]