Abstract
Objectives
To characterize soft tissue facial height and width variation in Class II malocclusion and test for correlations with genes HMGA2, AJUBA and ADK.
Setting and Sample Population
Nine facial proportions were estimated from 2D frontal repose photographs of 330 Caucasian adults with Class II malocclusion.
Material & Methods
After adjustments for age and gender, the facial proportions were submitted to a principal component analyses (PCA). The most meaningful phenotypic variations were correlated with SNPS rs7924176 (ADK), rs17101923 (HMGA2), and rs997154 (AJUBA) genotyped in 106 individuals.
Results
PCA resulted in 4 principal components (PCs) which explained 75% of total variation. PC1 captured variation in the intercanthus distance and explained 28% of total variation. PC2 explained 21% of the variations in facial taper and facial index. PC3 explained 14% and reflected variations in the vertical dimension of the lower face. PC4 explained 12% and captured variations in distance between the eyes, width of the commissures, and the length of the superior aspect of the lower face height, corresponding to the vertical dimension of the philtrum of the upper lip. A suggestive association (p<0.05) was observed between PC4 and rs997154 corroborating the role of AJUBA in variation of facial dimensions.
Conclusion
2D frontal photographs can be used to derive quantitative measures of soft tissue phenotypes that are of clinical relevance. The methods described are suitable for discovery and replication of associations between genotypes and malocclusion phenotypes.
Keywords: Aesthetics, Phenotype-genotype correlations, Class II malocclusion
Introduction
Balanced facial growth is essential for a symmetric, well-proportioned face and normal occlusion. Understanding the mechanisms contributing to developing balanced faces will ultimately provide opportunities for prevention and innovative treatment to benefit patients with facial dismorphology.
Human malocclusion is a heterogeneous entity with multifactorial etiology. In about 4% of the population, malocclusion is severe enough that could lead to facial disproportion (1). Patients with malocclusion show large dento-facial variations affecting esthetics and function (2). The primary goal of orthodontic treatment is to reestablish the harmony between the hard and soft tissue of the craniofacial complex. However, little is understood about the etiological factors that account for the phenotype variations in craniofacial form.
Clinical records are routinely obtained from patients seeking orthodontic treatment. Cephalometric radiographs, 2D photographs and dental models have been traditionally used to develop orthodontic diagnosis and treatment plans. Such records may provide invaluable dento-facial phenotypic information for genetic studies of malocclusion etiology and facial variation.
Variation in morphology of facial soft tissues is particularly relevant as it contains all identifiable features that a person can self-perceive, as well as recognize in others. Studies using 2D soft-tissue images have reported genetic associations between upper facial height and the gene ENPP1 (3) and between the cephalic index and the gene FGFR1 (4). Genetic studies of facial variation have recently expanded through the use of 3D facial surface technologies which can capture extensive data, and by employing high-throughput genotyping technologies. Recent reports of candidate genes (5–7) and genome-wide association studies (GWAS) (8–10) of 3D facial soft tissue variation, have found associations between the genes PRDM16, PAX3, TP63, C5orf50, Col17A1, HMGA2, AJUBA and ADK with facial width and height. However, these associations only explained a small proportion of the trait variability (<10%), reflecting the complexity of etiological factors associated with soft-tissue facial variation. Consequently, studies of facial variation require very large samples to detect genetic variants with small-to-moderate effects. Another challenge with 3D data is its high dimensionality which refers to the collection of a very large number of measurements at once, which poses greater demands for large samples (11). Therefore, while 3D data consortia continue to be developed (12), large existing collections of 2D photographs may also be useful for genetic studies of simpler yet clinically relevant facial features.
Direct linear measurements from 2D photographs are of limited use due to dimensional errors caused by image projection and patient position (13). However, 2D facial phenotypes derived from proportions, angles and shape measures can still be collected with minimal errors. Such measures may capture several key components of clinically relevant features affecting overall esthetic appearance such as smile characteristics, tooth shape and proportions and overall facial balance (14). The current study focuses on overall facial balance in a frontal photographic analysis.
The frontal photographic analysis (Figure 1) includes the overall proportion of facial width to facial height (facial index), vertical facial proportions, facial taper, transverse facial proportions, and a measure of asymmetry. By convention, a face is divided vertically into equal thirds (Figure 1A). The lower third of the face is divided into an upper 1/3 consisting of the upper lip, and a lower 2/3 consisting of the lower lip and chin (Figure 1A). The rule of fifths is used to assess the transverse proportions of a face (Figure 1B). The facial taper is the proportion which compares the inter-zygomatic width to the intergonial width (Figure 1C). Normative data for facial taper have not yet been developed, but a face with some inferior taper is thought to be most attractive (14). Finally, the facial index (Figure 1D) which describes the ratio between the inter-zygomatic width to facial height (nasion to midsymphysis). The average facial index for males and females is 88.5% and 86.2% respectively (15).
Figure 1.
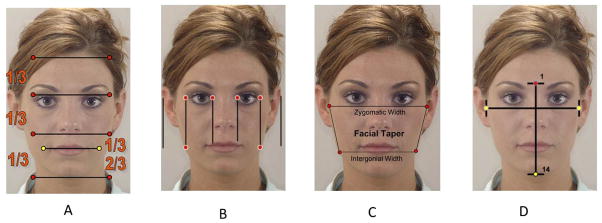
Depicts vertical evaluation utilizing the rule of thirds (A), transverse evaluation utilizing the rule of fifths (B), Facial taper (C), Facial index (D).
Imbalances in facial height and width are characteristic of both class III and class II malocclusion altering occlusion between the dental arches and patient esthetics (16–18). Little is known about the etiology of facial height and width imbalances. Accurate measurement of such imbalances is essential for diagnosis, treatment planning, and for studies of genetic etiology of clinical phenotypes.
In this study, we described a comprehensive characterization of facial soft-tissue height and width proportions in patients with class II malocclusion based on frontal photo analyses. Additionally, we correlated the phenotypic variations measured with selective candidate genes previously reported to be associated with facial height and width.
Materials and Methods
The study protocol was reviewed and approved by the Institutional Review Board at the University of Iowa.
Study Sample
The study sample included adult class II patients who were seeking treatment at the University of Iowa Orthodontic Graduate Clinic, the University of Iowa Hospital Dentistry Clinic and at surrounding private practice orthodontic clinics. The sample consisted of 330 Caucasian adult subjects (79 males, 251 females; age range 16–62 years and median age of 24 years) who met eligibility criteria (Table 1). A convex profile was determined by measuring the internal angle between a line from the bridge of the nose to the base of the upper lip and a line from the base of the upper lip to the chin. A smaller angle and a forward-positioned upper jaw relative to the chin indicated a convex profile.
Table 1.
Sample selection criteria
| Inclusion Criteria | Exclusion Criteria |
|---|---|
| Adult (female ≥ 16 years, male ≥ 18 years) | |
| At least 2 of the following clinical criteria required: | History of severe facial trauma |
| ANB ≥ 4 | Previous orthodontic treatment |
| Overjet ≥ 4 | Presence of facial syndromes |
| Angle CII molar or canine relationship on at least one side | Missing or poor quality records |
| Convex profile |
Photographic Analysis
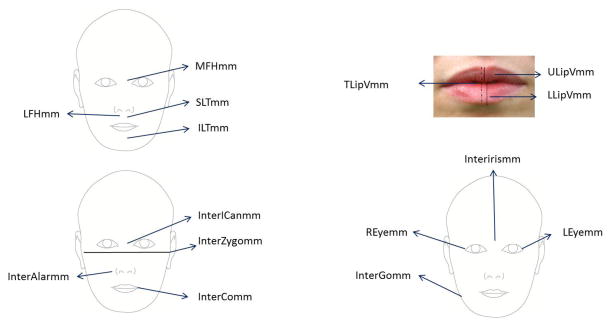
2D pre-treatment extraoral photographs of 330 Class II adults were imported into Dolphin Imaging, version 11.0 (Dolphin Imaging Systems, Chatsworth, Calif). Non-digital photographs were scanned and imported into Dolphin Imaging at the highest resolution necessary for good image quality. All digital photographs were imported into Dolphin Imaging at 300 dpi. A total of fifteen measures were made on frontal repose photographs (Figure 2). After the measurements were recorded, vertical and transverse facial proportions were calculated and submitted for statistical analyses (Table 2).
Figure 2.
Shows 15 vertical and transverse facial measurements obtained from the frontal repose photographs in this study.
Table 2.
Fourteen Facial proportions estimated from 15 facial measurements
| Facial Proportions | Definitions |
|---|---|
| * MFH/TFH% | MidFace Height % of Total Face Height (Nasion-Subnasale / Nasion-Gnation) |
| LFH/TFH% | LowerFace Height % of Total Face Height (Subnasale-Gnation / Nasion-Gnation) |
| SLT/LFH% | Superior Lower Third % LowerFace Height (Subnasale-Stomion / Subnasale-Gnation) |
| * ILT/LFH% | Inferior Lower Third % LowerFace Height (Stomion-Gnation / Subnasale-Gnation) |
| * ILGap% | InterLabial Gap % (Measured Total Lip Vermillion / Sum Total Lip Vermillion) |
| REye/TotalTvD% | Right Eye % of Total Transverse (Right OuterCanthus - Right InnerCanthus) / (Right OuterCanthus - Left OuterCanthus) |
| * InterICan/TotalTvD% | InterInnerCanthus % Total Transverse (Right InnerCanthus - Left InnerCanthus) / (Right OuterCanthus - Left OuterCanthus) |
| LEye/TotalTvD% | Left Eye % of Total Transverse (Left InnerCanthus - Left OuterCanthus) / (Right OuterCanthus - Left OuterCanthus) |
| InterICan/InterAlar% | InterInnerCanthus % InterAlar |
| InterIris/InterCommm% | InterIris Distance % InterCommissure Distance |
| InterOCan/InterGo% | InterOuterCanthus Distance / InterGonial Distance. |
| * MxMidDev% | Maxillary Midline Deviation % - [mm distance from distal of central incisor to midline vertical (a vertical line from subnasal through cupids bow) / m-d width of central incisor on side of deviation] |
| FacialIndex% | Facial Index (%) (Facial Index Width/Facial Index Height) |
| FacialTaper% | Facial Taper %(InterZygion distance / InterGonion distance) |
Five facial proportions removed prior to principal component analysis due to lack of variation and colinearity.
Statistical Methods
Analyses were primarily performed using SAS for Windows (v9.3, SAS Institute Inc, Cary, NC, USA); adjusted residuals and violin plots were created using R 3.1.0 software (19)(A type I error of 0.05 was assumed throughout.
Method Error
Photographs from 15 random individuals with Class II malocclusion were chosen to be measured two times at least two weeks apart by the same rater (A.R.). The intra-rater reliability of facial and dental landmark location and the resulting facial and dental proportions was assessed via the intraclass correlation as described by Shrout and Fleiss (20,21). Recalibration procedures were performed, and reliability testing was conducted until an ICC value >0.75 was achieved.
Phenotyping - Covariate Adjustment and Principal Component Analysis
After 15 measurements were collected on the frontal photographs, 14 vertical and horizontal facial proportions were estimated for statistical analyses (Table 2). Normality assumptions were assessed via the Shapiro-Wilk test and normalizing transformations were applied as necessary. Two of these variables (ILGap%, MixMid Dev%) were removed from analyses due to lack of variation. Three more variables (MFHmm, ILTmm and InterICanmm) were removed due to problems with high correlation and redundancy. Therefore, 9 remaining facial proportions (Table 2) were adjusted for the effects of age and gender and age by gender interactions and subsequently submitted to principal components analysis to derive quantitative soft tissue phenotypes.
Genetic analyses
Single nucleotide polymorphisms (SNPs) were genotyped via multiplex Fluidigm platforms Fluidigm Corp., South San Francisco, CA). Genotype-phenotype correlations were performed to assess the potential association between three candidate SNPs and the most informative principal components of soft tissue variation derived above. The three SNPs, rs7924176 (A/G; ADK), rs17101923 (G/T; HMGA2), and rs997154 (G/A; AJUBA) were selected for study based on Fatemifar et al (2013) (10) who found associations between these SNPS and craniofacial distances, particularly those indexing facial width as part of a genome-wide association study of primary tooth eruption.
Of the original 330 Caucasian adult sample DNA was available for 106 of these individuals. There were 22 males and 84 females aged 16–62 years (median 28 years of age). For each candidate SNP, association analyses were conducted under four genetic models: Firstly a general test of association was completed to compare the distribution of the quantitative outcome of interest (principal component or sex-and-age adjusted facial ratio) for the three groups defined by genotype. The nonparametric Kruskal-Wallis test was used to perform this first test of association. A second test of association used an “additive” model, which assessed whether there was a correlation of the quantitative phenotype of interest with the number of copies of the minor allele. Spearman and Pearson correlations were used where the nonparametric Spearman correlation assessed increasing or decreasing relationships. The Pearson correlation tested the assumption of a linear relationship between the number of copies of the minor allele and the mean response for the phenotypic outcome. A third test of association compared the distribution of the outcome of interest for two groups defined using an autosomal dominant model based on the presence of at least one copy of the minor allele. As an example, the autosomal dominant model of SNP rs997154 (G/A) compared the phenotypic outcome for GG individuals with those having either the GA or AA genotype. The nonparametric Wilcoxon Rank Sum (Wilcoxon-Mann-Whitney) test was used to determine whether or not there was an association. The fourth and final test of association compared the distribution of the outcome of interest for two groups defined using a recessive model based on the presence of two copies of the minor allele. As an example, for SNP rs997154 (G/A), the test compared the phenotypic outcome for individuals having the AA genotype with those having either the GG or GA genotype. The nonparametric Wilcoxon Rank Sum (Wilcoxon-Mann-Whitney) test was used to test whether or not there was an association. In addition to the 4 tests of association, descriptive statistics and box plots were generated for each of the subgroups defined by genotypes of the three candidate SNPs. Scatterplots corresponding to the correlational analyses were also produced. Violin plots, which combine features of box plots and kernel density plots, were generated to give a more detailed impression of the data and to explore distributional relationships between groups defined by genotypes.
Results
Following an initial reliability assessment, intrarater agreement was generally excellent with intraclass correlations of 0.9 or higher.
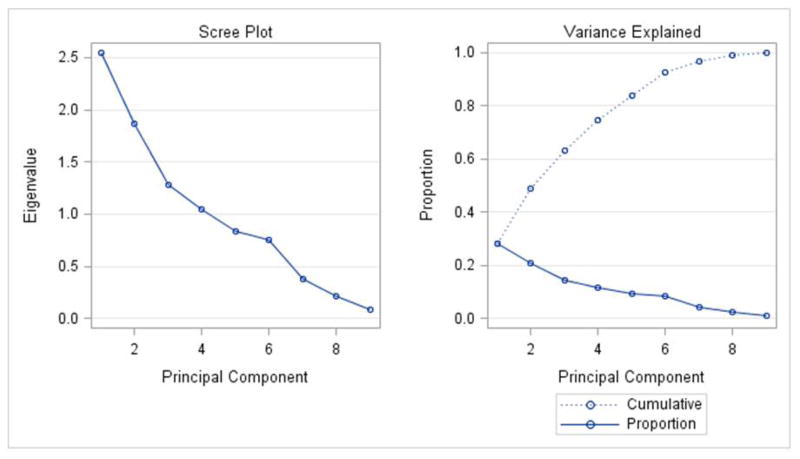
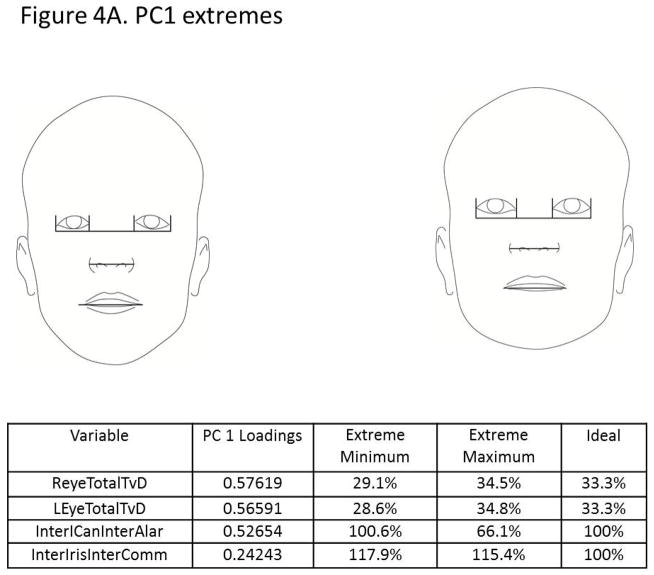
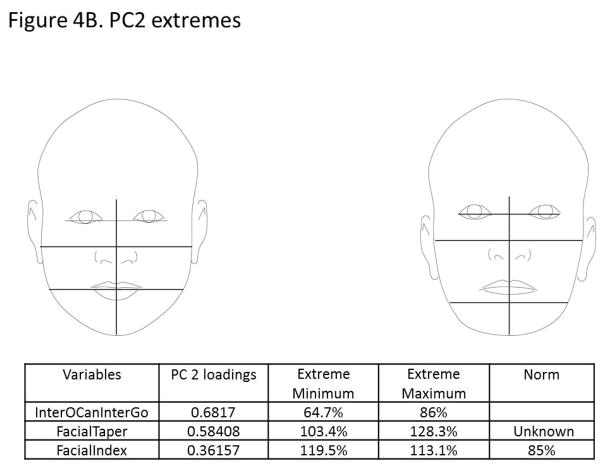
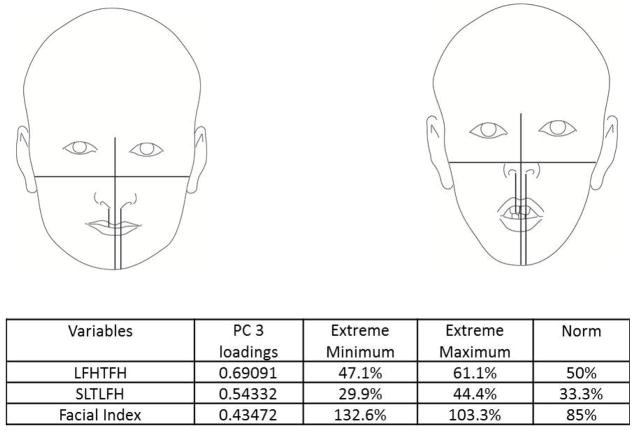
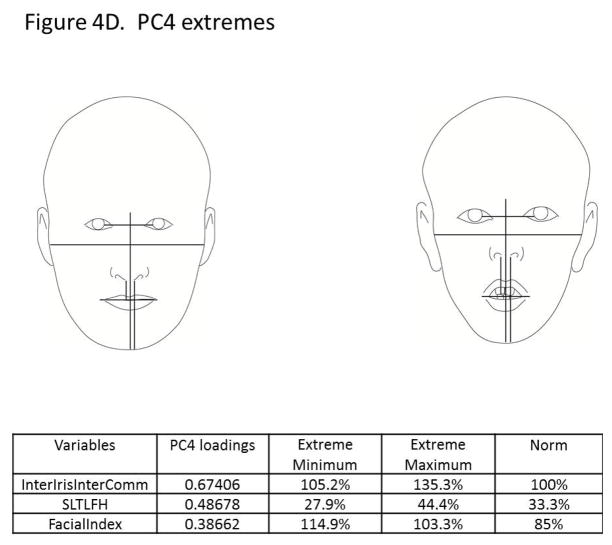
The principal components analysis revealed that four principal components accounted for 75% of the total variance in the data (Figure 3). All four components are displayed in Figure 4(A–D), along with facial proportions that achieved the highest loading values per component. Also shown are images and measurements of maximum and minimum PC scores within each component. Principal component 1 (PC1) explained 28% of the variation represented by differences in the transverse dimension between the eyes and width of the nose. Thus, individuals with smaller PC scores presented features of hypertelorism, indicating greater separation between their eyes. Individuals with larger PC scores presented with smaller distances between their eyes, which was consistent with hypotelorism (Figure 4A). PC2 explained 21% of the variation. Individuals with smaller PC scores showed a smaller ratio of inter-outer canter to inter gonial distance, and inverse taper relation (facial taper up vs. down). Individuals with larger PC scores presented lower tapered faces (Figure 4B). PC3 captured vertical facial proportions and explained 14 % of the variation seen. Individuals with smaller PC scores presented with short lower faces and redundant lips, whereas individuals with larger PC scores showed long lower faces and a tendency for interlabial gaps (Figure 4C). Lastly, PC4 explained 12% of the variation. Individuals with smaller PC scores presented with eyes that were closer together yet had wider commissures compared to individuals with large PC scores who presented with the opposite morphology. Also a shorter superior lower third and an increased facial index was also present in individuals with smaller PC scores indicating wider and shorter faces overall compared to individuals with larger PC scores (Figure 4D).
Figure 3.
Principal component analyses: 4 principal components accounted for 75% of the total variation.
Figure 4.
Images depicting subjects with principal component scores on opposite ends for each of the 4 principal components explaining 75% of the total variation. Also shown are the highest loading facial proportions within each component, along with their ideal values and the actual values for individuals on the opposite ends. A) PC1 explains 28% of the variance and primarily reflects variation in eye width, intercanthus distance and also nose width. B) PC2 explains 21% of the variance and depicts variation in facial taper and facial index. C) PC3 explains 14% of the variation and shows differences in the lower anterior facial height. D) PC4 explains 12% of the variation and along this component, individuals showed variation between the Inteiris inter commissures proportions and also in the superior aspect of the lower third of the face.
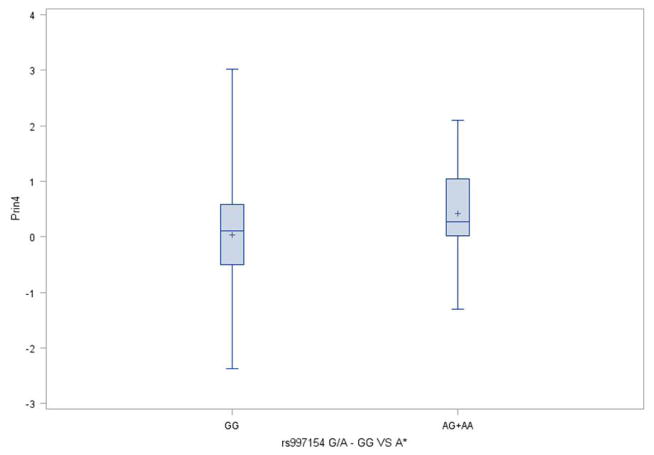
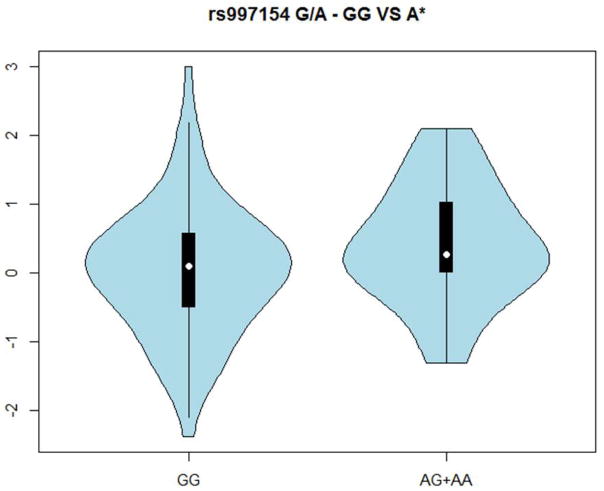
Association analyses found that there was a significant (p=0.049) correlation between PC4 and genotypic classification of SNP rs997154 (G/A, AJUBA ) under an autosomal dominant model. PC scores within PC4 tended to be greater for individuals bearing at least one copy of the A variant (MAF =0.20) relative to GG individuals (median of 0.28 vs. 0.11) (Figure 5). While the standard deviations were roughly similar (0.94 vs. 0.85), there was somewhat greater variation among individuals bearing the GG genotype for SNP rs997154. Additional details of the distributions are seen in the violin plots (Figure 6). Association was also tested for the first five facial proportions with the largest loadings for PC4 under a dominant model, yet no significant results were found (all p>0.19). It is important to acknowledge that these results do not reflect any multiple testing corrections as the use of our modest sample of 106 individuals limited our ability to detect associations at a conservative Type-1 error level.
Figure 5.
Box plot of Principal component 4 by genotypes of the SNP rs997154 G/A, AJUBA assessing dominant expression of the minor allele.
Figure 6.
Violin plots were generated to explore distributional relationships between groups defined by genotypes for rs997154 (AJUBA), by scores of PC4.
Discussion
Phenotypic-genotype correlation studies in patients with malocclusion contribute important knowledge that could translate into preventive approaches, better clinical outcomes and potentially more rewarding clinical practice. Current 3D technologies for recording of facial soft tissues can produce 3D images with high quality and precision that are noninvasive. Studies using 3D data sets in conjunction with large genomic data have resulted in initial genetic association findings with aspects of facial width and height in general populations. Facial width and height have been studied at length because of their possible correlations with both disease risk (22) and social outcomes (23). In orthodontics facial width and height are also key aspects in the diagnosis of malocclusion and treatment planning. Therefore, any knowledge of the genetic determinants of these dimensions will contribute greatly to the understanding of craniofacial growth and development.
Typically GWAS of quantitative traits have resulted in the identification of common variants with little effect on the trait’s variability. An important step in the discovery of genetic etiology is the confirmation of initial findings in additional data sets (24). For aspects of facial width and height, 2D photos which are routinely use as pre-treatment records in orthodontics constitute a good data source for discovery and replication studies.
In the current, study we utilized frontal repose photographs of class II patients to derive 2D soft tissue height and width quantitative phenotypes and replicate previous associations found for HMGA2, AJUBA and ADK (10). Specifically, SNP rs17101923 (HMGA2) was found associated with the width of the upper region of the face and nose, SNP rs7924176 (ADK) was associated with the width of the nose and finally SNP rs99714 (AJUBA) was associated with an increase in the height and prominence of the mid-brow particularly with the distance between glabella to mid-endocanthion. Our results showed a suggestive association between rs99714 (AJUBA) with our principal component 4 which depicted variation in the proportions that relate the distance between the eyes (inter inner canthus) to the distance between the commissures and also between the proportions that relate the height of the superior lower third to the lower facial height. PC4 also included the facial index, thus individuals with at least one copy of the A variant (MAF =0.20) tended towards narrower faces overall (i.e. smaller facial index) relative to GG individuals.
Studies have shown that AJUBA is a member of the LIM domain containing protein family which contributes to cell fate determination and regulates cell proliferation and differentiation (25). In mice, Ajuba is expressed early in development in the facial prominences that give rise to the forehead, nose, maxilla and mandible (EMAGE gene expression database (http://www.emouseatlas.org/emage/) (26) Moreover, Ajuba is a negative regulator of the Wnt signaling pathway that controls embryonic development by activating cell proliferation and differentiation (27), and also negatively regulates the Hippo signaling pathway which is implicated in tissue size control and cancer (28). Therefore our result, although modest and recognizing our limitations due to small sample size, constitutes an independent confirmation of AJUBA’s role in facial variation. Moreover, given that AJUBA has also been associated with primary teeth eruption, its implication in other aspects of malocclusion phenotypic variation warrants further investigation in future studies of malocclusion etiology.
Conclusions
This study identified 4 principal components that explained 75% of the total variation. In addition this study identified a suggestive association between the AJUBA gene and PC4 depicting width variation between the eyes and lip commissures, corroborating AJUBA’s involvement in facial morphology.
Clinical Relevance.
Building large 3D-imaging datasets with DNA resources is key for long-term efforts to identify genetic influences on complex malocclusion phenotypes. In the short term, however, it is possible to derive from 2D records, clinically relevant and meaningful measures of malocclusion for phenotype-genotype studies. The current study reports on multivariate phenotypes of Class II malocclusions derived from 2D frontal photos which correlated with previously known candidate genes for facial dimensional variation. Our results support a previously reported link between AJUBA and facial dimensional variation.
Acknowledgments
We are thankful to all participants in our research studies. Also to the funding sources AAOF OFDFA_2008–2011, AAO BRA 2012–2013, the National Center for Advancing Translational Sciences, and the National Institutes of Health (NIH), through Grants 2 UL1 TR000442-06 and T32-DEO14678-09. The content is solely the responsibility of the authors and does not necessarily represent the official views of the NIH.
References
- 1.Proffit WR, Fields HW, Sarver DM. In: Contemporary orthodontics. Proffit William R, Fields Henry W, Jr, Sarver David M., editors. St. Louis, Mo: Mosby Elsevier; 2007. [Google Scholar]
- 2.Claudino D, Traebert J. Malocclusion, dental aesthetic self-perception and quality of life in a 18 to 21 year-old population: a cross section study. BMC Oral Health. 2013 Jan 7;13:3. doi: 10.1186/1472-6831-13-3. 6831-13-3. [DOI] [PMC free article] [PubMed] [Google Scholar]
- 3.Ermakov S, Rosenbaum MG, Malkin I, Livshits G. Family-based study of association between ENPP1 genetic variants and craniofacial morphology. Ann Hum Biol. 2010 Nov;37(6):754–766. doi: 10.3109/03014461003639231. [DOI] [PubMed] [Google Scholar]
- 4.Coussens AK, van Daal A. Linkage disequilibrium analysis identifies an FGFR1 haplotype-tag SNP associated with normal variation in craniofacial shape. Genomics. 2005 May;85(5):563–573. doi: 10.1016/j.ygeno.2005.02.002. [DOI] [PubMed] [Google Scholar]
- 5.Boehringer S, van der Lijn F, Liu F, Gunther M, Sinigerova S, Nowak S, et al. Genetic determination of human facial morphology: links between cleft-lips and normal variation. Eur J Hum Genet. 2011 Nov;19(11):1192–1197. doi: 10.1038/ejhg.2011.110. [DOI] [PMC free article] [PubMed] [Google Scholar]
- 6.Peng S, Tan J, Hu S, Zhou H, Guo J, Jin L, et al. Detecting genetic association of common human facial morphological variation using high density 3D image registration. PLoS Comput Biol. 2013 Dec;9(12):e1003375. doi: 10.1371/journal.pcbi.1003375. [DOI] [PMC free article] [PubMed] [Google Scholar]
- 7.Miller SF, Weinberg SM, Nidey NL, Defay DK, Marazita ML, Wehby GL, et al. Exploratory genotype-phenotype correlations of facial form and asymmetry in unaffected relatives of children with non-syndromic cleft lip and/or palate. J Anat. 2014 Jun;224(6):688–709. doi: 10.1111/joa.12182. [DOI] [PMC free article] [PubMed] [Google Scholar]
- 8.Paternoster L, Zhurov AI, Toma AM, Kemp JP, St Pourcain B, Timpson NJ, et al. Genome-wide association study of three-dimensional facial morphology identifies a variant in PAX3 associated with nasion position. Am J Hum Genet. 2012 Mar 9;90(3):478–485. doi: 10.1016/j.ajhg.2011.12.021. [DOI] [PMC free article] [PubMed] [Google Scholar]
- 9.Liu F, van der Lijn F, Schurmann C, Zhu G, Chakravarty MM, Hysi PG, et al. A genome-wide association study identifies five loci influencing facial morphology in Europeans. PLoS Genet. 2012 Sep;8(9):e1002932. doi: 10.1371/journal.pgen.1002932. [DOI] [PMC free article] [PubMed] [Google Scholar]
- 10.Fatemifar G, Hoggart C, Paternoster L, Kemp JP, Prokopenko I, Horikoshi M, et al. Genome-Wide Association Study of Primary Tooth Eruption Identifies Pleiotropic Loci Associated With Height and Craniofacial Distances. Hum Mol Genet. 2013 May 23; doi: 10.1093/hmg/ddt231. [DOI] [PMC free article] [PubMed] [Google Scholar]
- 11.Houle D, Govindaraju DR, Omholt S. Phenomics: the next challenge. Nat Rev Genet. 2010 Dec;11(12):855–866. doi: 10.1038/nrg2897. [DOI] [PubMed] [Google Scholar]
- 12.Hammond P, Suttie M. Large-scale objective phenotyping of 3D facial morphology. Hum Mutat. 2012 May;33(5):817–825. doi: 10.1002/humu.22054. [DOI] [PMC free article] [PubMed] [Google Scholar]
- 13.Yong R, Ranjitkar S, Townsend G, Smith R, Evans A, Hughes T, et al. Dental phenomics: advancing genotype to phenotype correlations in craniofacial research. Aust Dent J. 2014 Feb 24; doi: 10.1111/adj.12156. [DOI] [PubMed] [Google Scholar]
- 14.Sarver D, Jacobson RS. The aesthetic dentofacial analysis. Clin Plast Surg. 2007 Jul;34(3):369–394. doi: 10.1016/j.cps.2007.05.008. [DOI] [PubMed] [Google Scholar]
- 15.Farkas LG, Munro IR. In: Anthropometric facial proportions in medicine. Farkas Leslie G, Mun Ian R., editors. Springfield, Ill: Thomas; 1986. [Google Scholar]
- 16.Nanda SK. Patterns of vertical growth in the face. Am J Orthod Dentofacial Orthop. 1988 Feb;93(2):103–116. doi: 10.1016/0889-5406(88)90287-9. [DOI] [PubMed] [Google Scholar]
- 17.Blanchette ME, Nanda RS, Currier GF, Ghosh J, Nanda SK. A longitudinal cephalometric study of the soft tissue profile of short- and long-face syndromes from 7 to 17 years. Am J Orthod Dentofacial Orthop. 1996 Feb;109(2):116–131. doi: 10.1016/s0889-5406(96)70172-5. [DOI] [PubMed] [Google Scholar]
- 18.Franchi L, Baccetti T. Transverse maxillary deficiency in Class II and Class III malocclusions: a cephalometric and morphometric study on postero-anterior films. Orthod Craniofac Res. 2005 Feb;8(1):21–28. doi: 10.1111/j.1601-6343.2004.00312.x. [DOI] [PubMed] [Google Scholar]
- 19.Team RC. R: A language and environment for statistical computing. 2012 [Google Scholar]
- 20.Shrout PE, Fleiss JL. Intraclass correlations: uses in assessing rater reliability. Psychol Bull. 1979 Mar;86(2):420–428. doi: 10.1037//0033-2909.86.2.420. [DOI] [PubMed] [Google Scholar]
- 21.Zar JH. Biostatistical Analysis. 5. New Jersey: Prentice Hall; 1999. pp. 411–414. [Google Scholar]
- 22.Fonseca FR, Sarmento DJ, Vasconcelos Medeiros PF, Diniz DN, Dos Santos MT. Patients With Mucopolysaccharidosis Have Tendencies Towards Vertical Facial Growth. J Oral Maxillofac Surg. 2014 Jul 16; doi: 10.1016/j.joms.2014.07.006. [DOI] [PubMed] [Google Scholar]
- 23.Wong EM, Ormiston ME, Haselhuhn MP. A face only an investor could love: CEOs’ facial structure predicts their firms’ financial performance. Psychol Sci. 2011 Dec;22(12):1478–1483. doi: 10.1177/0956797611418838. [DOI] [PubMed] [Google Scholar]
- 24.Seng KC, Seng CK. The success of the genome-wide association approach: a brief story of a long struggle. Eur J Hum Genet. 2008 May;16(5):554–564. doi: 10.1038/ejhg.2008.12. [DOI] [PubMed] [Google Scholar]
- 25.Goyal RK, Lin P, Kanungo J, Payne AS, Muslin AJ, Longmore GD. Ajuba, a novel LIM protein, interacts with Grb2, augments mitogen-activated protein kinase activity in fibroblasts, and promotes meiotic maturation of Xenopus oocytes in a Grb2- and Ras-dependent manner. Mol Cell Biol. 1999 Jun;19(6):4379–4389. doi: 10.1128/mcb.19.6.4379. [DOI] [PMC free article] [PubMed] [Google Scholar]
- 26.Richardson L, Stevenson P, Venkataraman S, Yang Y, Burton N, Rao J, et al. EMAGE: Electronic Mouse Atlas of Gene Expression. Methods Mol Biol. 2014;1092:61–79. doi: 10.1007/978-1-60327-292-6_5. [DOI] [PubMed] [Google Scholar]
- 27.Haraguchi K, Ohsugi M, Abe Y, Semba K, Akiyama T, Yamamoto T. Ajuba negatively regulates the Wnt signaling pathway by promoting GSK-3beta-mediated phosphorylation of beta-catenin. Oncogene. 2008 Jan 10;27(3):274–284. doi: 10.1038/sj.onc.1210644. [DOI] [PubMed] [Google Scholar]
- 28.Das Thakur M, Feng Y, Jagannathan R, Seppa MJ, Skeath JB, Longmore GD. Ajuba LIM proteins are negative regulators of the Hippo signaling pathway. Curr Biol. 2010 Apr 13;20(7):657–662. doi: 10.1016/j.cub.2010.02.035. [DOI] [PMC free article] [PubMed] [Google Scholar]


