

Abstract
Deletions of the PAFAH1B1 gene (encoding LIS1) in 17p13.3 result in isolated lissencephaly sequence, and extended deletions including the YWHAE gene (encoding 14-3-3ε) cause Miller-Dieker syndrome. We identified seven unrelated individuals with submicroscopic duplication in 17p13.3 involving the PAFAH1B1 and/or YWHAE genes, and using a ‘reverse genomics’ approach, characterized the clinical consequences of these duplications. Increased PAFAH1B1 dosage causes mild brain structural abnormalities, moderate to severe developmental delay and failure to thrive. Duplication of YWHAE and surrounding genes increases the risk for macrosomia, mild developmental delay and pervasive developmental disorder, and results in shared facial dysmorphologies. Transgenic mice conditionally overexpressing LIS1 in the developing brain showed a decrease in brain size, an increase in apoptotic cells and a distorted cellular organization in the ventricular zone, including reduced cellular polarity but preserved cortical cell layer identity. Collectively, our results show that an increase in LIS1 expression in the developing brain results in brain abnormalities in mice and humans.
The extent to which copy-number variation (CNV) has a role in human genetic variation has emerged only recently after the development of genome-wide tools. Genomic rearrangement mutations are rather common, and one of the premises underlying our research is that the likelihood for dosage-sensitive loci to show both deletion and duplication phenotypes is high1. Furthermore, existing knowledge supports the notion that the deletion phenotype is anticipated to be more severe than the duplication phenotype. One such locus, in which deletions are manifested as a severe brain malformation, is the PAFAH1B1 gene, encoding LIS1 (ref. 2). Deletions or point mutations in this gene result in a spectrum of abnormal neuronal migration phenotypes ranging from classic lissencephaly to subcortical band heterotopia3. Aberrant neuronal migration may be responsible for a substantial proportion of cases of mental retardation and epilepsy in children4. Furthermore, diseases such as schizophrenia, autism and dyslexia are associated with deviant migration of neurons5,6 and de novo CNVs involving multiple different genomic regions7–13. To date, the issue of whether PAFAH1B1 duplication results in a disease phenotype has not been systematically investigated.
A contiguous gene deletion including PAFAH1B1, mapping within the subtelomic region of chromosome 17p, is associated with Miller-Dieker syndrome (MDS; OMIM 247200)14. Individuals with MDS show a more severe brain phenotype accompanied by marked dysmorphic facial appearances; other congenital anomalies depend on the extent of the deletion. The candidate gene for the more severe brain phenotype is YWHAE, encoding 14-3-3ε, located within the MDS critical region15. Given the above, we hypothesized that increased copy number within the MDS locus is involved in human disease. In support of this hypothesis, complete trisomy of the short arm of chromosome 17 was suggested to comprise a new syndrome owing to the similar phenotypic appearance16,17. Until now, there were no reported submicroscopic tandem duplications in 17p13.3 in the MDS region. PAFAH1B1 is an important gene in this region; sensitivity to its reduced expression has been shown in mouse models18,19. Furthermore, cell-autonomous reduction of LIS1 levels results in significant inhibition of neuronal migration and proliferation20–22.
Here we used biological data derived from the developing mouse brain combined with careful screening by genome-wide array comparative genomic hybridization (array CGH) for CNVs involving specific genes in humans. We assessed seven individuals with relatively small submicroscopic duplications in 17p13.3, including PAFAH1B1 and/or the YWHAE, CRK and MYO1C genes in the MDS critical region, identified by array CGH. Using reverse genomics approaches, ‘genomotype’-phenotype association suggested that the duplications of PAFAH1B1 or YWHAE cause two different disorders. Common features observed in individuals with PAFAH1B1 duplications include neurobehavioral deficits and subtle brain abnormalities. We also generated transgenic mice that conditionally overexpressed LIS1 in the developing brain. Our results show that an increase in LIS1 expression in the developing brain may result in smaller brains and neuronal migration abnormalities in mice and that more than one gene mapping within a duplication may interact to bring about a phenotype. The abundance of CNVs has emphasized the complexity of defining normal and abnormal variability. These results enhance our understanding of the biological processes underlying human disease, document that subtle overexpression of a normal gene can have profound phenotypic consequences, and indicate optimal diagnostic and possible future therapeutic approaches.
Results
Duplications in 17p13.3, including the MDS critical region
Using array CGH, we detected a gain of copy number in the MDS critical region in seven unrelated individuals (Fig. 1; representative photographs and brain MRI are shown in Fig. 2). We did not identify copy number changes in other interrogated loci. A duplication in 17p13.3 was confirmed by FISH analyses in four individuals (Fig. 1g–i,k), whereas subject 6 had a complex rearrangement consisting of a triplication of PAFAH1B1 (Fig. 1j) embedded within a duplicated region. The duplicated segment in subject 2 was inserted on the long arm of one chromosome 13 (Fig. 1h). Parental analysis showed that the duplications in subjects 1, 3, 4, 6 and 7 were de novo; in subject 5, it was maternally inherited, and for subject 2, only one normal parent was available.
Figure 1.
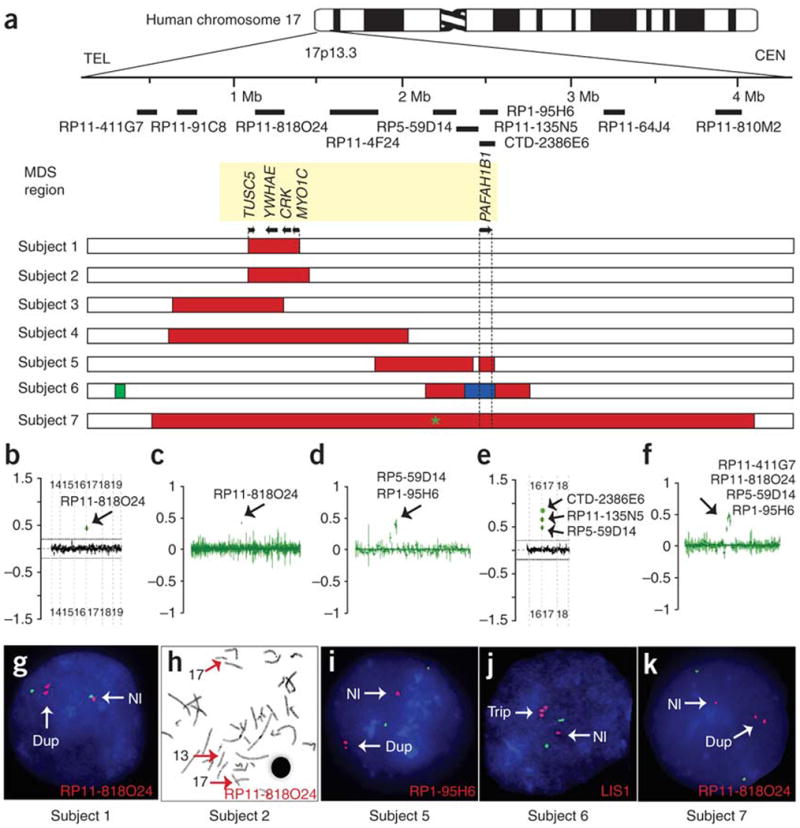
Seven individuals with duplications of the MDS region identified by array CGH. (a) Duplicated regions in 17p13.3. Top, ideogram of human chromosome 17. Clones used in the array analyses are shown. Bottom, MDS region is indicated by yellow box. Below are seven horizontal bars showing fine-mapping of duplications. Red, duplication; green, deletion; blue, triplication. Subject 1 had the smallest duplication, containing only four genes (TUSC5, YWHAE (encoding 14-3-3ε), CRK and MYO1C), with the first exon of some MYO1C transcripts outside the duplicated region. An 82-kb deletion in the subtelomeric region distal to the MDS region was identified in subject 6. Green asterisk for subject 7 indicates ∼4-kb deletion. TEL, telomere; CEN, centromere. (b–k) Gain of copy number (black arrows) in the MDS region was detected by array CGH (b–f) and confirmed by FISH (g–k). Clones with gain in copy number and probes for FISH are indicated. (h) Metaphase FISH analysis showing that the additional copy in 17p13.3 in subject 2 was inserted within the long arm of chromosome 13 (FISH signals indicated by red arrows). (j) Triplication in subject 6 was detected using a probe specific to PAFAH1B1 (encoding LIS1). Nl, normal; Dup, duplication; Trip, triplication.
Figure 2.
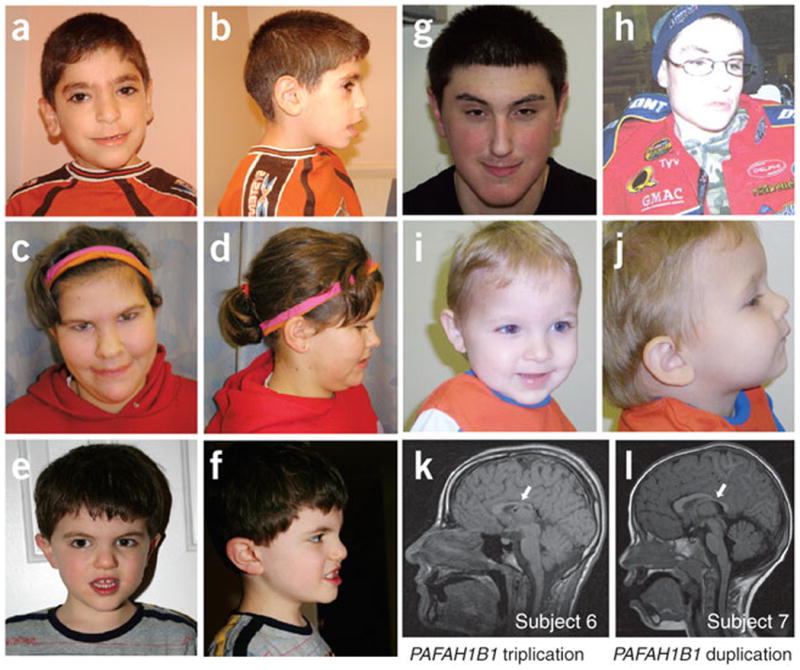
Facial features and mild brain structural anomalies identified by brain MRI. (a,b) Subject 1 had thick eyebrows, synophrys, full periorbital region, long straight eyelashes, large ears with thick fleshy earlobes, squared nose with overhanging columella and thin upper lip. (c,d) Subject 2 had broad forehead, upslanting palpebral fissures, wide nasal bridge, synophrys, squared nasal tip, thin upper lip and prominent chin. (e,f) Subject 3 had mild facial anatomic abnormalities, including prominent and wide nasal bridge, mildly deep-set eyes, prominent eyebrows and mild prognathia. (g) Subject 4 had a long face, mild synophrys, mild hypotelorism, upslanting palpebral fissures, prominent nasal bridge, overhanging columella, short philtrum and thin upper lip. (h) Subject 6 had microcephaly and high rounded palate. (i,j) Subject 5 had microcephaly, prominent forehead, triangular face, mild jaw retraction and thin upper lip. Subjects 1–4 had a duplication of YWHAE, and subjects 5 and 6 had a duplication or triplication of PAFAH1B1, respectively. (k) Sagittal view of unenhanced T1-weighted brain MRI of subject 6 showing reduced brain size, mainly in the occipital cortex, and gross dysgenesis of the corpus callosum (arrow) especially affecting the splenium. (l) Sagittal view of T1-weighted brain MRI of subject 7 showing reduced brain size, mainly in the occipital cortex, thinning of the splenium of the corpus callosum (arrow) and very mild cerebellar volume loss. We obtained informed consent to publish these photographs.
Inferring mechanisms from junction sequences
By conducting array CGH analysis using a high-density oligonucleotide-based custom array for the short arm of chromosome 17 in these seven subjects, we precisely mapped the duplications in the MDS region and showed that the proximal and distal breakpoints were unique to each individual (Fig. 1a). Subjects 1, 2, 3 and 4 showed duplications in the distal MDS region containing YWHAE but not PAFAH1B1. Subject 1 had the smallest duplication (Figs. 1a and 3a), which comprised 240 kb and contained only four genes (TUSC5, YWHAE, CRK and MYO1C); exon 1 of several MYO1C transcripts were excluded from the duplicated region. Subjects 5 and 6 showed a gain in copy number in the proximal MDS region including PAFAH1B1. Subject 7 had a large duplication including both PAFAH1B1 and YWHAE. Genome-wide SNP genotyping23 on subjects 2 and 7 (Supplementary Fig. 1 online) revealed no additional potential pathological copy number changes.
Figure 3.
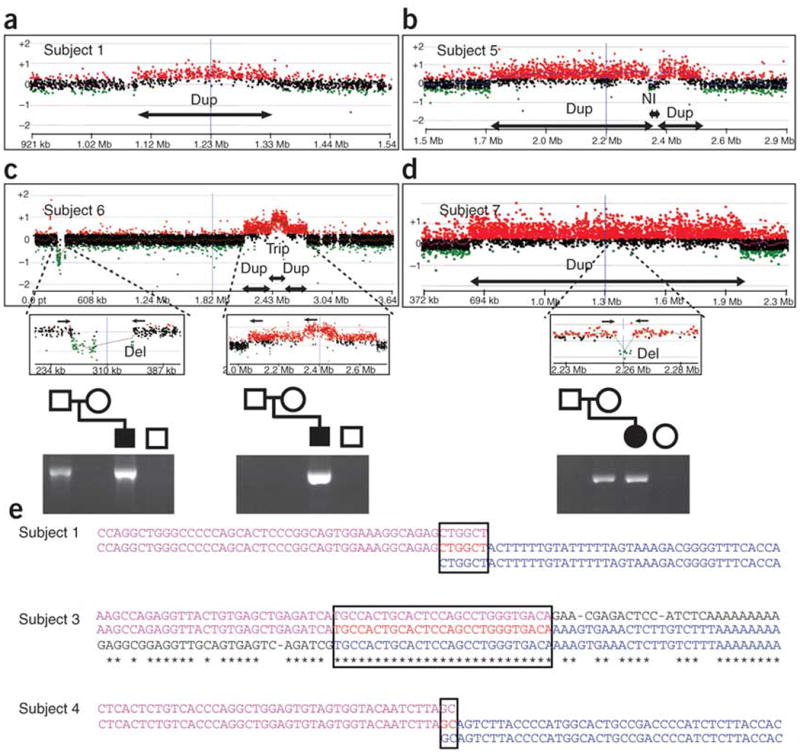
Rearrangement mechanisms revealed by high-density array CGH and junction sequences. (a–d) The region and size of chromosome aberrations were precisely mapped by array CGH using a high-density customized array specific for chromosome 17p. As indicated by the arrows below the plots, subject 1 (a) had a simple small duplication, whereas subject 5 (b) showed a complex duplication-normal-duplication pattern, and subject 6 (c) showed a complex duplication-triplication-duplication pattern. An additional small deletion of ∼82 kb was identified ∼2 Mb distal to the MDS region in subject 6. Subject 7 (d) had a large duplication containing a small deletion of ∼4 kb. Shown below are PCR amplifications of the junction fragments using the primers indicated by the small arrows above. For subject 6, the complex rearrangement in the MDS region was de novo, but the distal deletion was inherited from the father. For subject 7, the deletion within the duplicated region was inherited from the mother. (e) Sequence analysis of the duplication junctions. Top (purple), normal distal flanking sequence; bottom (blue), normal proximal flanking sequence; middle, duplication junction sequence. Identical nucleotides between proximal and distal flanking sequences are indicated by asterisks. Regions of complete homology between proximal and distal sequences are boxed. Microhomology is present at the junctions between flanking sequences in subjects 1 (6 bp) and 4 (2 bp). Case 3 showed homologous recombination between the two AluSg elements within a perfect 27-bp homology interval.
High-density array CGH showed that the duplicated region in subject 5 was separated by an ∼50-kb region with a normal copy number (Figs. 1a and 3b). The proximal duplication was ∼151 kb and included the complete PAFAH1B1 gene. The distal duplication was ∼580 kb. The same complex rearrangement was also present in the mother, as determined by array CGH and PCR analysis of the breakpoints. Subject 6 had a complex rearrangement with a 160-kb triplication flanked by a distal 266-kb duplication and a proximal 205-kb duplication (Figs. 1a and 3c). The triplication included the complete PAFAH1B1 gene. In addition, we identified an 82-kb deletion distal to the MDS region that was inherited from the father (Fig. 3c). We identified a maternally inherited ∼4-kb deletion within the large duplication in subject 7 (Figs. 1a and 3d). Thus, the de novo duplication in subject 7 was a simple rearrangement.
Three of the described duplications were complex (subjects 2, 5 and 6) and may have arisen by the recently described mechanism of replication fork stalling and template switching (FoSTeS)24. DNA sequencing of the junction points suggested that the complex rearrangement in subject 5 was caused by two FoSTeS events; further studies are necessary to explain the complex rearrangement in subject 6 (Supplementary Fig. 2 online). We obtained junction sequences for the three subjects with apparent simple tandem duplications (Fig. 3e). For subjects 1 and 4, the breakpoints were located within unique sequences with no repetitive elements. Microhomology between the distal and proximal breakpoints was present, with 6 bp (CTGGCT) of perfect identity for subject 1 and 2 bp (GC) for subject 4. The breakpoints in subject 3 were within two AluSg elements, and the crossover was mapped to a 27-bp interval. Thus, the duplications in subjects 1 and 4 probably occurred through either nonhomologous end-joining or by a single FoSTeS event, whereas the duplication in subject 3 apparently occurred by nonallelic homologous recombination between two repetitive elements.
Overexpression of genes within the duplicated region
We conducted gene expression analysis on lymphoblasts by real-time RT-PCR (Supplementary Table 1 online). In subject 4, who had a duplication including YWHAE and CRK, expression of YWHAE and CRK was higher, whereas expression of PAFAH1B1 was consistent with that of normal controls. PAFAH1B1 expression was also higher in subject 5, who had a duplication including PAFAH1B1, whereas expression of YWHAE and CRK was similar to that of normal controls. Thus, expression of the genes in the MDS region was consistent with their genomic copy number.
Genomotype-phenotype association studies on dup17p13.3
The key physical, cognitive and laboratory findings for the seven affected individuals are summarized in Table 1; detailed clinical descriptions are provided in Supplementary Note online. Although only a small cohort (n = 7) of individuals with duplications was available in this study, and further studies will be needed to better delineate the clinical consequences of 17p13.3 duplications, we drew some conclusions about potential genomotype-phenotype associations. The individuals with duplications including YWHAE were characterized by a milder neurocognitive and pervasive developmental disorder phenotype, as well as sharing some minor craniofacial abnormalities, whereas the duplication of PAFAH1B1 predisposed to severe total body growth restriction and moderate to severe developmental delay.
Table 1. Clinical features of individuals with duplications or triplication in the 17p13.3 MDS region.
| Subject 1 | Subject 2 | Subject 3 | Subject 4 | Subject 5 | Subject 6 | Subject 7 | |
|---|---|---|---|---|---|---|---|
| Sex | Male | Female | Male | Male | Male | Male | Female |
| Duplication size (Mb) | 0.24 | 0.35 | 0.61 | 1.41 | 0.78 | Tri./dup. 0.63 | 3.6 |
| Parental studies | De novo | Mother normal | De novo | De novo | Mother dup. | De novo | De novo |
| Age at exam | 5 y, 5 mo | 9 y, 9 mo | 33 mo | 14 y, 9 mo | 32 mo | 17 y, 4 mo | 10 y, 5 mo |
| Birth weight (percentile) | 75th | +3 s.d. | 10th | 95th | 10th | N/A | 25th |
| Birth length (percentile) | N/A | +3 s.d. | N/A | +3 s.d. | N/A | N/A | 75th |
| Birth FOC (percentile) | N/A | N/A | N/A | N/A | N/A | N/A | 10th |
| Current weight (percentile) | 90th | +3 s.d. | 50th | 95th | −3 s.d. | −5 s.d. | 95th |
| Current length (percentile) | 90th | +3 s.d. | 50th | 97th | −3.5 s.d. | −6 s.d. | 75th |
| Current FOC (percentile) | 75th | +2.5 s.d. | 10th | 90th | −4 s.d. | N/A | 10th |
| Head and neck | Normal | Long face | Normal | Long face | Microcephaly, triangular face | Microcephaly | Normal |
| Eyes | Thick eyebrows, synophrys, full periorbital region, long straight eyelashes | Synophrys, upslanting palpebral fissures | Deep-set eyes, prominent eyebrows | Mild synophrys, upslanting palpebral fissures, hypotelorism | Normal | Normal | Infantile strabismus |
| Nose | Squared nose, overhanging columella | Prominent nasal bridge, overhanging columella, squared nose | Broad nasal bridge | Prominent nasal bridge, overhanging columella, recurrent nosebleeds | Normal | Normal | Normal |
| Mouth | Thin upper lip, wide groove, narrow high palate | Thin upper lip, prominent chin | Mild prognathia | Thin upper lip, short philtrum, malocclusion | Micrognathia | High arched palate | Normal |
| Ears | Large ears; thick, fleshy earlobes | Large ears | Normal | Normal | Normal | Normal | Normal |
| Skeletal | Small distal phalanges, large hands (97th percentile) | Large hands with mid-palm length >97th percentile | Normal | Scoliosis, advanced bone age, prominent PIP joints | Sagittal cranio-synostosis | Scoliosis, dislocated hips, varus leg deformity, short stature | Normal |
| Development | Mild developmental delay | Global developmental delay | Expressive language delay | Fine motor delay | Failure to thrive, developmental delay | Mental retardation | Moderate developmental delay |
| Neurological abnormalities | Mild muscle hypotonia, suspected autism | Muscle hypotonia | Reduced eye contact | Attention deficit disorder with hyperactivity | Not available | Profound muscle hypotonia, muscle atrophy, ADHD, OCD | Insensitivity to pain, autism |
Tri., triplication; dup., duplication; y, year; mo, month; N/A, not available; FOC, fronto-occipital circumference; PIP, proximal interphalangeal; ADHD, attention deficit–hyperactivity disorder; OCD, obsessive-compulsive disorder.
Some craniofacial features were shared among individuals with YWHAE duplication, including mild synophrys, overhanging columella, thin upper lip and pointed chin (Fig. 2a–g). However, there was no apparent pathognomonic clinical facial dysmorphism or facial gestalt apparent from this limited case series. Individuals with PAFAH1B1 duplication were not particularly dysmorphic (Fig. 2h–j). A macrosomia tendency was noted in individuals with the YWHAE duplication, with the exception of subject 3, who showed normal morphometric parameters. This was contrasted by microcephaly and severe growth restriction in individuals with PAFAH1B1 duplication. Major internal organ abnormalities were more characteristic for the individuals with duplication of PAFAH1B1. Other abnormalities include craniosynostosis, intestinal malrotation, scoliosis, cardiovascular anomaly and varus leg deformity.
Developmental delay, features of pervasive developmental disorder and cognitive difficulties and/or speech abnormalities were observed in all affected individuals and were the primary reason for referral to genetics or neurology departments. Subject 4 showed only mild fine-motor delays by age 15 years. Common neurobehavioral problems included pervasive developmental disorder and attention deficit–hyper-activity disorder observed in individuals with YWHAE duplication. The duplication in subject 5 was inherited from his mother, who also had attention deficit–hyperactivity disorder and suffered from seizures.
PAFAH1B1 haploinsufficiency causes lissencephaly, with severity ranging from complete agyria to variable degrees of agyria and pachygyria and, rarely, subcortical band heterotopia25,26. In contrast, overexpression of LIS1 resulting from PAFAH1B1 duplication seems to cause different and subtle brain structural phenotypes. Subject 6, who had a triplication of PAFAH1B1, showed mild cerebral volume loss and gross dysgenesis of the corpus callosum with marked cerebellar atrophy (Fig. 2k). In addition, the brain appeared smaller, mainly in the occipital cortex. Subject 7, who had a duplication of PAFAH1B1, showed thinning of the splenium of the corpus callosum, mild cerebellar volume loss (Fig. 2l) and a smaller brain, mainly in the occipital cortex. In general, magnetic resonance imaging (MRI) abnormalities were more pronounced both qualitatively and quantitatively in the individual with PAFAH1B1 triplication compared to duplication, an observation consistent with a gene dosage effect.
LIS1-overexpressing mice have smaller brains
Given the limited resolution of brain MRI, and to understand the molecular mechanisms underlying the mild brain structural abnormalities in individuals with PAFAH1B1 duplication, we analyzed trans-genic mice with increased LIS1 expression in the developing brain. Expression of the Tg(CAGG-loxP-LacZ-neo-loxP-PAFAH1B-DsRed) transgene (abbreviated as LIS1-DsRed) was clearly noticeable at embryonic day 12.5 (E12.5; Fig. 4a) and was estimated to be a 20% increase over endogenous protein levels (Fig. 4b). Overall, the brains of LIS1::Foxg1(Cre) mice (Foxg1tm1(Cre)Skm transgenic mice, referred to here as Foxg1(Cre), crossed with LIS1-DsRed transgenic mice) were smaller than those of control mice (Fig. 4c–f). Measurements of brain width at ventral positions at E14.5 were significantly smaller for LIS1::Foxg1(Cre) mice (mean ± s.e.m., 295.9 ± 7.213 µm) than for control mice (322.9 ± 8.004 µm; P < 0.0001 by paired Student t test). Postnatal brains of LIS1::Foxg1(Cre) mice showed a reduction mainly in layer 4 (the somatosensory cortex), which appeared reduced to a vestigial layer with few granular cells and half of its normal thickness and showed an evident reduction of barrel field extension (Supplementary Fig. 3 online). Brain sections showed disorganization in the ventricular zone, as assessed by Hoechst staining of live sections (Fig. 4g,h). Immunostaining for Tbr2 combined with short bromo-deoxyuridine (BrdU) labeling also revealed a reduction mainly in the ventricular zone width, but not the subventricular zone width (where Tbr2-positive cells are concentrated; Fig. 4i,j).
Figure 4.
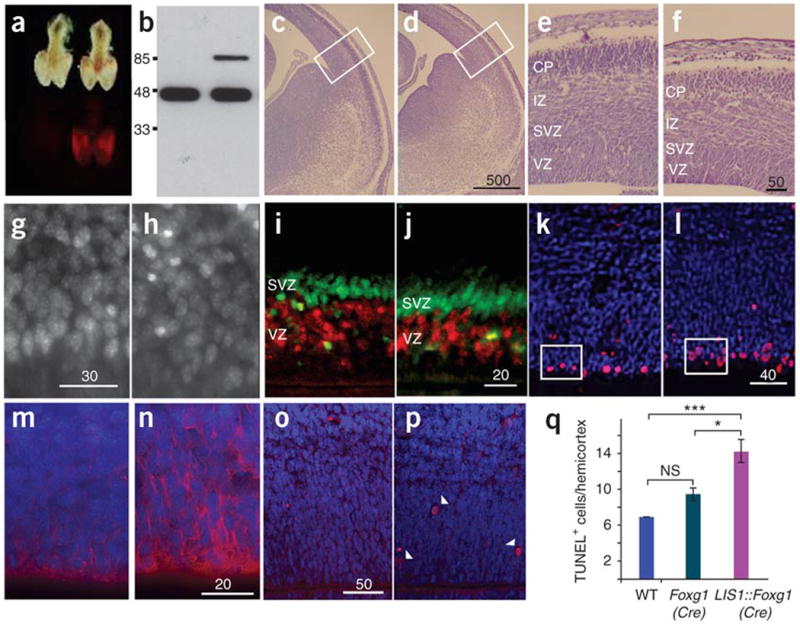
LIS1-overexpressing mice have smaller brains with a disorganized ventricular zone. (a) Transgene expression was observed in the telencephalon of E12.5 LIS1-overexpressing mice (right) but not in Cre-control littermates (left). (b) LIS1-DsRed (85 kDa) is estimated to be 20% of endogenous LIS1 (46 kDa). (c,d) Cresyl violet staining of comparable E14.5 brain sections from control (c) and LIS1-overexpressing (d) mice. Scale bar size is given in micrometers. (e,f) Higher magnification of boxed areas in c (e) and d (f), showing noticeable reduction of brain width in LIS1-overexpressing brain (f). VZ, ventricular zone; SVZ, subventricular zone; IZ, intermediate zone; CP, cortical plate. (g,h) Hoechst 33342 staining of E13.5 live brain sections from control (g) and LIS1-overexpressing (h) mice. Cells in h were less organized. (i,j) E14.5 control (i) and LIS1 overexpressing (j) brain sections labeled with short (30 min) BrdU (red), combined with Tbr2 immunostaining (green) to label the ventricular and subventricular zones. (k,l) Immunostaining for phosphorylated histone H3 (red) in control (k) and LIS1-overexpressing (l) E14.5 brain sections. Nuclei were stained with DAPI (blue). Boxed areas highlight difference in number and organization of mitotic cells between k and l.(m,n) Immunostaining for nestin (red) in control (m) and LIS1-overexpressing (n) E14.5 brain sections. Nuclei were labeled with DAPI. Nestin expression was higher in LIS1-overexpressing mice. (o,p) Detection of apoptotic (TUNEL-positive) cells (red) indicated by arrowheads in control (o) and LIS1-overexpressing (p) mice. Nuclei were labeled with DAPI. (q) Quantification of TUNEL-positive cells in E14.5 coronal slices (20 mm thick) in Cre-control (Foxg1(Cre)) and LIS1-overexpressing (LIS1::Foxg1(Cre)) brains. ***P < 0.001, *P < 0.05.
Within the ventricular zone, progenitors divide at apical positions close to the ventricle. In LIS1::Foxg1(Cre) brains, we detected a wider distribution of mitotic cells by immunostaining of phosphorylated histone H3 present in late G2/M phase (Fig. 4k,l). In addition, the number of cells with phosphorylated histone H3 was significantly higher in the LIS1-overexpressing brain sections than in control sections (P < 0.0001 by paired t test; 12.83 ± 0.542 for LIS1::Foxg1(Cre) versus 10 ± 0.447 for control). No differences were noted when we compared different control brain sections, including Cre-control (Foxg1(Cre)) mice, mice carrying the transgene but no Cre, and wild-type control mice. Nestin expression was also higher in LIS1::Foxg1(Cre) mice than in control mice (Fig. 4m,n). The aberrant position of mitotic cells and greater nestin immunoreactivity were accompanied by an increase in apoptotic cells, as determined by TUNEL (Fig. 4o,p). The number of TUNEL-positive cells in LIS1-overexpressing hemicortex in coronal brain sections was 14.26 ± 1.128; in Cre-expressing control mice, the number was significantly lower (9.5 ± 1.288, P < 0.05) and similar to that in wild-type brain sections (7.00 ± 0.663, P < 0.001 by Dunn multiple-comparison test; Fig. 4q). There was no significant difference between Cre-control and wild-type brain sections. Despite the disorganization of the ventricular zone, cortical layer identity was preserved (Supplementary Fig. 3g–p), and radial glia scaffold was aligned in a normal pattern (Supplementary Fig. 3c).
LIS1 overexpression affects cell polarity in the ventricular zone
Polarity is one of the main features of neuroepithelial cells in the ventricular zone. To further investigate the disorganized ventricular zone in LIS1::Foxg1(Cre) mice, we analyzed cell polarity in this area. The ventricular zone has apical-basal polarity, with proliferating progenitors on the ventricular-apical surface decorated with adherens junctions27. Staining with several markers of cell polarity and adhesion revealed disruptions in apical junctions and a reduction in cell polarity (Fig. 5a–l). We also observed an apparent mislocalization of β-catenin immunostaining (Fig. 5a,b). In control brain sections, β-catenin was prominently located in punctate structures near the ventricle; in LIS1-overexpressing mice, β-catenin-positive punctate dots were distributed throughout the cell with no polar staining pattern. In addition, the pattern of actin localization close to the ventricle was wider, and the dense patches detected by phalloidin staining were not observed (Fig. 5c,d). Centrosomes, which are usually tethered to the apical surface, were scattered (Fig. 5e,f). Numb, which usually localizes only to the apical side, was widely distributed in the cytoplasm (Fig. 5g,h). The observed changes were accompanied by a marked reduction in cadherin immunostaining (Fig. 5i,j).
Figure 5.
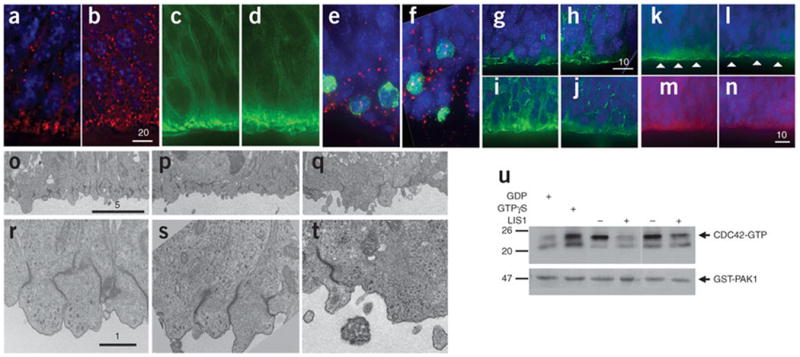
LIS1-overexpressing mice show reduced cell polarity in the ventricular zone. (a,b) Immunostaining for β-catenin (red) in E14.5 brain sections from control (a) and LIS1-overexpressing (b) mice. Nuclei were labeled with DAPI (blue). Scale bar size is given in micrometers. (c,d) Staining for phalloidin-FITC (green) in E14.5 brain sections from control (c) and LIS1-overexpressing (d) mice. Fewer dense patches were observed in d compared to c. (e,f) Immunostaining for pericentrin (red) and phosphorylated histone H3 (green) in E14.5 brain sections of control (e) and LIS1-overexpressing (f) mice. Nuclei were labeled with DAPI. Wider distribution of centrosomes was observed in f. (g,h) Immunostaining for Numb (green) in E14.5 brain sections from control (g) and LIS1-overexpressing (h) mice. Wider cytoplasmic distribution of Numb was observed in h. (i,j) Immunostaining for pan-cadherin (green) in E14.5 brain sections from control (i) and LIS1-overexpressing (j) mice. Lower cadherin expression was observed in the apical surface of j. (k–n) Immuno-fluorescence for aPKCλ (green), PAR6 (red) and nuclei (blue) in control (k,m) and LIS1-overexpressing (l,n) E14.5 brain sections. Arrowheads in k and l highlight discontinuity in aPKC immunostaining. PAR6 staining was markedly lower in n versus m. (o–t) Electron micrographs of E12.5 brain sections at two magnifications. (o,r) Control in which transgene was inserted without Cre. (p,s) Additional Cre control. (q,t) LIS1 overexpression. Disorganization and reduction in adherens junctions were observed at lower (q) and higher magnification (t) in LIS1-overexpressing brains. (u) Cdc42 activity, measured by pulling down GTP-bound form of Cdc42. Addition of GTPγS served as positive control; GDP served as negative control. Less Cdc42-GTP was detected in E15.5 LIS1-overexpressing brain lysates compared to control.
Additional polarity markers such as atypical protein kinase C (aPKC) and PAR6 (Fig. 5k–n) are usually highly concentrated in the ventricular surface. In LIS1-overexpressing brains, we observed a noncontinuous band of aPKC expression (Fig. 5k,l, arrowheads) with reduced PAR6 expression (Fig. 5m,n). Electron microscopy studies (Fig. 5o–t) revealed progenitors at the ventricular zone that were only partially polarized in LIS1-overexpressing brain sections, in comparison to the organized cells of control (Fig. 5o,r) or Cre-control (Fig. 5p,s) brains. The abundance of adherens junctions was reduced in LIS1-overexpressing brain sections, and in many cells with adherens junctions, the junctions were not organized perpendicular to the ventricular surface as in control cells (Fig. 5o–t). The micrographs also revealed an increase in the number of apoptotic cells compared to controls (data not shown).
Time-lapse microscopy of embryonic brain sections detected a marked effect on nuclear motility in the ventricular zone (Supplementary Movies 1 and 2 online). In control brain sections, we observed prototypical interkinetic nuclear movement, whereas in sections from LIS1-overexpressing littermates, cells moved significantly faster than control cells (P = 0.0004 by Mann-Whitney test; average velocity 86.96 ± 5.447 µm/h for LIS1-overexpressing nuclei (n = 81) versus 54.35 ± 3.917 µm/h for controls (n = 58)) and in random orientations. Velocity frequency distribution revealed that most control nuclei showed similar velocities, whereas nuclei of LIS1-overexpressing cells were distributed among multiple velocity bins (Supplementary Fig. 4 online). Furthermore, the activity of a key regulator of neuronal polarity, Cdc42, was lower in brain lysates from LIS1-overexpressing mice (Fig. 5u). Collectively, these results show that increased LIS1 expression reduced cellular polarity in the ventricular zone.
LIS1 overexpression affects radial and tangential migration
We tested whether LIS1 overexpression affects neuronal migration. We evaluated two routes of migration: radial and tangential. Neurons born in the ventricular zone migrate radially to their appropriate position in the cerebral cortex. Early-born neurons form the preplate, which is split after radial migration of later-born neurons. In control mice at E14.5, the cortical plate is already visible in the lateral and dorsal regions of the pallium. In LIS1-overexpressing E14.5 littermates, we noted a delay in preplate splitting (Fig. 6a,b). A delay in radial migration was identified by cell counts in BrdU experiments at E13.5 and examined at E15.5 (Fig. 6c) or postnatal day 0 (P0; Fig. 6d–e). We observed a delay in tangential migration at E12.5 and E14.5 by genetic labeling of the interneuron population (glutamic acid decarboxylase-green fluorescence protein knock-in mice (GAD67-GFP(Δ neo))28 crossed with LIS1::Foxg1(Cre) mice; Fig. 6f–k). These results were corroborated by an observable reduction in the number of migrating calbindin-positive interneurons found in the P0 cerebral cortex (Fig. 6l,m). In summary, LIS1 overexpression affected both radial and tangential migration.
Figure 6.
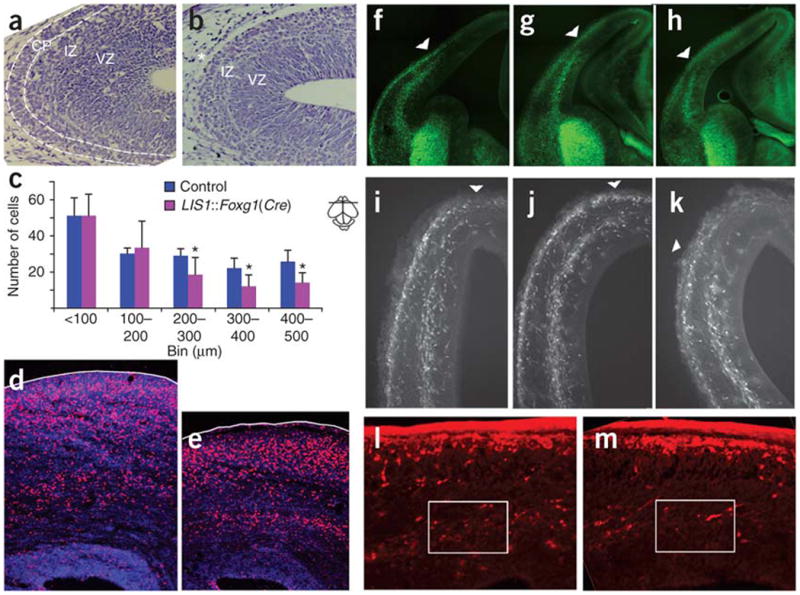
Radial and tangential migration is delayed in LIS1-overexpressing mice. (a,b) Cresyl violet staining of E14.5 brain sections detected cortical plate (CP) in control (a) but not LIS1-overexpressing (b) mice. IZ, intermediate zone; VZ, ventricular zone. (c) BrdU labeling at E13.5 and analysis at E15.5 (mean ± s.d.). A significant number of LIS1-overexpressing neurons in LIS1::Foxg1(Cre) mice did not reach more superficial areas of the cortex. Bins represent distance from the ventricle in micrometers. Bin 400–500, P = 0.012; bin 300–400, P = 0.027; bin 200–300, P = 0.043 by Student t test. n = 5. (d,e) BrdU labeling at E13.5 and analysis at P0. Brain sections were immunostained for BrdU (red) and cell nuclei (DAPI; blue). BrdU-labeled LIS1-overexpressing cells (e) reached fewer superficial positions than did control cells (d), and LIS1-overexpressing brain width was thinner. (f–m) Tangential migration was reduced in LIS1-overexpressing mice. (f–h) GAD67-GFP-labeled interneurons (green) analyzed at E12.5. Shorter migratory route was undertaken in LIS1-overexpressing brain section (h) compared to two controls, transgene without Cre (f) and Cre without transgene (g). (i–k) GAD67-GFP-labeled interneurons (white) analyzed at E14.5. Shorter migratory route was undertaken in LIS1-overexpressing brain section (k) versus transgene without Cre (i) and Cre control (j). The arrowheads in f–k indicate the dorsal edge of interneurons' tangential migratory stream in the pallium. (l,m) Reduced tangential migration detected by immunostaining for calbindin (red). Fewer cells were observed in boxed area for LIS1-overexpressing mice at P0 (m) compared to control mice (l).
Discussion
Diseases resulting from structural changes of the genome have been referred to as genomic disorders1,29. Our findings increase the repertoire of known genomic disorders within the MDS locus, and combined data derived from a mouse model enabled us to further delineate clinical phenotypes and attribute them to CNVs of crucial genes. The seven duplications described here are nonrecurrent, with all of the breakpoints distinct from each other. The three complex rearrangements and two of the three simple duplications we analyzed probably occurred by the DNA-replication FoSTeS mechanism24.
Our conclusion that the observed phenotypes may be associated with increased expression of specific genes is based on several observations, including real-time RT-PCR results. The seven individuals described here all share developmental delays and some cognitive difficulties and/or speech abnormalities, but they vary in other clinical manifestations (Fig. 7). Individuals with duplications including YWHAE showed distinct facial features that were not observed in subjects with PAFAH1B1 duplication. Likewise, individuals with extended deletions in the MDS locus show facial dysmorphologies14. An overgrowth phenotype or relatively higher body weight and/or length were observed in individuals with a duplication including YWHAE (n = 4), except for the individual with a normal copy number of CRK and MYO1C. Overgrowth (within the normal growth curve) is relatively rare in the large category of individuals carrying genomic rearrangements. The tendency of macrosomia may be attributed to CRK being involved in growth regulation and cell differentiation30.
Figure 7.
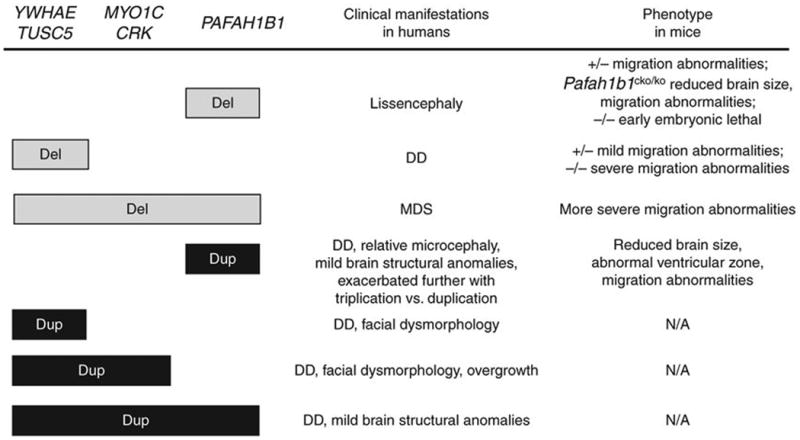
Clinical manifestations observed in affected individuals with deletions or duplications of dosage-sensitive genes within the MDS region and comparable phenotypes in transgenic mice. We considered copy numbers of the two MDS crucial genes, PAFAH1B1 and YWHAE, as well as CRK and MYO1C. TUSC5 is also shown because its role in MDS and 17p13.3 duplication is still unknown. Phenotypes in Pafah1b1-mutant mice are dosage sensitive19: heterozygous mice (∼45%) showed disorganization in the cortex, hippocampus and olfactory bulb; Pafah1b1cko/ko mice with further reduction (∼35%) showed defects analogous to human lissencephaly, such as disorganized cortical layers, microcephaly and cerebellar defects. Mild structural anomalies in individuals with PAFAH1B1 duplication include dysgenesis of the corpus callosum and mild volume loss in the cerebellum, occipital cortex and cerebrum. Del, deletion; Dup, duplication; DD, developmental delay; −/−, homozygous mutants; +/−, heterozygous mutants; N/A, not available.
Subject 7, with a large duplication including both PAFAH1B1 and YWHAE, showed no apparent facial dysmorphologies and a relatively higher body weight. These findings may underscore possible genetic interactions among genes located in the MDS locus. A genetic interaction has been noted between LIS1 and 14-3-3ε, both of which participate in regulation of neuronal migration15. Nevertheless, an additional genetic interaction between LIS1 and CRK may be important in regulating neuronal migration. Both LIS1 and CRK bind to phosphorylated DAB1 downstream of the reelin pathway, which is essential to cortical development31–33.
Individuals with PAFAH1B1 duplication showed cognitive, neuro-behavioral and subtle brain abnormalities; the dosage effect was exacerbated in the individual with triplication of PAFAH1B1. Notably, the brains of those individuals were smaller mainly in the occipital cortex, which is also more affected in individuals with PAFAH1B1 deletions26 and in mutant mice, consistent with the developmental expression gradient18. In addition to PAFAH1B1, there are six more known genes (SMG6, SRR, SGSM2, MNT, METT10D and KIAA0664) within the ∼400-kb overlapping region among the three individuals with PAFAH1B1 duplications. However, the established role of PAFAH1B1 in individuals with deletions or point mutations and the phenotypes observed in LIS1-overexpressing mice support the notion that LIS1 is a major factor for the brain phenotypes in individuals with PAFAH1B1 duplications.
One consideration to be addressed is the tendency of isolated DsRed protein to form tetramers34. However, the elution profile of brain lysate containing LIS1-DsRed from a gel filtration column was consistent with a predominant dimeric form and did not support the existence of abundant tetrameric forms (Supplementary Fig. 5 online). Previous studies indicated that most LIS1 protein interactions require the dimeric form, thus fully supporting the notion that LIS1-DsRed is functional and in these respects similar to the endogenous protein. The most parsimonious explanation from the aggregate data suggests that phenotypes observed in LIS1-overexpressing mice are caused by increased LIS1 dosage.
Smaller brains and potential migration deficits are recapitulated in conditional trans-genic mice overexpressing LIS1 in the developing brain. We observed an evident reduction of radial and tangential migration in LIS1-overexpressing brains compared to control brains. Furthermore, the brains of LIS1-overexpressing mice were smaller and showed increased apoptosis and partial loss of cell polarity. Our study indicates a role for LIS1 in determining cellular polarity. Among neuronal progenitors within the ventricular zone, it is likely that subgroups differed in their sensitivity to LIS1 dosage, as we observed normal alignment of the radial glia. The neuroepithelium of LIS1-overex-pressing mice showed several abnormal features, such as thinning of the ventricular zone, less compact cellular organization, faster motility in unexpected orientations and ectopic positioning of mitotic cells. In the ventricular zone, neural precursors are joined by apical junctional complexes, and intracellular bands of actin stabilize them into a neuroepithelial sheet. The apical junctional complex that links neighboring precursor cells consists of cadherin at the cell surface and α- and β-catenin in the cytoplasm7. Our results indicated a reduction and disorganization of the adherens junctions in brain sections overexpressing LIS1. This was accompanied by a wide distribution of the intracellular protein β-catenin, which was supposed to be linked to the apical junctional complexes. The effect of LIS1 overexpression on the intracellular localization of β-catenin may occur through the known interaction between dynein and β-catenin35. In addition, Numb and other polarity markers showed expression differences in LIS1-overexpressing brains. Collectively, LIS1-overexpressing brains showed abnormalities in the neuroepithelium, which may be attributed in part to a partial loss of neuroepithelial polarity.
Our findings are complementary to recent findings, using a conditional knockout model, that LIS1 is essential for neuroepithelial expansion36. The polarity-associated activity of LIS1 is most likely to be mediated through regulation of the microtubule-associated molecular motor protein cytoplasmic dynein (reviewed in refs. 37 and 38). Furthermore, a possible genetic interaction between the dynein pathway and the polarity pathway is suggested by the fact that orthologs of LIS1, cytoplasmic dynein and the lissencephaly-associated protein DCX have been shown to affect the first asymmetric cell division in C. elegans14.
The results of reduced cellular polarity in the ventricular zone are highly variable, even with the same gene involved. For example, conditional knockout of Cdc42 using various Cre drivers resulted in changes in cell fate39 or holoprosencephaly40, with reduced ventricular cell polarity occurring in both cases. Notably, we observed here a reduction in activated Cdc42, as has been previously observed in Pafah1b1+/− mice41,42. LIS1 may regulate actin polymerization through its interaction with an IQGAP-containing complex41,42, thereby activating Cdc42, or through the recently reported interaction of Ndel1 with Cdc42GAP43. Activation of Cdc42 is a key event in cellular polarization, particularly in the nervous system.
Reduced cellular polarity elsewhere in the body may explain the major internal organ abnormalities that were characteristic for individuals with duplication of PAFAH1B1. The degree to which specific organs are affected may depend on variation in genetic background among duplication carriers. Sensitivity to LIS1 dosage has been shown in the case of LIS1 reduction19, and we showed here sensitivity to increased LIS1 dosage. Compared to PAFAH1B1 duplication, triplication of PAFAH1B1 (subject 6) resulted in a more severe phenotype, including mental retardation and profound muscle hypotonia.
Collectively, our studies describe new genomic disorders in the MDS locus and further document that de novo duplication CNV can be complex and can occur by diverse mechanisms. We also provide evidence supporting genetic interactions between dosage-sensitive genes mapping within a CNV. Phenotypic analyses of LIS1-overexpressing mice at the cellular level revealed cell polarity and neuronal migration defects. Such subtle neuronal migration defects are not expected to be detected by MRI scans. Our findings suggest that brain and neurodevelopmental defects associated with other human neurocognitive impairments may not be detected by current brain imaging techniques. Our approach of identifying individuals with specific genomic changes through forward genomics and then establishing genomotype-phenotype associations through reverse genomics, combined with analyses from a related mouse model, enables a partial explanation of the phenotypes observed in individuals with genomic rearrangements.
Methods
Subjects
Subjects and their family members were recruited from those with duplication in 17p13.3 as detected by clinical diagnostic testing using array CGH44–46. Clinical information and photographs were collected, and peripheral blood and/or DNA samples were obtained after informed consent using a protocol approved by the Institutional Review Board for Human Subject Research at Baylor College of Medicine.
Identification of microduplication in 17p13.3 by array CGH
Microduplications in five subjects were identified in the Medical Genetics Laboratories at Baylor College of Medicine by clinical chromosomal microarray analysis using either a targeted BAC array (subjects 2, 5 and 7) or an oligonucleotide-based BAC emulation array (subjects 1 and 6)44–46. Microduplications in subjects 3 and 4 were identified by Signature Genomics Laboratories and LabCorp, respectively. The array CGH experiments and data analysis have been described44–46. FISH analysis was done on phytohemagglutinin-stimulated peripheral blood lymphocytes according to a standard clinical protocol.
Fine mapping by genome-wide oligonucleotide array
An Agilent custom 4 × 44K oligonucleotide array with 44,000 oligonucleotides spanning the entire short arm of human chromosome 17 at a resolution of 2 or 3 oligonucleotides per kilobase of DNA sequence was used to fine-map the duplicated region. The normal reference controls for array CGH were purchased from the Coriell Institute for Medical Research (male, NA10851; female, NA15510). The array CGH experiments and data analysis have been described46.
Generation of transgenic mice
Our transgenic construct was based on a vector designed for monitoring Cre recombinase activity47. A strong promoter, CAGG, comprising the cytomegalovirus enhancer and chicken β-actin promoter, drives the expression of a reporter gene (lacZ). The reporter is followed by a neoR cassette and is flanked by loxP sites. This construct allows the transgene to be expressed only after Cre excision of the lacZ reporter, the neoR cassette and three copies of the SV40 polyA signal that serves as a transcriptional stop. This system enables the selection of embryonic stem cell lines in which transgene integration allows widespread expression of the reporter. We constructed a LIS1-DsRed fusion protein that allowed us to monitor the expression of the transgene in the transfected clones and mice. The LIS1-DsRed protein has been extensively studied, and it faithfully represents the localization of the endogenous protein48. The resulting mice expressed the transgene Tg(CAGG-loxP-LacZ-neo-loxP-PAFAH1B-DsRed). The lacZ reporter provides a quick and relatively easy genotyping method for the mice. The mouse lines were crossed with Swiss mice carrying the Foxg1tm1(Cre)Skm transgene49 (Foxg1(Cre) mice), which expresses Cre in a restricted manner in the developing telencephalon starting at E9. The transgenic mice containing both the LIS1-DsRed and Foxg1(Cre) transgenes were designated LIS1::Foxg1(Cre). For the above experiments, mice containing but not expressing the LIS1-DsRed transgene were used as a control, and in indicated experiments, wild-type mice were used as an additional control. Mice containing Foxg1(Cre) but not LIS1-DsRed were used for Cre expression control. For all of the parameters measured, there were no differences between the different controls. Mouse protocols were approved by the Institutional Animal Care and Use Committee of the Weizmann Institute.
Measurement of Cdc42 activity
Cdc42 regulates molecular events by cycling between an inactive GDP-bound form and an active GTP-bound form. In its active state, Cdc42 binds specifically to the p21 binding domain of p21-activated protein kinase to control downstream signaling cascades. In the Cdc42 activation assay, this binding domain, bound to agarose beads, was used to selectively isolate and pull down the active form of Cdc42. Subsequently, the precipitated GTP-Cdc42 was detected by immunoblot analysis using an antibody to Cdc42 (ref. 50). The procedure was done using a Cdc42 activation assay kit (Upstate Biotechnology).
Histology and immunostaining
Embryos were fixed with 4% paraformaldehyde in PBS. Embryos older than E14 were perfused and postfixed in paraformaldehyde overnight. Samples were cryoprotected in 20% sucrose-PBS overnight, embedded in OCT and cryosectioned (20 µm). Paraffin wax–embedded samples were sectioned (5–6 µm) and stained with the Nissl method using standard protocols. When required, BrdU was injected intraperitoneally (0.01 ml of 5 mg/ml BrdU solution per gram body weight) into pregnant mice at the time points indicated. Immunostaining was done using 10% normal goat, fetal calf or horse serum, depending on the origin of the secondary antibody, in PBS with 0.1% Triton X-100 as a blocking reagent. The number of cells with phosphorylated histone H3 was determined by counting in a 300-µm width area in the ventricular zone, up to four cell layers away from the ventricular surface. The following primary antibodies were used: rabbit antibody to calbindin (Swant Bellinzona), mouse antibody to pericentrin (BD Biosciences Clontech), rabbit antibody to pan-cadherin (Sigma), rabbit antibody to β-catenin (Sigma), rabbit antibody to Tbr2 (Chemicon), goat antibody to PAR-6DA (Santa Cruz Biotechnology), antibody to Numb (Developmental Studies Hybridoma Bank), mouse antibody to aPKC (BD Biosciences Clontech), rat antibody to BrdU (Serotec), rabbit antibody to phosphorylated histone H3 (Upstate Biotechnology) and Alexa Fluor 633–conjugated antibody to phalloidin (Molecular Probes). TUNEL staining was done using an Apop tag kit (Chemicon). DAPI (2.5 µg/ml; Sigma) was included in the final wash buffer (PBS) for nuclear staining. Barrel labeling and oxacarbocyanine labeling are described in Supplementary Methods online.
Electron microscopy
Brains of E12.5 embryos were fixed with 3% paraformaldehyde and 2.5% glutaraldehyde in 0.1 M cacodylate buffer (pH 7.4). Samples were embedded in 3.5% agarose and sectioned to 100-mm-thick slices using a vibratome. Slices were washed in the same buffer and postfixed with 1% osmium tetroxide. After being stained with 2% uranyl acetate in water for 1 h at room temperature (24 °C), the slices were dehydrated in graded ethanol solutions and embedded in Epon 812. Ultrathin sections (70–90 nm thick) were prepared with a Leica UCTultramicrotome, analyzed under 120 kVon a Tecnai 12 transmission electron microscope (FEI) and digitized with Eagle (FEI) and MegaView III charge-coupled device cameras using AnalySIS and TIA software. The electron microscopy studies were conducted at the Irving and Cherna Moskowitz Center for Nano and Bio-Nano Imaging at the Weizmann Institute of Science.
Live imaging
Brains were removed into cold L-15 supplemented with glucose (0.6%) and saturated with oxygen. Freshly isolated whole brains were sliced in a coronol orientation by vibrotome (300 µm) and then transferred onto inserts (MilliCell-CM; 0.4 mm; Millipore) floating on serum-free medium (Neurobasal medium supplemented with B27, N2, GlutaMax, glucose and gentamicin). Slices were incubated for 2 h before imaging. For nuclei visualization, Hoechst 333342 (Molecular Probes) was added to the medium prior to imaging. During time-lapse video microscopy, temperature was maintained at 37 °C. Analysis of movies was done using Imaris 6.1 (Bitplane).
Statistical analysis
Statistical analysis was conducted using Prism 4 software (GraphPad Software).
Supplementary Material
Acknowledgments
We thank the participating families for their cooperation in the study, the members of the Chromosomal Microarray Analysis and Cytogenetic/FISH laboratories for technical assistance, G. Eichele for help with the in situ hybridization experiments, E. Arama and S. Haiderleu for useful comments and advice, S. McConnell for the Foxg1(Cre) mice and M. O'Gorman (Children's Memorial Hospital, Chicago) for assistance with specimen collection. The work was supported in part by the Israeli Science Foundation (grant no. 270/04 to O.R. and an equipment grant), the Foundation Jérôme Lejeune, the Minerva Foundation with funding from the Federal German Ministry for Education and Research, German-Israeli collaboration grant Gr-1905, March of Dimes grant 6-FY07-388, collaborative BSF grant 2007081 (to O.R. and J.R.L.), a grant from the Paul Godfrey Research Foundation in Children's Diseases, the Benoziyo Center for Neurological Diseases, the Kekst Center, the Forcheimer Center, a Weizmann-Pasteur collaborative grant, a research grant from the Michigan Women of Wisdom Fund to support Weizmann Women scientists, support from Maurice Janin, the Jewish Communal Fund, Albert Einstein College of Medicine of Yeshiva University, the David and Fela Shapell Family Center research grant for Genetic Disorders Research, grants DIGESIC-MEC BFU2005-09085 and Ingenio 2010 MEC-CONSOLIDER CSD2007-00023 (to S.M.), support from EU grant LSHG-CT-2004-512003, the Baylor Medical Genetics Laboratories, the Mental Retardation Developmental Disabilities Research Center (HD024064) and a Program Project grant (P01 HD39420) from the National Institute of Child Health and Human Development (to J.R.L.). O.R. is an Incumbent of the Bernstein-Mason professorial chair of Neurochemistry.
Footnotes
Note: Supplementary information is available on the Nature Genetics website.
Author Contributions: W.B. coordinated human studies and conducted real time RT-PCR assays. T.S. produced transgenic mice and conducted mouse studies. O.A.S. recruited patients and reviewed clinical data. F.Z. conducted high-density array CGH and breakpoint analyses. M.A.W. carried out cell culture. J.V.H. reviewed the MRI data. T.L., V.S. and S.M. assisted in mouse analyses. Y.Y. provided GAD67-GFP mice. D.A.P. and K.L.G. conducted SNP genotyping. M.M.N., V.A.S., S.S.A., S.K.S., D.J.H., D.-L.D.-S., M.H. and A.L.B. recruited and clinically characterized patients. S.W.C., X.-Y.L. and T.S. were involved in cytogenetic and clinical array CGH studies. J.R.L. and O.R. were involved in research design and data analyses. W.B., T.S., O.A.S., O.R. and J.R.L. prepared the manuscript.
Contributor Information
James R Lupski, Email: jlupski@bcm.tmc.edu.
Orly Reiner, Email: orly.reiner@weizmann.ac.il.
References
- 1.Lupski JR. Genomic rearrangements and sporadic disease. Nat Genet. 2007;39:S43–S47. doi: 10.1038/ng2084. [DOI] [PubMed] [Google Scholar]
- 2.Reiner O, et al. Isolation of a Miller-Dieker lissencephaly gene containing G protein beta-subunit-like repeats. Nature. 1993;364:717–721. doi: 10.1038/364717a0. [DOI] [PubMed] [Google Scholar]
- 3.Barkovich AJ, Kuzniecky RI, Jackson GD, Guerrini R, Dobyns WB. A developmental and genetic classification for malformations of cortical development. Neurology. 2005;65:1873–1887. doi: 10.1212/01.wnl.0000183747.05269.2d. [DOI] [PubMed] [Google Scholar]
- 4.Harding B. In: Dysplasias of Cerebral Cortex and Epilepsy. Guerrini R, editor. Lippincott-Raven; Philadelphia: 1996. pp. 81–88. [Google Scholar]
- 5.Kamiya A, et al. A schizophrenia-associated mutation of Drosoph. Inf. Serv.C1 perturbs cerebral cortex development. Nat Cell Biol. 2005;7:1167–1178. doi: 10.1038/ncb1328. [DOI] [PubMed] [Google Scholar]
- 6.Schumacher J, et al. Strong genetic evidence of DCDC2 as a susceptibility gene for dyslexia. Am J Hum Genet. 2006;78:52–62. doi: 10.1086/498992. [DOI] [PMC free article] [PubMed] [Google Scholar]
- 7.Walsh T, et al. Rare structural variants disrupt multiple genes in neurodevelopmental pathways in schizophrenia. Science. 2008;320:539–543. doi: 10.1126/science.1155174. [DOI] [PubMed] [Google Scholar]
- 8.Xu B, et al. Strong association of de novo copy number mutations with sporadic schizophrenia. Nat Genet. 2008;40:880–885. doi: 10.1038/ng.162. [DOI] [PubMed] [Google Scholar]
- 9.Stefansson H, et al. Large recurrent microdeletions associated with schizophrenia. Nature. 2008;455:232–236. doi: 10.1038/nature07229. [DOI] [PMC free article] [PubMed] [Google Scholar]
- 10.International Schizophrenia Consortium. Rare chromosomal deletions and duplications increase risk of schizophrenia. Nature. 2008;455:237–241. doi: 10.1038/nature07239. [DOI] [PMC free article] [PubMed] [Google Scholar]
- 11.Sebat J, et al. Strong association of de novo copy number mutations with autism. Science. 2007;316:445–449. doi: 10.1126/science.1138659. [DOI] [PMC free article] [PubMed] [Google Scholar]
- 12.Weiss LA, et al. Association between microdeletion and microduplication at 16p11.2 and autism. N Engl J Med. 2008;358:667–675. doi: 10.1056/NEJMoa075974. [DOI] [PubMed] [Google Scholar]
- 13.Kumar RA, et al. Recurrent 16p11.2 microdeletions in autism. Hum Mol Genet. 2008;17:628–638. doi: 10.1093/hmg/ddm376. [DOI] [PubMed] [Google Scholar]
- 14.Cardoso C, et al. Refinement of a 400-kb critical region allows genotypic differentiation between isolated lissencephaly, Miller-Dieker syndrome, and other phenotypes secondary to deletions of 17p13.3. Am J Hum Genet. 2003;72:918–930. doi: 10.1086/374320. [DOI] [PMC free article] [PubMed] [Google Scholar]
- 15.Toyo-oka K, et al. 14–3-3ε is important for neuronal migration by binding to NUDEL: a molecular explanation for Miller-Dieker syndrome. Nat Genet. 2003;34:274–285. doi: 10.1038/ng1169. [DOI] [PubMed] [Google Scholar]
- 16.Mikhail FM, et al. Complete trisomy 17p syndrome in a girl with der(14)t(14;17)(p11.2;p11.2) Am J Med Genet A. 2006;140:1647–1654. doi: 10.1002/ajmg.a.31330. [DOI] [PubMed] [Google Scholar]
- 17.Morelli SH, Deubler DA, Brothman LJ, Carey JC, Brothman AR. Partial trisomy 17p detected by spectral karyotyping. Clin Genet. 1999;55:372–375. doi: 10.1034/j.1399-0004.1999.550513.x. [DOI] [PubMed] [Google Scholar]
- 18.Cahana A, et al. Targeted mutagenesis of Lis1 disrupts cortical development and LIS1 homodimerization. Proc Natl Acad Sci USA. 2001;98:6429–6434. doi: 10.1073/pnas.101122598. [DOI] [PMC free article] [PubMed] [Google Scholar]
- 19.Hirotsune S, et al. Graded reduction of Pafah1b1 (Lis1) activity results in neuronal migration defects and early embryonic lethality. Nat Genet. 1998;19:333–339. doi: 10.1038/1221. [DOI] [PubMed] [Google Scholar]
- 20.Shu T, et al. Ndel1 operates in a common pathway with LIS1 and cytoplasmic dynein to regulate cortical neuronal positioning. Neuron. 2004;44:263–277. doi: 10.1016/j.neuron.2004.09.030. [DOI] [PubMed] [Google Scholar]
- 21.Tsai JW, Bremner KH, Vallee RB. Dual subcellular roles for LIS1 and dynein in radial neuronal migration in live brain tissue. Nat Neurosci. 2007;10:970–979. doi: 10.1038/nn1934. [DOI] [PubMed] [Google Scholar]
- 22.Tsai JW, Chen Y, Kriegstein AR, Vallee RB. LIS1 RNA interference blocks neural stem cell division, morphogenesis, and motility at multiple stages. J Cell Biol. 2005;170:935–945. doi: 10.1083/jcb.200505166. [DOI] [PMC free article] [PubMed] [Google Scholar]
- 23.Peiffer DA, et al. High-resolution genomic profiling of chromosomal aberrations using Infinium whole-genome genotyping. Genome Res. 2006;16:1136–1148. doi: 10.1101/gr.5402306. [DOI] [PMC free article] [PubMed] [Google Scholar]
- 24.Lee JA, Carvalho CM, Lupski JRA. DNA replication mechanism for generating nonrecurrent rearrangements associated with genomic disorders. Cell. 2007;131:1235–1247. doi: 10.1016/j.cell.2007.11.037. [DOI] [PubMed] [Google Scholar]
- 25.Dobyns WB, Reiner O, Carrozzo R, Ledbetter DH. Lissencephaly. A human brain malformation associated with deletion of the LIS1 gene located at chromosome 17p13. J Am Med Assoc. 1993;270:2838–2842. doi: 10.1001/jama.270.23.2838. [DOI] [PubMed] [Google Scholar]
- 26.Pilz DT, et al. LIS1 and XLIS (DCX) mutations cause most classical lissencephaly, but different patterns of malformation. Hum Mol Genet. 1998;7:2029–2037. doi: 10.1093/hmg/7.13.2029. [DOI] [PubMed] [Google Scholar]
- 27.Chenn A, Zhang YA, Chang BT, McConnell SK. Intrinsic polarity of mammalian neuroepithelial cells. Mol Cell Neurosci. 1998;11:183–193. doi: 10.1006/mcne.1998.0680. [DOI] [PubMed] [Google Scholar]
- 28.Tamamaki N, et al. Green fluorescent protein expression and colocalization with calretinin, parvalbumin, and somatostatin in the GAD67-GFP knock-in mouse. J Comp Neurol. 2003;467:60–79. doi: 10.1002/cne.10905. [DOI] [PubMed] [Google Scholar]
- 29.Lupski JR. Genomic disorders: structural features of the genome can lead to DNA rearrangements and human disease traits. Trends Genet. 1998;14:417–422. doi: 10.1016/s0168-9525(98)01555-8. [DOI] [PubMed] [Google Scholar]
- 30.Feller SM. Crk family adaptors-signalling complex formation and biological roles. Oncogene. 2001;20:6348–6371. doi: 10.1038/sj.onc.1204779. [DOI] [PubMed] [Google Scholar]
- 31.Assadi AH, et al. Interaction of reelin signaling and Lis1 in brain development. Nat Genet. 2003;35:270–276. doi: 10.1038/ng1257. [DOI] [PubMed] [Google Scholar]
- 32.Ballif BA, et al. Activation of a Dab1/CrkL/C3G/Rap1 pathway in Reelin-stimulated neurons. Curr Biol. 2004;14:606–610. doi: 10.1016/j.cub.2004.03.038. [DOI] [PubMed] [Google Scholar]
- 33.Chen K, et al. Interaction between Dab1 and CrkII is promoted by Reelin signaling. J Cell Sci. 2004;117:4527–4536. doi: 10.1242/jcs.01320. [DOI] [PubMed] [Google Scholar]
- 34.Wall MA, Socolich M, Ranganathan R. The structural basis for red fluorescence in the tetrameric GFP homolog DsRed. Nat Struct Biol. 2000;7:1133–1138. doi: 10.1038/81992. [DOI] [PubMed] [Google Scholar]
- 35.Ligon LA, Karki S, Tokito M, Holzbaur EL. Dynein binds to β-catenin and may tether microtubules at adherens junctions. Nat Cell Biol. 2001;3:913–917. doi: 10.1038/ncb1001-913. [DOI] [PubMed] [Google Scholar]
- 36.Yingling J, et al. Neuroepithelial stem cell proliferation requires LIS1 for precise spindle orientation and symmetric division. Cell. 2008;132:474–486. doi: 10.1016/j.cell.2008.01.026. [DOI] [PMC free article] [PubMed] [Google Scholar]
- 37.Hirokawa N, Takemura R. Molecular motors in neuronal development, intracellular transport and diseases. Curr Opin Neurobiol. 2004;14:564–573. doi: 10.1016/j.conb.2004.08.011. [DOI] [PubMed] [Google Scholar]
- 38.Reiner O, Sapoznik S, Sapir T. Lissencephaly 1 linking to multiple diseases: mental retardation, neurodegeneration, schizophrenia, male sterility, and more. Neuromolecular Med. 2006;8:547–565. doi: 10.1385/NMM:8:4:547. [DOI] [PubMed] [Google Scholar]
- 39.Cappello S, et al. The Rho-GTPase cdc42 regulates neural progenitor fate at the apical surface. Nat Neurosci. 2006;9:1099–1107. doi: 10.1038/nn1744. [DOI] [PubMed] [Google Scholar]
- 40.Chen L, et al. Cdc42 deficiency causes Sonic hedgehog-independent holoprosencephaly. Proc Natl Acad Sci USA. 2006;103:16520–16525. doi: 10.1073/pnas.0603533103. [DOI] [PMC free article] [PubMed] [Google Scholar]
- 41.Kholmanskikh SS, Dobrin JS, Wynshaw-Boris A, Letourneau PC, Ross ME. Disregulated RhoGTPases and actin cytoskeleton contribute to the migration defect in Lis1-deficient neurons. J Neurosci. 2003;23:8673–8681. doi: 10.1523/JNEUROSCI.23-25-08673.2003. [DOI] [PMC free article] [PubMed] [Google Scholar]
- 42.Kholmanskikh SS, et al. Calcium-dependent interaction of Lis1 with IQGAP1 and Cdc42 promotes neuronal motility. Nat Neurosci. 2006;9:50–57. doi: 10.1038/nn1619. [DOI] [PubMed] [Google Scholar]
- 43.Shen Y, et al. Nudel binds Cdc42GAP to modulate Cdc42 activity at the leading edge of migrating cells. Dev Cell. 2008;14:342–353. doi: 10.1016/j.devcel.2008.01.001. [DOI] [PubMed] [Google Scholar]
- 44.Cheung SW, et al. Development and validation of a CGH microarray for clinical cytogenetic diagnosis. Genet Med. 2005;7:422–432. doi: 10.1097/01.gim.0000170992.63691.32. [DOI] [PubMed] [Google Scholar]
- 45.Lu X, et al. Clinical implementation of chromosomal microarray analysis: summary of 2513 postnatal cases. PLoS ONE. 2007;2:e327. doi: 10.1371/journal.pone.0000327. [DOI] [PMC free article] [PubMed] [Google Scholar]
- 46.Ou Z, et al. BAC-emulation oligonucleotide arrays for targeted clinical array CGH analyses. Genet Med. 2008;10:278–289. doi: 10.1097/GIM.0b013e31816b4420. [DOI] [PMC free article] [PubMed] [Google Scholar]
- 47.Lobe CG, et al. Z/AP, a double reporter for cre-mediated recombination. Dev Biol. 1999;208:281–292. doi: 10.1006/dbio.1999.9209. [DOI] [PubMed] [Google Scholar]
- 48.Coquelle FM, et al. LIS1, CLIP-170's key to the dynein/dynactin pathway. Mol Cell Biol. 2002;22:3089–3102. doi: 10.1128/MCB.22.9.3089-3102.2002. [DOI] [PMC free article] [PubMed] [Google Scholar]
- 49.Hebert JM, McConnell SK. Targeting of cre to the Foxg1 (BF-1) locus mediates loxP recombination in the telencephalon and other developing head structures. Dev Biol. 2000;222:296–306. doi: 10.1006/dbio.2000.9732. [DOI] [PubMed] [Google Scholar]
- 50.Benard V, Bohl BP, Bokoch GM. Characterization of rac and cdc42 activation in chemoattractant-stimulated human neutrophils using a novel assay for active GTPases. J Biol Chem. 1999;274:13198–13204. doi: 10.1074/jbc.274.19.13198. [DOI] [PubMed] [Google Scholar]
Associated Data
This section collects any data citations, data availability statements, or supplementary materials included in this article.