Abstract
A new method is developed to determine the presence of sunflower oil in olive oil. α-tocopherol is selected as discriminating parameter for detecting sunflower oil adulterant in olive oil. Admixtures of olive oil and sunflower oil (5 %, 10 %, 15 % and 20 % sunflower oil in olive oil) are prepared. These admixtures are analysed by reversed phase high pressure liquid chromatography coupled with fluorescence detector. The sample preparation does not require saponification or addition of antioxidant. The chromatographic system consists of a C18 column with methanol: acetonitrile (50:50) mobile phase. Fluorescence detector excitation wavelength is set at 290 nm and emission wavelength is set at 330 nm. The α tocopherol concentration increases linearly in olive oil adulterated with sunflower oil. The method is simple, selective, sensitive and is precise (RSD = 2.65 %) for α tocopherol. The present method can precisely detect 5 % sunflower oil in olive oil.
Keywords: Olive oil, Adulteration, Vegetable oil, Sunflower oil α Tocopherol and High pressure liquid chromatography
Introduction
Vegetable oil are main source of vitamin E which is composed of eight naturally occurring isomers and is composed of mainly four tocopherols (α-tocopherol, β-tocopherol, γ-tocopherol and δ-tocopherol) and four tocotrienols (α-tocotrienol, β-tocotrienol, γ-tocotrienol and δ-tocotrienol). Vitamin E prevents cancer related disease (Nesaretnem et al. 1995; Qureshi et al. 2001; Saldeen and Saldeen 2005; Brigelius-Flohé 2006; Nesaretnem et al. 2007), cardiovascular diseases (Traber 2001; Nesaretnem et al. 2007) and being antioxidant in nature prevents rancidity of oil and increases shelf life of vegetable oil. α-tocopherol is the most active form of vitamin E and its concentration in sunflower oil is found to be in the range of 500–600 mg/kg (Warner and Mounts 1990) whereas concentration of α-tocopherol in olive oil is in range of 100 mg/kg-200 mg/kg (Gliszczyńska-Świgło et al. 2007) Edible vegetable oils are mixtures of saponifiable triacylglycerols (95–98 %) and complex mixtures of non saponifiable minor compounds (2–5 %) such as tocopherols, phytosterols, sterol ester and hydrocarbons. Vegetable oil in acidic/alkali media are hydrolysed and give fatty acid and glycerol. Several methods are reported in literature for determination of tocopherol in vegetable oil using reversed phase high pressure liquid chromatography (Dionisi et al. 1995; Nielsen and Hansen 2008; Warner and Mounts 1990). However these methods involve saponification, extraction, concentration and drying steps. Tocopherols are sensitive to light and are degraded during saponification, extraction concentration and drying steps resulting in quantification errors as reported in literature. Normal phase high pressure liquid chromatography coupled with fluorescence detector has also been used for determination of tocopherols and tocotrienols in cereals (Panfili et al. 2003).
Numbers of methods have been described for determination of tocopherols and tocotrienols using normal phase and reversed phase high-performance liquid chromatography (HPLC) (Abidi 2000; Ruperez et al. 2001) Normal phase high pressure liquid chromatography resolves four tocopherols and four tocotrienols. Reversed phase high pressure liquid chromatography does not resolve β and γ tocopherols and tocotrienols (Gimeno et al. 2000).
In present paper we aimed to design quick, simple which avoid saponification and precise quantitative method for detection of sunflower oil adulterant in olive oil using reversed phase high pressure liquid chromatography with fluorescence detector. Admixtures of olive oil and sunflower oil are prepared (95:5,90:10, 85:15 and 80;20) and α-tocopherol concentration is selected as discriminating parameter for detecting sunflower oil adulterant in olive oil.
Material and method
The studies are performed by purchasing vegetable oil from fortune Company Ltd. Three bottles of olive and sunflower oil are analysed. α-tocopherol (96 %) is purchased from sigma aldrich. HPLC grade methanol, acetonitrile and isopropanol (Merck) are used. Ultra pure water of 18 mega ohm resistivity is used for experimental study.
Equipment
Hitachi model (Organiser) high performance liquid chromatography coupled with fluorescence detector model (L-2485) is used. The detector is set at excitation wavelength of 290 nm and emission wavelength of 330 nm.
Chromatographic condition
The mobile phase consist of methanol (50 %) and acetonitrile (50 %) at a flow rate of 1 ml/min. The quantitative estimation of α-tocopherol is performed on reversed phase C18 column (250 mm × 4.6 mm i.d., particle size 5 μ) The temperature of column oven is set at 40 °C. The detector is set at excitation wavelength of 290 nm and emission wavelength of 330 nm.
Sample preparation
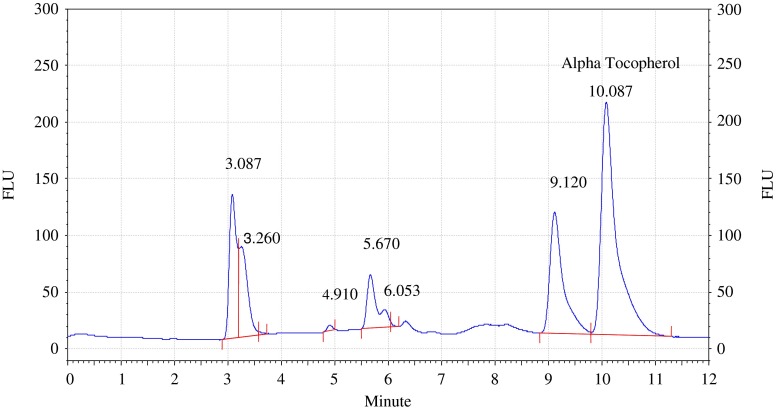
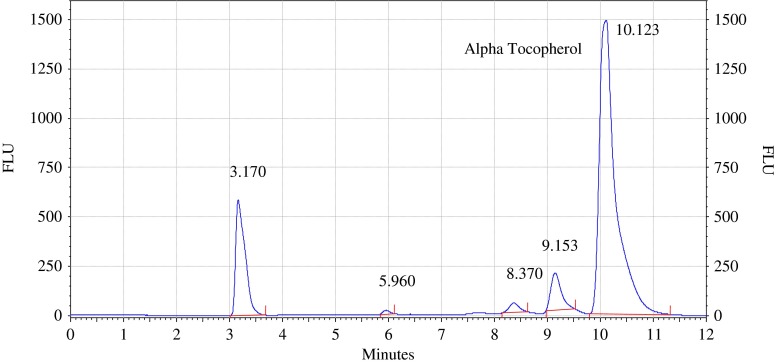
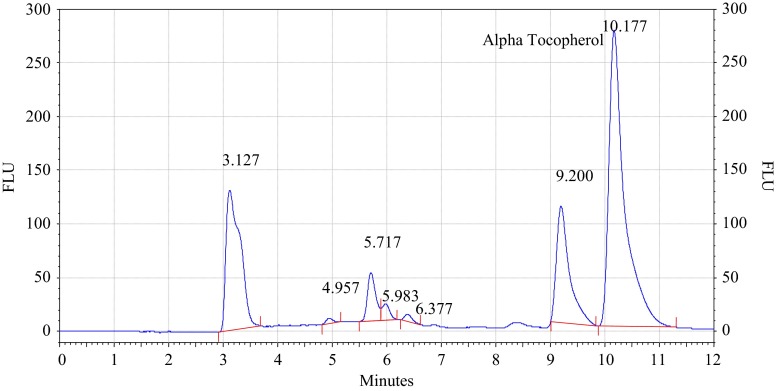
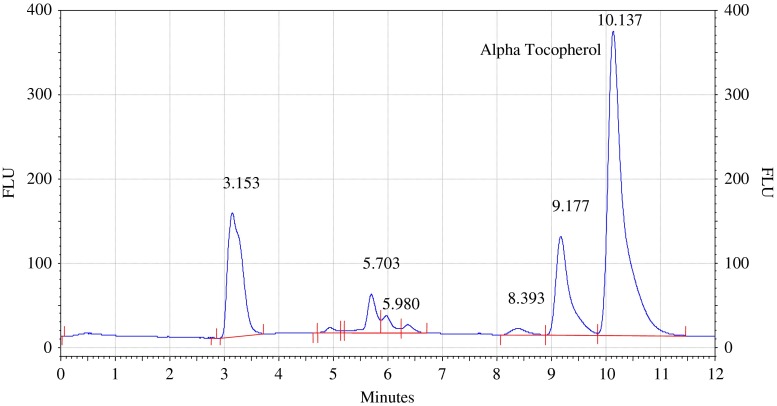
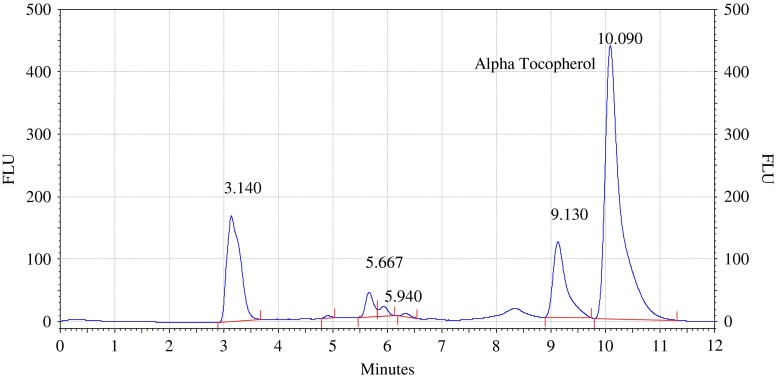
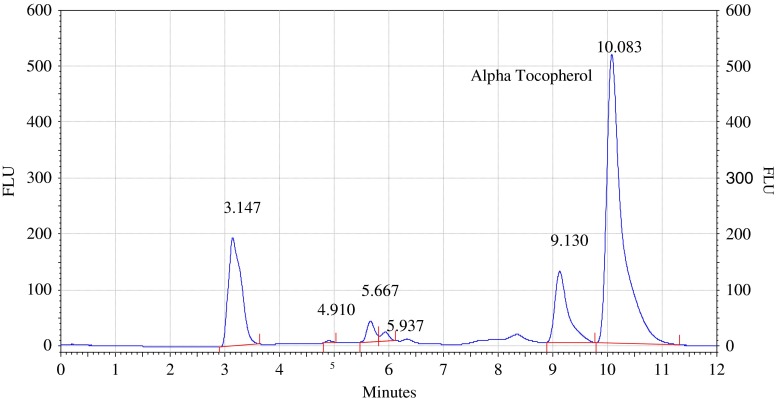
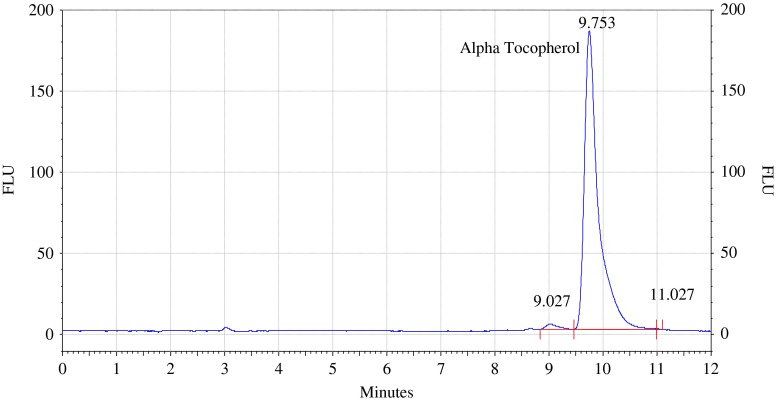
The oil samples (olive oil and sunflower oil) are diluted in isopropanol (1:10) and are filtered through 0.45 μ pore size filter paper and are stored in amber colored vials. Aliquot of this solution (5 μl) are directly injected on to the C18 column (Each sample is injected five times). The chromatogram of olive oil and sunflower oil are shown in Figs. 1 and 2. Admixtures of olive oil and sunflower oil are diluted in isopropanol (1:10) and are made in ratio of (95:5, 90:10, 85:15and 80:20). Solutions are filtered through 0.45 μ pore size filter paper and are stored in amber colored vials. Aliquot of this solution (5 μl) directly injected on to the C18 column (Each sample is injected five times). The chromatogram of olive oil and sunflower oil admixtures are shown in Figs. 3, 4, 5, and 6. The chromatogram of standard α-tocopherol (5 ppm) is shown in Fig. 7.
Fig. 1.
Analysis of olive oil by HPLC with fluorescence detector. Procedure for the HPLC detail operating chromatographic condition are described in Section “Chromatographic condition”
Fig. 2.
Analysis of sunflower oil by HPLC with fluorescence detector. Procedure for the HPLC detail operating chromatographic condition are described in Section “Chromatographic condition”
Fig. 3.
Analysis of olive and sunflower oil in ratio of (9.5:0.5) by HPLC with fluorescence detector. Procedure for the HPLC detail operating chromatographic condition are described in Section “Chromatographic condition”
Fig. 4.
Analysis of olive and sunflower oil in ratio of (9:1) by HPLC with fluorescence detector. Procedure for the HPLC detail operating chromatographic condition are described in Section “Chromatographic condition”
Fig. 5.
Analysis of olive and sunflower oil in ratio of (8.5:1.5) by HPLC with fluorescence detector. Procedure for the HPLC detail operating chromatographic condition are described in Section “Chromatographic condition”
Fig. 6.
Analysis of olive and sunflower oil in ratio of (8.:2) by HPLC with fluorescence detector. Procedure for the HPLC detail operating chromatographic condition are described in Section “Chromatographic condition”
Fig. 7.
Analysis of α tocopherol standard 5 ppm by HPLC with fluorescence detector. Procedure for the HPLC detail operating chromatographic condition are described in Section “Chromatographic condition”
Standard solution
The standard stock solution of α-tocopherol (100 mg/l) is prepared in ethanol and is stored in dark bottles at 3 °C. The concentration of the standard solutions (10 mg/l, 20 mg/l and 50 mg/l) are confirmed spectrophotometrically by measuring absorbance in ethanol at 292 nm. The concentration is estimated using known extinction coefficients in ethanol (Podda et al. 1996).
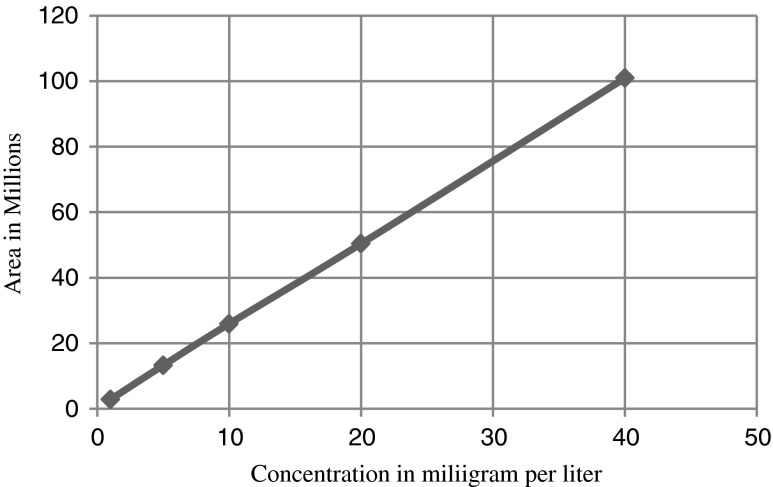
The standard solution of α-tocopherol 1 mg/l, 5 mg//l, 10 mg//l, 20 mg//l and 40 mg//l are prepared in isopropanol and 5μlof these solution are injected on C18 column. Details of chromatographic operating conditions are described as in 2.3 Calibration graph of peak area versus concentration of α-tocopherol in mg/l is shown in Fig. 8. The Relative standard deviation percent is about 2.6 %.The determination coefficients (R2) of analytical curves is near 0.99. The detection limit is about 0.2 mg/l and quantification limit is about 0.5 mg/l for α-tocopherol.
Fig. 8.
Calibration graph of standard α tocopherol
Quantification of α-tocopherol in oil samples
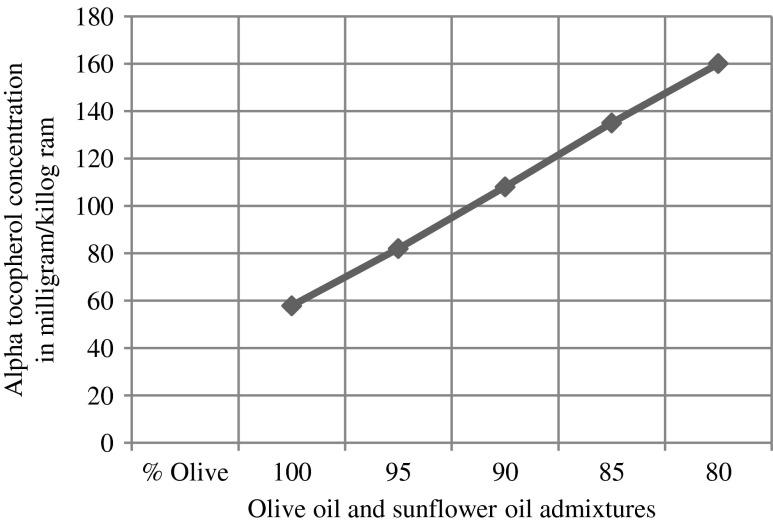
The α-tocopherol in olive oil, sunflower oil and there admixtures are identified using retention time parameter. The α-tocopherol concentration in these samples (each sample injected in five times injection volume 5 μl) are estimated by measuring average peak area and are quantified by use of linear regression from calibration graph (Fig. 8). α tocopherol concentration estimated as mg/kg is plotted versus olive oil and sunflower oil admixtures (95:5, 90:10, 85:15and 80:20) as shown in (Fig. 9). The α-tocopherol concentration in olive oil, sunflower oil and in the admixtures of olive and sunflower oil is also shown in Table 1.
Fig. 9.
Alpha tocopherol concentration in milligram/killogram in adulterated olive oil v/s olive oil and sunflower oil admixtures
Table 1.
α-tocopherol concentration in olive oil, sunflower oil and admixtures of olive and sunflower oil
| Edible oil | α-tocopherol concentration (mg/kg) | Coefficient of variation (n = 5)% |
|---|---|---|
| Olive oil | 58 | 4.2 |
| 95 % olive + 5 % sunflower oil | 82 | 3.7 |
| 90 % olive + 10 % sunflower oil | 108 | 4.6 |
| 85 % olive + 15 % sunflower oil | 135 | 3.4 |
| 80 % olive + 20 % sunflower oil | 160 | 4.7 |
| Sunflower oil | 590 | 3.2 |
Method validation
Standard addition method is used for testing accuracy of the method. Known concentration of α tocopherol (10 mg/l and 20 mg/l) are added separately to olive oil. Olive oil is diluted in isopropanol (1:10) filtered through 0.45 μ filter paper. The sample is injected five times on C18 column (Injection volume 5 μl). The chromatographic operating conditions are as described in 2.3 The α-tocopherol concentration in olive oil is estimated by measuring average peak area and are quantified by use of linear regression from calibration graph (Fig. 8). Recovery of externally added α-tocopherol is about 98 % and the precision of the method is found to be with relative standard deviation around 2.6 %.
Results and discussion
The chromatogram of olive oil in Fig. 1 reveals that on C18 column α-tocopherol is well resolved, and identified by comparing the retention time of α-tocopherol with that of olive oil. The concentration of α-tocopherol estimated by measuring peak area found to be (57 mg/kg).
The chromatogram of sunflower oil in Fig. 2 reveals that on C18 column α-tocopherol is well resolved and identified by comparing the retention time of α-tocopherol with that of sunflower oil. The concentration of α-tocopherol estimated by measuring peak area (590 mg/kg) matches with that of literature value.
The chromatograms of admixtures of olive and sunflower oil (95:5.90:10, 85:15 and 80:20) reveals that α-tocopherol concentration increases in the admixtures. The α-tocopherol concentration in olive oil is in range of 100–200 mg/kg, whereas sunflower oil contains about 500–600 mg/kg of α-tocopherol. Hence α-tocopherol concentration is used as discriminating parameter for detecting adulteration of olive oil with sunflower oil. Table 1 indicate that α-tocopherol concentration increases in adulterated olive oil. It is quiet relevant that β and γ tocopherols are not resolved in present study. However since α-tocopherol is well resolved, C18 column is used for experimental study.
Conclusion
The physical properties viz density, refractive index, saponification value, iodine value are characteristic for vegetable oil. However, these values are having very limited significance from adulteration point of view as adulteration above 20%w/w can be detected by measuring physical properties. Literature survey reveals that olive oil contains palmitic acid (7.5–20 %), oleic acid (50–80 %) and linoleic acid (4–21 %) concentration and sunflower oil contains palmitic acid (4–9 %), oleic acid (14–40 %) and linoleic acid (48–74 %) concentration as reported in literature. Hence it is quiet expected that there will be decrease in concentration of olive and increase in concentration of linoleic acid in the admixtures of olive and sunflower oil. Hence fatty acid methyl ester of linoleic acid and olive oil can be used as discriminating parameter for detection of sunflower oil in olive oil using gas chromatography. Fatty acid profile of olive oil and sunflower oil by gas chromatography should be used for qualitative identification of sunflower oil in olive oil. However gas chromatography has certain limitation with respect to sample preparation which involves steps such as methyl ester formation of fatty acid, extraction, concentration steps and use of nonspecific flame ionization detector.
However in present method fluorescence detector is selective and sensitive for tocopherol and tocotrienol. Hence high pressure liquid chromatography coupled with fluorescence detector can detect precisely 5 % of sunflower oil in olive oil. The present method is simple, selective, sensitive, fast and does not require any saponification or extraction step, nor any addition of any antioxidant. The sample preparation is simple and require only dilution with isopropanol and analysis time is about 15 min. Hence present method may be routinely used for detection of sunflower oil adulterant in olive oil.
Acknowledgments
Authors thanks to UGC, New Delhi, BCUD, University of Pune for financial support and KTHM College Nashik, Dr. M. K. Malve, Director Forensic laboratory, Govt. of Maharashtra for the facilities and support during the work.
References
- Abidi SL. Chromatographic analysis of tocol-derived lipid antioxidants. J Chromatogr A. 2000;881:197–216. doi: 10.1016/S0021-9673(00)00131-X. [DOI] [PubMed] [Google Scholar]
- Brigelius-Flohé R. Bioactivity of vitamin E. Nutr Res Rev. 2006;19:174–186. doi: 10.1017/S0954422407202938. [DOI] [PubMed] [Google Scholar]
- Dionisi F, Prodolliet J, Tagliaferri E. Assessment of olive oil adulteration by reversed-phase high-performance liquid chromatography/amperometric detection of tocopherols and tocotrienols. J AOAC. 1995;72:1505–1511. [Google Scholar]
- Gimeno E, Castellote AI, Lamuela-Ravento’s RM, de la Torre MC, Lo’pez-Sabater MC. J Chromatogr A. 2000;881:251–254. doi: 10.1016/S0021-9673(00)00219-3. [DOI] [PubMed] [Google Scholar]
- Gliszczyńska-Świgło A, Sikorska E, Khmelinskii I, Sikorski M. Tocopherol content in edible plant oils. Pol J Food Nutr Sci. 2007;57(No. 4(A)):157–161. [Google Scholar]
- Nesaretnem K, Guthrie N, Chambers AF, Carroll KK. Effect of tocotrienols on the growth of a human breast cancer cell line in culture. Lipids. 1995;30:1139–1143. doi: 10.1007/BF02536615. [DOI] [PubMed] [Google Scholar]
- Nesaretnem K, Yew WW, Wahid MB. Tocotrienols and cancer: beyond antioxidant activity. Eur J Lipid Sci Technol. 2007;109:445–452. doi: 10.1002/ejlt.200600212. [DOI] [Google Scholar]
- Nielsen MM, Hansen Å. Rapid high-performance liquid chromatography determination of tocopherols and tocotrienols in cereals. Cereal Chem. 2008;85(2):248–251. doi: 10.1094/CCHEM-85-2-0248. [DOI] [Google Scholar]
- Panfili G, Fratianni A, Irano M. Normal phase high-performance liquid chromatography method for the determination of tocopherols and tocotrienols in cereals. J Agric Food Chem. 2003;51:3940–3944. doi: 10.1021/jf030009v. [DOI] [PubMed] [Google Scholar]
- Podda M, Weber C, Traber MG, Packer L. Simultaneous determination of tissue tocopherols, tocotrienols, ubiquinols, and ubiquinones. J Lipid Res. 1996;37:893–901. [PubMed] [Google Scholar]
- Qureshi AA, Peterson DM, Hasler-Rapacz JO, Rapacz J. Novel tocotrienols of rice bran suppress cholesterogenesis in hereditary hypercholesterolemic swine. J Nutr. 2001;131:223–230. doi: 10.1093/jn/131.2.223. [DOI] [PubMed] [Google Scholar]
- Ruperez FJ, Martin D, Herrera E, Barbas C. Chromatographic analysis of alpha-tocopherol and related compounds in various matrices. J Chromatogr A. 2001;935:45–69. doi: 10.1016/S0021-9673(01)01101-3. [DOI] [PubMed] [Google Scholar]
- Saldeen K, Saldeen T. Importance of tocopherols beyond α-tocopherol: evidence from animal and human studies. Nutr Res. 2005;25:877–889. doi: 10.1016/j.nutres.2005.09.019. [DOI] [Google Scholar]
- Traber MG. Does vitamin E decrease heart attack risk? Summary and implications with respect to dietary recommendations. J Nutr. 2001;131:395S–397S. doi: 10.1093/jn/131.2.395S. [DOI] [PubMed] [Google Scholar]
- Warner K, Mounts TL. Analysis of tocopherols and phytosterols in vegetable oils by HPLC with evaporative light-scattering detection. JAOCS. 1990;67(11):827–831. [Google Scholar]


