Abstract
The objective of this study is to analyze the chemical composition and volatiles present in two medicinal rice varieties of “karungkuravai” and “mappilai samba” and to investigate their total phenolic content and bio activity. Chemical composition of the rice varieties was analyzed using gas chromatography/mass spectroscopy (GC-MS), the volatile compounds are identified using static head space analysis (SHS) followed by GC-MS. Total phenolic content (TPC) is estimated using Folin Ciocalteu colorimetric method, antioxidant assay is done using 1, 1-diphenyl-2-picrylhydrazyl (DPPH) assay and ferric reducing antioxidant power (FRAP) assay. GC-MS and SHS analysis identified pharmaceutically important phytochemicals present in the rice variety. The compounds like “curlone” and “7-chloro-1,3-dihydro-5-phenyl-1-(trimethylsilyl)- 2H-1-4-benzodiazapene-2-one” are identified for the first time in any rice variety. Phenols are found to be present in both rice varieties. Both rice varieties also showed antioxidant activity in both DPPH and FRAP assays and the IC50 values were 91.08 μg/ml and 359.93 μg/ml for “karungkuravai” and “mappilai samba”, respectively. . The correlation coefficient and regression analysis of total phenolic content with DPPH assay and FRAP assay show significant positive correlation coefficient values and coefficient of regression values.
Keywords: Medicinal rice, GC-MS, Static head space, Total phenolic content, Antioxidant assay
Introduction
Rice is the seed of the genus Oryza a monocotyledon plant belonging to the grass family Poaceae. Rice is a staple crop for more than two-thirds of the world population. Over 2 billion people in Asia derive their 80 % of energy needs from rice, which contains 80 % carbohydrates, 7–8 % protein, 3 % fat and 3 % fiber (Juliano 1985). India is the largest rice growing country accounting for about 2/3rd of world acreage under rice crop. Apart from being a major energy source to over 2 billion people in the world rice is also a medicine (Ahuja et al. 2008; Rahman et al. 2006; Nene 2005). Medicinal value of rice was identified by its early cultivators. In China rice has been used for its healing properties from around 2800 BC, other rice growing areas of the world like Thailand, Myanmar, Malaysia, Indonesia, and India have attributed medicinal properties to rice, and the same have been well documented in their early texts (Ahuja et al. 2008). Indigenous rice varieties are still used in Indian states of Karnataka, Madhya Pradesh, Kerala, Tamil Nadu, Uttar Pradesh, the Western Ghats, and Himachal Pradesh to treat various ailments like skin diseases, blood pressure, fever, paralysis, rheumatism, leucorrhea, as well as used as a health tonic and for increasing lactation (Ahuja et al. 2008). In recent times, unpolished rice has been studied as a rich source of important bioactive compounds and neutraceuticals with numerous potential health functions (Kiing et al. 2009). The major bioactive molecules reported in the rice grain include the phenolic acids, polyphenols, oryzanol, tocopherols, tocotrienols and sterols (Zubair et al. 2012).
Over the past few years, there has been an increasing interest in the study of the antioxidant compounds in grains in relation to health benefit because of their antioxidant activity (Butsat et al. 2009; Lai et al. 2009; Shen et al. 2009; Tananuwong and Tewaruth 2010; Zhang et al. 2010). The rice is a rich source of natural antioxidants (Kong and Lee 2010; Xu et al. 2001; Muntana and Prasong 2010; Jang and Xu 2009). Antioxidant activity of pigmented rice and rice bran has been earlier reported (Zhang et al. 2006; Nam et al. 2006; Chung and Shin 2007). There are many indigenous rice varieties that are used for treatment of different ailments. It has been established through studies that many rice varieties have differences in their physiochemical composition (Storck et al. 2005). Limited works have been done on measuring the bioactivity of some of the medicinal rice varieties used in the Indian system of medicine (Rao et al. 2010; Deepa et al. 2008).
The present study was aimed to analyse the phytochemicals and volatiles present in the medicinal rice varieties of “Karungkuravai” and “Mappillai samba” and to further assess their potential bioactivity by estimating total phenolic content and in-vitro antioxidant assays, respectively.
Materials and methods
Rice samples
Paddy samples of “karungkuravai” and “mappilai samba” was procured from organic rice farmers from the district of Tanjavur and Tiruvarur in Tamil Nadu State, India.
GC-MS analysis
Preparation of the extract
Fifty grams of the medicinal rice variety was cleaned and pulverized using pestle and mortar, 2 g of the homogenized powdered rice sample was taken in a centrifuge tube and 20 ml of ethanol (chromatography grade) was added in the tube and mixed for 10 min using cylcomixer. The mixture was then centrifuged at 10,000 rpm for 10 min. The resultant supernatant was filtered using 0.2 micron filter. The filtered supernatant was stored in a glass vial. 1 ml of the filtered supernatant was used for GC-MS analysis. 1 μl of sample was injected in to the GC column using syringe in split mode.
Instruments and conditions
GC-MS analysis was carried out on Thermo fisher GC-MS/MS Quantum TSQ XLS using DB-5MS (30 m × 0.25 mm × 0.25 μm) column with helium as carrier gas. Carrier gas helium was used at a flow rate of 1.0 ml/min. The initial column temperature was maintained at 80 °C, keeping 2 min and then heated to 150 °C with 40 °C/ min, and then to 240 °C with 4 °C/min, and then to 255 °C with 2 °C/min, and then 285 °C with 4 °C/min keeping for 3 min; samples were injected in split injection mode with split ratio of 10. The total run time was 30 min. Mass spectra were taken at 70 ev and was operated in scan mode from m/z 50–650.
GC-MS analysis
One milliliter of sample in the sample vial was kept in the auto-injector and 1 μl of sample was injected in to the GC column using syringe in split mode. The injection temperature was kept at 290 °C. The sample was injected with split mode using split ratio of 10. Initial column temperature was kept at 80 °C for 2 min, and heated to 150 °C with 40 °C/ min then to 240 °C with 4 °C/min, then to 255 °C with 2 °C/min and then to 285 °C with 4 °C/min keeping for 3 min. A 30 m × 0.25 mm × 0.25 μm thickness of DB5-MS capillary column 5 % phenyl—95 % dimethyl polysiloxane cross bonded liquid phase capillary column was used with 99.9995 % helium as carrier gas with a flow rate of 1.0 ml/min in a split mode. The total GC cycle run time consisted of 30 min. The MS was operated in the scan mode from m/z 50 to 650. Each compound was identified by the presence of selected ions and their ratio, and by comparing the retention index and similarity index in mass spectra of the samples to the reference in the national institute of standards and technology (NIST, ver. 2.0, 2008) mass spectral database.
Static head space analysis
Sample preparation
The rice sample was cleaned and pulverized using pestle and mortar. 1 g of the pulverized rice sample was taken in head space vial and kept in the incubator for equilibration for 30 min at 105 °C. After the extraction period was complete 1 ml of vapour sample was auto injected in to the GC inlet using airtight syringe in split mode.
Instruments and conditions
GC-MS analysis was carried out on Shimadzu QP 2010/MS Quantum TSQ XLS using VF-5MS (30 m × 0.25 mm × 0.25 μm) column, AOC 5000 (make-combipal) with auto injection head space analyser and helium as carrier gas. Carrier gas was used at a flow rate of 1.0 ml/min. Head space incubation temperature was at 105 °C, incubation time was for 20 min, syringe temperature at 110 °C, injection speed at 150 μl/sec, injection volume-1 ml vapour through air tight syringe and flush time was 10 s. The initial column temperature in GC-MS was kept at 50 °C, and heated to 165 °C with 10 °C/ min, keeping 5 min, and then to 250 °C with 15 °C/min, keeping 3 min; split injection mode with split ratio of 10 was used. The total run time was 23 min. Interface temperature is 280 °C; ion source at 200 °C; electron energy is 70 ev; mass scan range (m/z) is 35–350 amu.
SHS- GC- MS analysis
A sample of whole de-husked rice kernels (10 g) was placed in a pestle and mortar and ground to fine powder. One gram of homogenized fine powder was taken in 20 ml head space vial and the vial was sealed with a magnetic crimp cap. The samples were placed in an auto sampler tray, and were maintained at room temperature until analysed. The samples were heated at 105 °C for 20 min in incubator with agitation speed of 250 rpm. After equilibration the vapour sample of volatile compounds of rice was injected in to the gas chromatography column using airtight syringe injector and injection temperature was kept at 110 °C. The sample was injected with Split mode using split ratio of 10. The GC initial column temperature was held at 50 °C, then increased to 165 °C at 10 °C/ min, and held for a period of 5 min, then increased to 250 °C at 15 °C/min, and held for a period of 3 min; A 30 m × 0.25 mm × 0.25 μm thickness of VF5-MS 5 % phenyl—95 % di-methyl polysiloxane cross bonded liquid phase capillary column was used with helium (99.995 %) as the carrier gas under a flow rate of 1.0 ml/min in the split mode. The total GC cycle run time consisted of a 25.17 min. The MS was operated in the scan mode from m/z 35 to 350. Each compound was identified by the presence of selected ions and their ratio, and by comparing the retention index and similarity index in mass spectra of the samples to the reference in the national institute of standards and technology (NIST, ver. 2.0, 2008) mass spectral database.
Total phenolic content and antioxidant assay
Chemicals
1, 1-diphenyl-2-picrylhydrazyl (DPPH) was purchased from Sigma, USA. Folin-Ciocalteu reagent, 2,4,6-tri(2-pyridyl)-s-triazine (TPTZ), dilute hydrochloric acid, ferric chloride and standards like butylated hydroxyl toluene (BHT), gallic acid and ferrous sulpahte was purchased from Hi-Media, Mumbai. Solvents for extraction and others chemicals used were of analytical grade.
Preparation of sample extract
Rice samples were powdered and 50 g of the sample was added to 200 ml solvent (ethanol) in 1:4 ratio (sample: solvent) in a dry conical flask. The flask was then incubated for 48 h in a shaker. After incubation, the extract was collected using Whatman No. 1 filter paper and evaporated below 40 °C. To the residual mixture, solvent was added again and incubated in shaker for 24 h. The extract was collected again using Whatman no. 1 filter paper and evaporated below 40 °C, which was then used for further phytochemical analysis.
Determination of total phenolic content
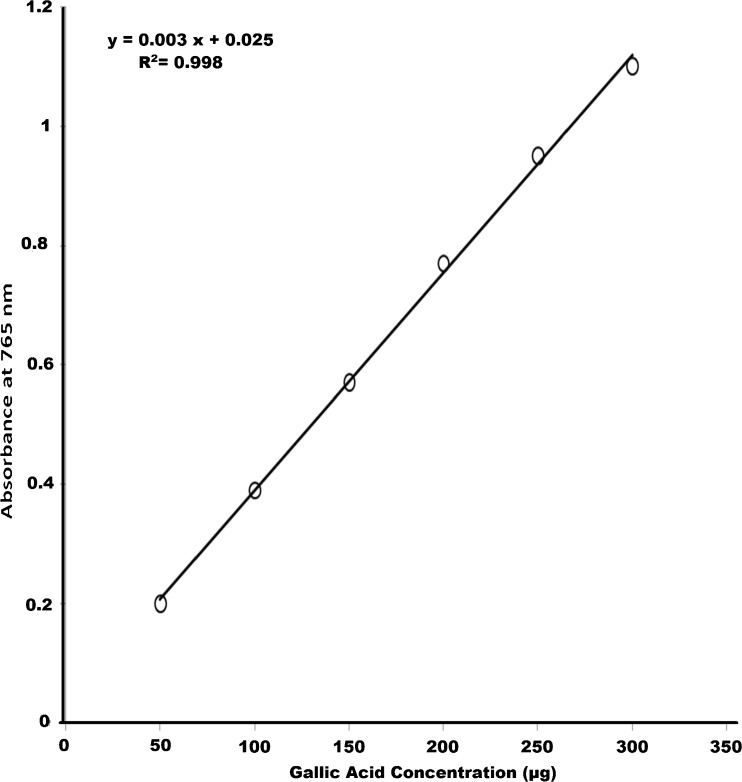
The amount of phenolic compounds in the extracts was determined by the Folin Ciocalteu colorimetric method (McDonald et al. 2001). Calibration curve was prepared using Gallic acid as standard (10 mg/10 ml). From the standard solution 0.05 to 0.2 ml was taken and added to different test tubes. Sample extracts at different concentrations (25, 50, 100, 150 μg) were aliquoted in separate test tubes from the stock solution (1 mg/ml). The volume of the standard and the extract was made up to 1 ml in all the test tubes with distilled water and 5 ml of Folin Ciocalteu (1:10 dilution) reagent was added and the contents were mixed thoroughly. 4 ml of 0.7 M sodium carbonate was added to the mixture after 2 min and was incubated for 30 min. The absorbance was measured at 765 nm in a UV-visible spectrophotometer. The amount of phenolic compounds in the extracts was determined by extrapolating the absorbance of the sample extract on the calibration curve (Fig. 1) obtained with Gallic acid as standard.
Fig. 1.
Gallic acid equivalents in total phenol assay
Antioxidant assay
FRAP assay
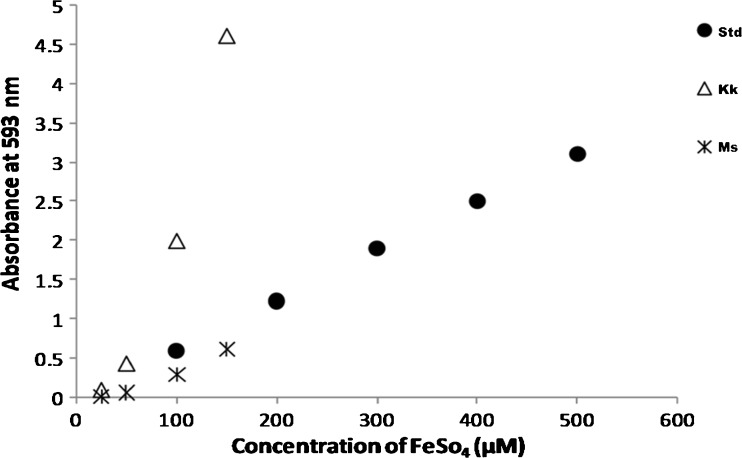
Antioxidant activity was measured by ferric reducing antioxidant power (FRAP) assay of Benzie and Strain (1996). FRAP assays uses antioxidants as reductant in a redox-linked colorimetric method, employing an easily reduced oxidant system present in stoichiometric excess. At low pH, reduction of ferric tripyridyl triazine (Fe III TPTZ) complex to ferrous form (which has intense blue color) can be monitored by measuring the change in absorption at 593 nm. The change in absorbance was directly linked to the combined or total reducing power of the electron donating antioxidants present in the reaction mixture. The FRAP reagent was prepared by mixing acetate buffer (300 mM, pH 3.6) with TPTZ (2, 4, 6-tri (2-pyridyl)-s-triazine) (10 mM in 40 mM dilute HCl) and ferric chloride (20 mM) in the ratio of 10:1:1. Ferrous sulphate (1 mM) was used as standard. Various concentrations (25, 50, 100, 150 μg) of the sample was aliquoted from the sample extract stock (1 mg/ml) and made up to 1 ml with distilled water and was mixed with 1.5 ml of working FRAP reagent and incubated at 37 °C for 4 min. After incubation the absorbance was measured at 593 nm. Ferrous sulphate standard was processed in the same way and calibration curve (Fig. 2) was generated using various concentrations of ferrous sulphate (100–500 μg). The FRAP value of the extract was calculated from the standard graph.
Fig. 2.
FRAP assay for rice varieties (Std standard; Kk Karungkuravai; Ms Mappilai samba)
DPPH assay
The antioxidant activity of the plant extracts and the standard was assessed on the basis of the radical scavenging effect of the Stable 1, 1-diphenyl-2-picrylhydrazyl (DPPH)-free radical according to Clemente and Desai (2012). DPPH is a stable free radical with purple color (absorbed at 517 nm). If free radicals have been scavenged, DPPH will degenerate to yellow color. This assay uses this character to show the free radical scavenging activity. The sample and standard (BHT 0.16 %) were dissolved in methanol (1 mg/ml). From this stock solution various concentrations (25, 50, 100, 150, 200 & 250 μg) was aliquoted which was then used to determine the antioxidant potential. 0.1 % of DPPH was prepared in methanol and 100 μl of this solution was mixed with 2.9 ml of sample solution and standard solution at different concentrations separately. These solution mixtures were kept in dark for 30 min and optical density was measured at 517 nm. Methanol with DPPH solution (0.1 %) was used as control. The optical density was recorded and % inhibition was calculated using the formula given below:
IC50 values (concentration of extract required to scavenge 50 % of free radicals) were calculated by log probit analysis (Kumar and Gowda 2011).
Statistical analysis
All the tests were performed in triplicate (n = 3) and values were expressed as mean ± standard deviation. The data were statistically analysed using analysis of variance (ANOVA). The statistical differences between means were analyzed using ANOVA followed by Tukey’s least significant difference (LSD) test. The Pearson’s correlation analysis and regression analysis was done using StatPlus v2009. IC50 was calculated by log probit analysis using StatPlus v2009. P < 0.05 was considered statistically significant.
Results & discussion
The rice varieties of “karungkuravai” and “mappilai samba” are traditional rice varieties of Tamil Nadu in southern India. “Karungkuravai” has been traditionally used for curing filariasis and “mappilai samba” is used for imparting strength and for their neurological properties (Arumugasamy et al. 2001, 2002).
Gas chromatography
A total of nine compounds were identified in both rice varieties using GC-MS.
Karungkuravai
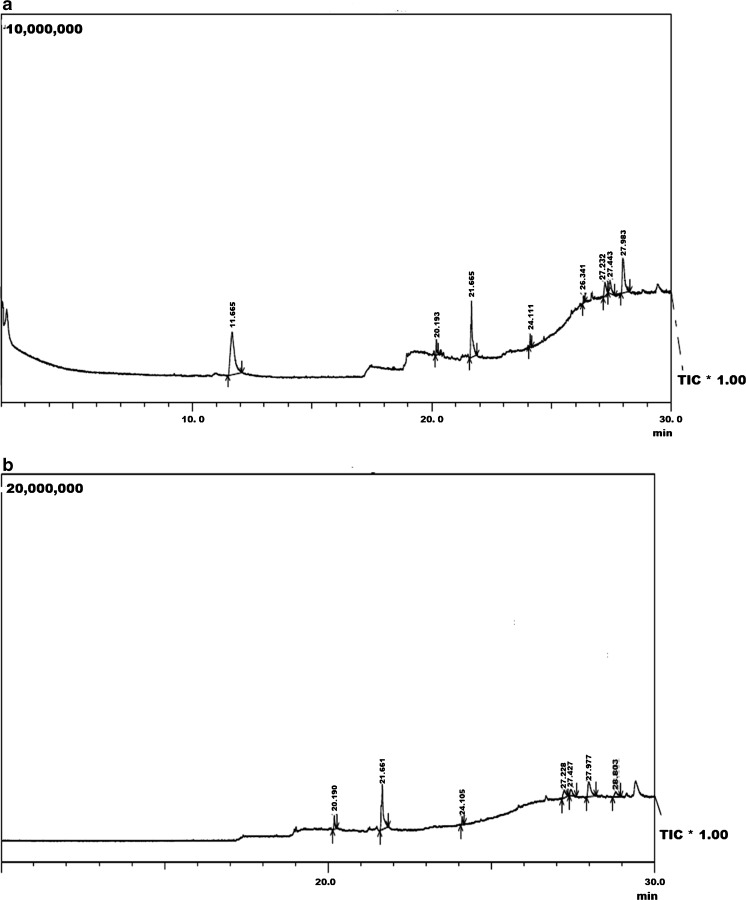
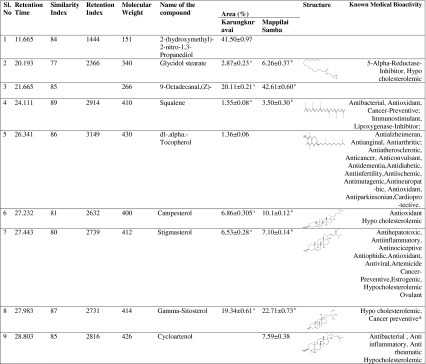
The GC-MS chromatogram of “karungkuravai” rice variety showed the presence of eight phytochemicals that are identified using NIST library. Each peak as shown in the chromatogram identifies a compound present in the rice variety. Table 1 lists the phytochemicals identified in rice variety and the biomedical activity associated with them. Chromatogram of this rice variety is shown in Fig. 3a. The phytochemical profile indicates the presence of medicinal activity in the rice variety.
Table 1.
Phytochemicals identified in ethanolic extract of medicinal rice “Karungkuravai” and “Mappilai Samba” and their known medical bioactivity
Data is mean ± standard deviation; Common volatiles were statistically analysed using ANOVA and Tukey’s test. Means in the same rows with different superscripts are significantly different, (p < 0.05). ANOVA- Analysis of variance
Fig. 3.
GC-MS analaysis of a Karungkuravai and b Mappilai samba rice varieties
Mappilai Samba
The chromatogram of “Mappilai Samba” rice variety showed the presence of seven phytochemicals these phytochemical compounds were identified using NIST library. Table 1 lists the phytochemicals identified in rice variety and the biomedical activity associated with them. Chromatogram of this rice variety is shown in Fig. 3b. The phytochemical compounds identified signify the medicinal activity of this rice variety.
Out of the phytochemicals identified in the rice varieties the majority belong to the class of chemicals called phytosterols (plants sterols). Out of the phytosterols identified Sitosterol, Stigmasterol and Campesterol are present in both rice varieties. The peak area percentage of Sitosterol is seen to be high in both the rice varieties. Cycloartenol was seen to be present in “Mappilai Samba” and not in “Karungkuravai” rice. Among different plant sterols, sitosterol has been most intensively investigated and has been shown to exhibit anti-inflammatory; antineoplastic, antipyretic, and immunomodulating activities (Careri et al. 2006). Also, sitosterol, campesterol and stigmasterol exert antioxidant effects (Cherif 2012). Squalene, an isoprenoid compound structurally similar to beta-carotene, is an intermediate metabolite in the synthesis of cholesterol. It has been primarily sourced from shark liver oils. Due to concerns for protection of marine life forms, there has been growing interest in extraction of squalene from plant sources. Squalene appears to function in the skin as a quencher of singlet oxygen, protecting human skin surface from lipid peroxidation due to exposure to UV and other sources of ionizing radiation (Kohno et al. 1995). Among the other phytochemicals noted in rice, the ester of steraic acid is present in the rice variety of “mappilai samba” than in “karungkuravai”. Tocopherol was noted to be present only in “karungkuravai” and not in “mappilai samba”.
Static head space analysis
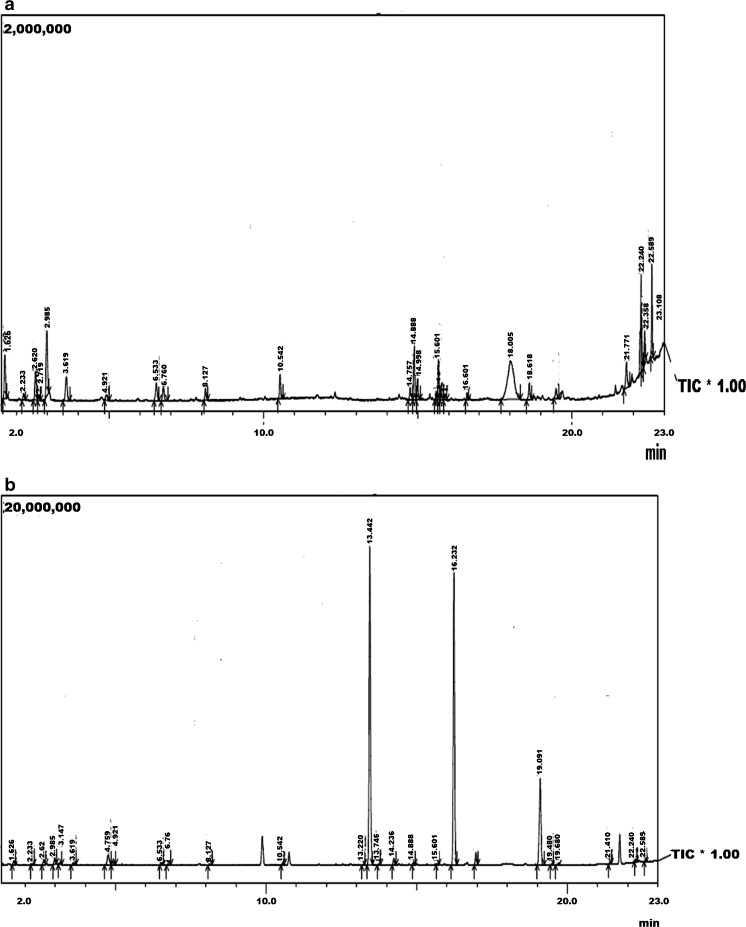
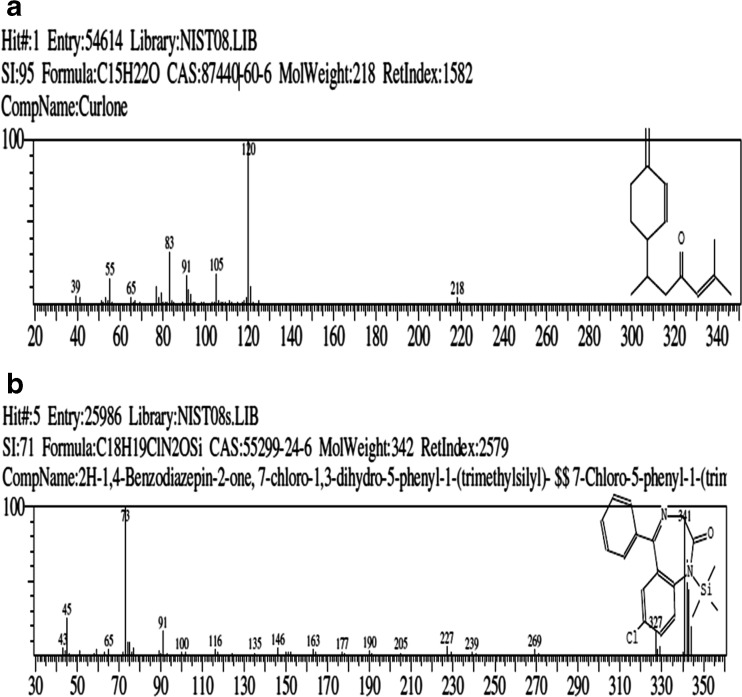
Volatile profile of both rice varieties were identified using the head space analysis. Table 2 lists the volatile compounds identified. A total of 36 volatile compounds were identified in both rice varieties. Total ion chromatogram of SHS GC of both rice varieties is shown in Fig. 4. Twenty-four volatile compounds were identified in “karungkuravai” rice variety (Fig. 4a) and 25 volatile compounds were identified in “mappilai samba” rice variety (Fig. 4b). Compounds identified are mainly volatile flavours already reported to be present in rice (Duke 1992). In the “karungkuravai” rice variety a volatile compound curlone (21.88 %, mass spectra and structure shown in Fig. 5a) has been identified. Curlone is a sesquiterpene found as a major constituent in turmeric and essential oils of turmeric. The peak area percentage of curlone present in this rice variety is similar to the peak area percentage of curlone found in turmeric (Jayaprakasha et al. 2002; Singh et al. 2010). Curlone is known to exert bioactivity like antioxidant activity, antitumor activity etc. (Jayaprakasha et al. 2002; Kiso et al. 1983). This is the first time curlone is reported to be present in any rice variety. Volatile phytochemical 2H-1,4-Benzodiazepin-2-one, 7-chloro-1,3-dihydro-5-phenyl-1-(trimethylsilyl)- (13.40 %, mass spectra and structure shown in Fig. 5b) has been identified in the rice variety of “Mappilai samba”. This compound has been shown to be present in rice as a siloxane derivative contaminant when extracted using solid phase micro extraction (SPME) method (Bryant and McClung 2011), however in this case the extraction has been done using static head space method and not by using solid phase micro extraction fibers and therefore the compound cannot possibly be a contaminant from SPME fiber. The rice variety of “Mappilai Samba” is used by some naturotherapist for curing of diseases related to pathology of central nervous system. The presence of the core molecule 1, 4-benzodiazepine-2-one which is a known anxiolytic, anticonvulsant, sedative, hypnotic, and muscle relaxant (Imanzadeh et al. 2011; Drummer 2002) in this rice may be the reason for the neurological beneficial effect noted in this rice variety.
Table 2.
Comparative table of various volatile compounds identified using HS-GC-MS in Medicinal Rice “Karungkuravi” and “Mappilai Samba”
| Sl.No. | Retention time | Similarity index | Retention index | Name of the compound | Area (%) | |
|---|---|---|---|---|---|---|
| Karungkuravai | Mappilai Samba | |||||
| 1 | 1.222 | 93 | 1097 | l-alanine ethylamide | 1.54 ± 0.42 | – |
| 2 | 1.626 | 99 | 408 | Acetaldehyde | 5.37 ± 0.46a | 0.42 ± 0.04b |
| 3 | 2.233 | 99 | 463 | Ethanol | 0.82 ± 0.03a | 0.05 ± 0.01b |
| 4 | 2.62 | 98 | 455 | Acetone | 3.55 ± 0.31a | 0.46 ± 0.06b |
| 5 | 2.719 | 95 | 482 | 2-propanol | 0.61 ± 0.08 | |
| 6 | 2.985 | 99 | 465 | Cyanomethane | 8.37 ± 0.45a | 0.83 ± 0.16b |
| 7 | 3.619 | 96 | 543 | Isobutyraldehyde | 4.13 ± 0.70a | 0.28 ± 0.03b |
| 8 | 4.921 | 96 | 586 | Ethyl acetate | 0.95 ± 0.07a | 0.47 ± 0.11b |
| 9 | 6.533 | 97 | 643 | Beta-methyl butanal (Isovaleral) | 2.79 ± 0.37a | 0.18 ± 0.03b |
| 10 | 6.76 | 95 | 643 | Alpha-methyl butanal | 1.94 ± 0.05a | 0.13 ± 0.04b |
| 11 | 8.127 | 97 | 681 | 2-pentanol | 1.6 ± 0.23a | 0.07 ± 0.01b |
| 12 | 10.542 | 96 | 806 | Hexanal | 2.37 ± 0.37a | 0.15 ± 0.03b |
| 13 | 14.757 | 90 | 1018 | D-limonene | 1.85 ± 0.14 | – |
| 14 | 14.888 | 93 | 1086 | 3,7-dimethyl decane | 11.48 ± 0.61a | 0.14 ± 0.03b |
| 15 | 14.998 | 93 | 1185 | 3,7-dimethyl-undecane | 3.86 ± 0.46 | – |
| 16 | 15.601 | 90 | 958 | 2,3,6,7-tetramethyloctane | 1.60 ± 0.08a | 0.13 ± 0.04b |
| 17 | 16.601 | 91 | 1104 | Nonanal | 0.65 ± 0.08 | – |
| 18 | 18.005 | 95 | 1582 | Curlone | 21.88 ± 0.94 | – |
| 19 | 18.618 | 91 | 1285 | 4,6-dimethyldodecane | 2.61 ± 0.42 | – |
| 20 | 21.771 | 83 | 1494 | 4,11,11-trimethyl-8-methylene bicyclo(7.2.0) undec-4-ene | 3.88 ± 0.27 | – |
| 21 | 22.24 | 92 | 1454 | 5-(1,5-dimethyl-4-hexenyl)-2-methyl-[S-(R*,S*)]-1,3-cyclohexadiene | 6.93 ± 0.39a | 0.11 ± 0.05b |
| 22 | 22.358 | 87 | 1500 | 1-methyl-4-(5-methyl-1-methylene-4-hexenyl)-, (S)-cyclohexene | 2.34 ± 0.44 | – |
| 23 | 22.589 | 93 | 1446 | 3-(1,5-dimethyl-4-hexenyl)-6-methylene-[S-(R*,S*)]-cyclohexene | 6.26 ± 0.38 | – |
| 24 | 23.108 | 89 | 1564 | .+/−.-trans-nerolidol | 2.98 ± 0.12 | – |
| 25 | 3.147 | 97 | 511 | 2-methyl-2-propanol | – | 0.22 ± 0.02 |
| 26 | 4.759 | 98 | 369 | Trimethyl-silanol | – | 1.88 ± 0.23 |
| 27 | 13.22 | 89 | 2,2-dimethyl-3-methylene-(Delta 2-carene)- bicyclo[2.2.1]heptane | – | 0.03 ± 0.01 | |
| 28 | 13.442 | 98 | 827 | Octamethyl-cyclotetrasiloxane | – | 42.53 ± 1.05 |
| 29 | 13.746 | 95 | 1130 | 2,2-dimethyl-decane | – | 0.1 ± 0.04 |
| 30 | 14.236 | 85 | 620 | Hexamethyl cyclotrisiloxane | – | 0.65 ± 0.09 |
| 31 | 16.232 | 80 | 2274 | N-[(pentafluorophenyl)methylene]-.beta.,4-bis[(trimethylsilyl)oxy]-benzeneethanamine. | – | 37.3 ± 1.22 |
| 32 | 19.091 | 71 | 2579 | 7-chloro-1,3-dihydro-5-phenyl-1-(trimethylsilyl)-2H-1,4-benzodiazepin-2-one | – | 13.40 ± 0.44 |
| 33 | 19.48 | 89 | 732 | 3,3-dimethyl hexane | – | 0.02 ± 0.005 |
| 34 | 19.68 | 75 | 1230 | 4-(1-methylethyl)-benzaldehyde | – | 0.08 ± 0.02 |
| 35 | 21.41 | 94 | 1367 | 1,7,7-trimethylbicyclo[2.2.1]hept-2-yl ester, exo-2-propenoic acid | – | 0.28 ± 0.03 |
| 36 | 22.58 | 85 | 1398 | Cedrene | – | 0.15 ± 0.02 |
Data’s were statistically analysed using ANOVA and Tukey’s test. Means in the same columns with different superscripts are significantly different, (p < 0.05)
Fig. 4.
Static head space analysis of a Karungkuravai and b Mappilai samba rice varieties
Fig. 5.
Mass spectra analysis of a Karungkuravai and b Mappilai samba rice varieties
Total phenolic content and antioxidant assay
Bioactivity of the rice varieties were assessed by analysing for the presence of total phenolic content and antioxidant activity.
Total phenolic content (TPC)
The total phenolic content (TPC), for 100 μg of rice sample extract, expressed as Gallic acid equivalents are shown in Table 3. Several phenol compounds have already been identified in rice (Walter and Marchesan 2011). The rice variety of “Karungkuravai” exhibited a good quantity of phenolic content when compared to “Mappilai Samba”. For all the concentrations of sample extract, the total phenolic content of “karungkuravai” (80.25 ± 1.39 μg GAE/g) showed highest phenolic content, this rice variety also exhibited a high FRAP value when compared to other rice variety. Though the rice variety of “Mappilai samba” showed presence of phenolic content, it recorded the lowest FRAP value and a high IC50 value. In both the rice varieties increase in concentration also showed an increase in the phenolic content value.
Table 3.
Total phenolic content, FRAP value and IC50 of rice varieties
| Rice variety | TPC (μg GAE/g) | FRAP value (μM/mg) | IC 50* (μg/ml) |
|---|---|---|---|
| Karungkuravai | 80.25 ± 1.39c | 3181 ± 16.52c | 91.08 ± 0.82c |
| Mappilai Samba | 47.35 ± 1.78d | 483 ± 11.78d | 359.43 ± 24.16d |
Data’s are mean ± standard deviation (n = 3)
Data’s were statistically analysed using ANOVA and Tukey’s test. Means in the same columns with different superscripts are significantly different, (p < 0.05)
TPC total phenolic content, FRAP ferric reducing antioxidant power, IC 50 concentration of extract required to scavenge 50 % of free radicals
Antioxidant assay
FRAP assay
The ability of the rice extract to reduce the ferric ions was determined using FRAP assay. Figure 2 shows the optical density (O.D.) values of rice varieties. The “Karungkuravai” rice variety had higher OD value than that of the standard (FeSo4) at 100 μM concentration, while the O.D. value of “Mappilai samba” was lower than that of the standard at 100 μM concentration. FRAP value was noted to be high in the rice variety of “Karungkuravai” (3181 ± 16.52 μM/mg). FRAP value (at 100 μg of rice sample extract) of rice varieties are shown in Table 3.
DPPH assay
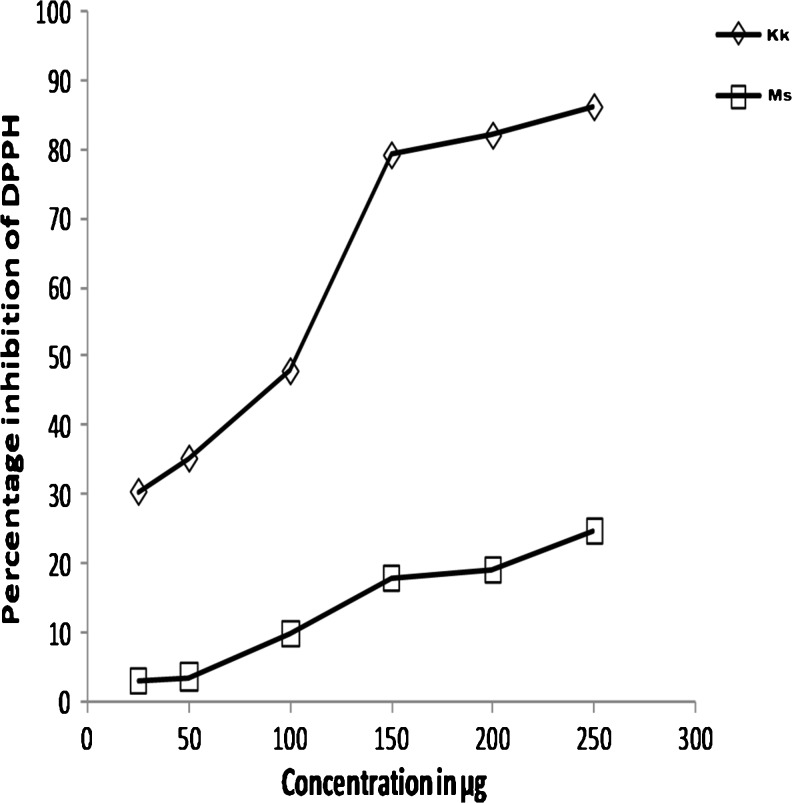
Free radical scavenging activities of the rice sample extracts were assessed by the DPPH assay. Figure 6 showing the standard graph plotting the various concentrations of rice extracts against the percentage inhibition, demonstrates a significant decrease in the concentration of DPPH radical due to scavenging ability of the rice extracts. This radical scavenging activity was seen to increase with concentrations in the rice extracts, suggesting that these extracts scavenged the radical in a dose dependent manner. The results demonstrate that the IC50 was low for the rice variety of “karungkuravai” (91.08 ± 0.82 μg/ml) and high for “mappilai samba” (359.43 ± 24.16 μg/ml) suggesting that the free radical scavenging capacity among the rice varieties is high in “karungkuravai”. IC50 of positive control BHT was 15.134 μg/ml. The IC50 value of rice varieties is shown in Table 3.
Fig. 6.
DPPH radical scavenging activity (%) of a Kk Karungkuravai; and b Ms Mappilai samba rice varieties
The estimation of antioxidant capacity is a stepping stone test for any plant extract for further determination of its pharmaceutical value. There is a number of methods currently in use for estimation of antioxidant activity in plants and no one method is considered a significant index to ascertain the antioxidant activity (Pavel et al. 2006). Both DPPH and FRAP assay which are most commonly used method to quantify antioxidant activity were used to determine the antioxidant potential of all four rice varieties (Ozgen et al. 2006). Both the rice varieties showed a free radical scavenging capability. The scavenging capacity of both rice varieties showed an increase with increase in their concentration thereby suggesting that the radical scavenging activity of the rice sample is dose dependant. The rice variety of “Karungkuravai” showed a higher DPPH inhibitory activity at lower concentrations when compared to other rice variety (Fig. 6). The ability of the rice extracts to reduce the ferric ions was determined using FRAP assay. This method is considered a sensitive method for estimation of antioxidant activity in biological fluids plant homogenates and pharmaceutical plant products (Vasco et al. 2008). Results of FRAP assay is also indicative that the reducing capacity of the rice extract increases with increase in concentration. FRAP value was seen to be high in the rice variety of “Karungkuravai” which also showed a high TPC value and a good DPPH scavenging capacity compared to “Mappilai Samba”. The results also indicated that increase in TPC values in each rice variety showed a corresponding increase in DPPH scavenging activity and FRAP value.
Correlation analysis
The correlations between total phenolic content and antioxidant assays (DPPH and FRAP) was computed. The correlation coefficients (R) and coefficient of regression (R2) were calculated for both rice varieties and are listed in Table 4. In general, the phenolic content had a strong positive correlation with both the antioxidant assay which is in accordance with previous studies (Yafang et al. 2011; Rattanachitthawat et al. 2010; Rao et al. 2010). In both rice varieties, the correlation coefficient and regression coefficient were seen to be higher between TPC and FRAP when compared to TPC and DPPH. The correlation and regression analysis showed that the TPC had a significant positive correlation with antioxidant activity of the rice suggesting that they may be responsible for the antioxidant activity seen in the rice varieties. Similar results were also seen in some earlier studies (Chi et al. 2007; Jin et al. 2009).
Table 4.
Correlation of total phenolic content with DPPH and FRAP
| Rice variety | TPC vs. DPPH scavenging | TPC vs. FRAP assay | |
|---|---|---|---|
| Karungkuravai | R R2 P |
0.933 0.872 0.02 |
0.959 0.920 0.04 |
| Mappilai Samba | R R2 P |
0.982 0.964 0.017 |
0.993 0.987 0.006 |
R Pearson correlation coefficient, R 2 regression coefficients, P probability values, TPC total phenolic content, FRAP ferric reducing antioxidant power, DPPH 1, 1-diphenyl-2-picrylhydrazyl
Conclusion
The GC MS analysis showed presence of phytosterols in high quantity in both rice varieties. Static head space analysis identified medically important molecules like curlone and 1-4-benzodiazepine-2-one present in the rice varieties, these photochemicals have been identified for the first time in any rice variety. Both rice varieties showed presence of phenols and antioxidant capacities. Phenolic content and antioxidant capacity are significantly correlated with each other. Results from the study identifies the medicinal rice variety of “karungkuravai” and “mappilai samba” as ideal candidates for further detailed research for isolation of pharmaceutically important chemicals, development of novel pharmaceutical products for alternate and safe treatment of various ailments and also in formulations of health/dietary supplements.
Acknowledgments
We would like to thank the management of VIT University for providing us the necessary facilities to carry out this research project. Dr. Anand Anbarasu gratefully acknowledges the Indian Council of Medical Research (ICMR), Government of India Agency for the research grant [IRIS ID: 2011–03260] to carry out this research.
Conflict of interest
The authors declare that there is no conflict of interest.
References
- Ahuja U, Ahuja SC, Thakrar R, Singh RK. Rice—a nutraceutical. Asian Agric Hist. 2008;12:93–108. [Google Scholar]
- Arumugasamy S, Jayashankar N, Subramaniyan K, Subashini S, Vijayalakshmi K. Indigenous rice varieties. Malaysia: PAN-AP; 2001. [Google Scholar]
- Arumugasamy S, Jayashankar N, Saraswathy H, Vijayalakshmi K. Indigenous rice varieties-2. Malaysia: PAN-AP; 2002. [Google Scholar]
- Benzie IFF, Strain JJ. Ferric reducing ability of plasma (FRAP) as a measure of antioxidant power: the FRAP assay. Anal Biochem. 1996;239:70–76. doi: 10.1006/abio.1996.0292. [DOI] [PubMed] [Google Scholar]
- Bryant RJ, McClung AM. Volatile profiles of aromatic and non-aromatic rice cultivars using SPME/GC-MS. Food Chem. 2011;124:501–513. doi: 10.1016/j.foodchem.2010.06.061. [DOI] [Google Scholar]
- Butsat S, Weerapreeyakul N, Siriamornpun S. Changes in phenolic acids and antioxidant activity in Thai rice husk at five growth stages during grain development. J Agric Food Chem. 2009;57:4566–4571. doi: 10.1021/jf9000549. [DOI] [PubMed] [Google Scholar]
- Careri M, Elviri L, Mangia A. Liquid chromatography-UV determination and liquid chromatography-atmospheric pressure chemical ionization mass spectrometric characterization of sitosterol and stigmasterol in soybean oil. J Chromatogr A. 2006;935:249–257. doi: 10.1016/S0021-9673(01)01079-2. [DOI] [PubMed] [Google Scholar]
- Cherif AO. Phytochemicals components as bioactive foods. In: Iraj R, editor. Bioactive compounds in phytomedicine. Croatia: InTech; 2012. pp. 113–124. [Google Scholar]
- Chi HY, Lee CH, Kim KH, Kim SL, Chung IM. Analysis of phenolic compounds and antioxidant activity with H4IIE cells of three different rice grain varieties. Eur Food Res Technol. 2007;225:887–893. doi: 10.1007/s00217-006-0498-3. [DOI] [Google Scholar]
- Chung HS, Shin JC. Characterization of antioxidant alkaloids and phenolic acids from anthocyanin-pigmented rice (Oryza sativa cv. Heuginjubyeo) Food Chem. 2007;104:1670–1677. doi: 10.1016/j.foodchem.2007.03.020. [DOI] [Google Scholar]
- Clemente AC, Desai PV. Evaluation of the total phenolic content and primary antioxidant activity of various extracts of Amaranthus tricolor Linn. J Pharm Res. 2012;5:1596–1599. [Google Scholar]
- Deepa G, Singh V, Naidu KA. Nutrient composition and physicochemical properties of Indian medicinal rice-Njavara. Food Chem. 2008;106:165–171. doi: 10.1016/j.foodchem.2007.05.062. [DOI] [Google Scholar]
- Drummer OH. Benzodiazepines—effects on human performance and behavior. Forensic Sci Rev. 2002;14:1–14. [PubMed] [Google Scholar]
- Duke JA. Handbook of phytochemical constituents of GRAS herbs and other economic plants. Boca Raton: CRC Press; 1992. [Google Scholar]
- Imanzadeh G, Arastehfard Z, Sadra Y (2011) Synthesis and conformational analysis of new derivatives of 7-chloro-1, 3-dihydro-5-phenyl-2h-1, 4-benzodiazepine-2-one. arXiv preprint arXiv:1112.5533
- Jang S, Xu Z. Lipophilic and hydrophilic antioxidants and their antioxidant activities in purple rice bran. J Agric Food Chem. 2009;57:858–862. doi: 10.1021/jf803113c. [DOI] [PubMed] [Google Scholar]
- Jayaprakasha GK, Jena BS, Negi PS, Sakariah KK. Evaluation of antioxidant activities and antimutagenicity of turmeric oil: a byproduct from curcumin production. Z Naturforsch [C] 2002;57:828–835. doi: 10.1515/znc-2002-9-1013. [DOI] [PubMed] [Google Scholar]
- Jin L, Xiao P, Lu Y, Shao YF, Shen Y, Bao JS. Quantitative trait loci for brown rice color, phenolics, flavonoid contents, and antioxidant capacity in rice grain. Cereal Chem. 2009;86:609–615. doi: 10.1094/CCHEM-86-6-0609. [DOI] [Google Scholar]
- Juliano BO. Rice chemistry and technology. USA: American Association of Cereal Chemists; 1985. p. 757. [Google Scholar]
- Kiing S, Rajan PY, Wong S. Effect of germination on oryzanol content of selected Sarawak rice cultivars. Am J Appl Sci. 2009;6:1658–1661. doi: 10.3844/ajassp.2009.1658.1661. [DOI] [Google Scholar]
- Kiso Y, Suzuki Y, Oshima Y, Hikino H. Stereostructure of curlone, a sesquiterpenoid of curcuma-longa rhizomes. Phytochemistry. 1983;22:596–597. doi: 10.1016/0031-9422(83)83057-X. [DOI] [Google Scholar]
- Kohno Y, Egawa Y, Itoh S. Kinetic study of quenching reaction of singlet oxygen and scavenging reaction of free radical by squalene in n-butanol. Biochim Biophys Acta. 1995;1256:52–56. doi: 10.1016/0005-2760(95)00005-W. [DOI] [PubMed] [Google Scholar]
- Kong S, Lee J. Antioxidants in milling fractions of black rice cultivars. Food Chem. 2010;120:278–281. doi: 10.1016/j.foodchem.2009.09.089. [DOI] [Google Scholar]
- Kumar KVA, Gowda VK. Evaluation of hepatoprotective and antioxidant activity of Flemingia strobilifera R.Br. against experimentally induced liver injury in rats. Int J J Pharm Pharm Sci. 2011;3:115–119. [Google Scholar]
- Lai P, Li KY, Lu S, Chen HH. Phytochemicals and antioxidant properties of solvent extracts from Japonica rice bran. Food Chem. 2009;117:538–544. doi: 10.1016/j.foodchem.2009.04.031. [DOI] [Google Scholar]
- McDonald S, Prenzler PD, Autolovich M, Robards K. Phenolic content and antioxidant activity of olive extracts. Food Chem. 2001;73:73–84. doi: 10.1016/S0308-8146(00)00288-0. [DOI] [Google Scholar]
- Muntana N, Prasong S. Study on total phenolic contents and their antioxidant activities of Thai white, red, and black rice bran extracts. Pak J Biol Sci. 2010;13:170–174. doi: 10.3923/pjbs.2010.170.174. [DOI] [PubMed] [Google Scholar]
- Nam SH, Choi SP, Kang MY, Koh HJ, Kozukue N, Friedman M. Antioxidative activities of bran extracts from twenty one pigmented rice cultivars. Food Chem. 2006;94:613–620. doi: 10.1016/j.foodchem.2004.12.010. [DOI] [Google Scholar]
- Nene YL. Rice research in South Asia through ages. Asian Agric Hist. 2005;9:85–106. [Google Scholar]
- Ozgen M, Reese RN, Tulio AZ, Scheerens JC, Miller AR. Modified 2,2-azino-bis-3-ethylbenzothiazoline-6-sulfonic acid (ABTS) method to measure antioxidant capacity of selected small fruits and comparison to ferric reducing antioxidant power (FRAP) and 2,2-diphenyl-1-picrylhydrazyl (DPPH) methods. J Agric Food Chem. 2006;54:1151–1157. doi: 10.1021/jf051960d. [DOI] [PubMed] [Google Scholar]
- Pavel S, Borivoj K, Vlastimil K. Determination of total phenolic compounds and their antioxidant activity in vegetables–evaluation of spectrophotometric methods. J Agric Food Chem. 2006;54:607–616. doi: 10.1021/jf052334j. [DOI] [PubMed] [Google Scholar]
- Rahman S, Sharma MP, Suman S. Nutritional and medicinal value of some indigenous rice varieties. Indian J Tradit Knowl. 2006;6:454–458. [Google Scholar]
- Rao ASVC, Reddy SG, Babu PP, Reddy AR. The antioxidant and antiproliferative activities of methanolic extracts from Njavara rice bran. BMC Complement Alternat Med. 2010;10:2–9. doi: 10.1186/1472-6882-10-4. [DOI] [PMC free article] [PubMed] [Google Scholar]
- Rattanachitthawat S, Suwannalert P, Riengrojpitak S, Chaiyasut C, Pantuwatana S. Phenolic content and antioxidant activities in red unpolished Thai rice prevents oxidative stress in rats. J Med Plants Res. 2010;4:796–801. [Google Scholar]
- Shen Y, Jin L, Xiao P, Lu Y, Bao JS. Total phenolics, flavonoids, antioxidant capacity in rice grain and their relations to grain color, size and weight. J Cereal Sci. 2009;49:106–111. doi: 10.1016/j.jcs.2008.07.010. [DOI] [Google Scholar]
- Singh S, Manoj KP, Subudhi E, Nayak S. Chemical composition of leaf and rhizome oil of an elite genotype Curcuma longa L. from South Eastern Ghats of Orissa. J Pharm Res. 2010;3:1630–1633. [Google Scholar]
- Storck CR, Silva LPD, Fagundes CAA. Categorizing rice cultivars based on differences in chemical composition. J Food Compos Anal. 2005;18:333–341. doi: 10.1016/j.jfca.2004.09.005. [DOI] [Google Scholar]
- Tananuwong K, Tewaruth W. Extraction and application of antioxidants from black glutinous rice LWT. Food Sci Technol. 2010;43:476–481. [Google Scholar]
- Vasco C, Ruales J, Kamal-Eldin A. Total phenolic compounds and antioxidant capacities of major fruits from Ecuador. Food Chem. 2008;111:16–823. doi: 10.1016/j.foodchem.2008.04.054. [DOI] [Google Scholar]
- Walter M, Marchesan E. Phenolic compounds and antioxidant activity of rice. Braz Arch Biol Technol. 2011;54:371–377. doi: 10.1590/S1516-89132011000200020. [DOI] [Google Scholar]
- Xu Z, Hua N, Godber JS. Antioxidant activity of tocopherols, tocotrienols, and γ-oryzanol components from rice bran against cholesterol oxidation accelerated by 2,2′-azobis(2-methylpropionamidine) dihydrochloride. J Agric Food Chem. 2001;49:2077–2081. doi: 10.1021/jf0012852. [DOI] [PubMed] [Google Scholar]
- Yafang S, Gan Z, Jinsong B. Total phenolic content and antioxidant capacity of rice grains with extremely small size. Afr J Agric Res. 2011;6:2289–2293. [Google Scholar]
- Zhang MW, Guo BJ, Zhang RF, Chi JW, Wei ZC, Xu ZH. Separation, purification and identification of antioxidant compositions in black rice. Agric Sci China. 2006;5:431–440. doi: 10.1016/S1671-2927(06)60073-4. [DOI] [Google Scholar]
- Zhang MW, Zhang RF, Zhang FX, Liu RH. Phenolic profiles and antioxidant activity of black rice bran of different commercially available varieties. J Agric Food Chem. 2010;58:7580–7587. doi: 10.1021/jf1007665. [DOI] [PubMed] [Google Scholar]
- Zubair M, Anwar F, Ashraf M, Uddin MK. Characterization of high-value bioactives in some selected varieties of Pakistani rice (Oryza sativa L.) Int J Mol Sci. 2012;13(4):4608–4622. doi: 10.3390/ijms13044608. [DOI] [PMC free article] [PubMed] [Google Scholar]


