

Abstract
Asparagus residues were used as materials to obtain antioxidant compounds by solid–liquid extraction in this study. The effects of different extraction parameters including extraction solvents, time, temperature and liquid–solid ratio on the contents of total flavonoids, total phenolics and total antioxidant activity were investigated. Antioxidant activity of the extract from asparagus residues was evaluated by HPLC- ABTS · + and the bioactive components were identified by HPLC- MS/MS. The results showed that the extraction yield was significantly influenced (P < 0.05) by solvent composition, extraction time and temperature. The appropriate parameters were preferred as extraction solvent of 50 % ethanol with liquid–solid ratio of 30:1, extraction temperature of 80 °C and time of 2 h. Antioxidant activity evaluation of the extract indicated flavonoids and phenolics were dominant bioactive compounds. Five antioxidant compounds were identified as ferulic acid, kaempferol, quercetin, rutin and isorhamnetin.
Keywords: Antioxidant activity, Asparagus residues, Extraction, Flavonoids, Phenolics
Introduction
Asparagus officinalis L., a well known healthy vegetable, which was named as “the king of vegetables” for its rich bioactive compounds, now is widely consumed all over the world. Bioactive components, such as flavonoid, lignan and steroidal saponin were found in this plant (Fukushi et al. 2010; Hafizur et al. 2012). Pharmacological studies demonstrated its anti-inflammatory(Jang et al. 2004), anti-mutagenic and antifungal activities (Tsao and Deng 2004). In some countries, it had been used as an anticancer herbal medicine for a long time. In China, asparagus was also used as a medicine, to treat cough, inflammation, fungal infection and cancer. In pharmacological studies, the extract from asparagus was shown to have several biological activities, such as antioxidant activity.
Asparagus spears and stem were usually processed into canned products in food industry, while the residues through processing were discarded, which caused environmental pollution and resources wastes. Therefore, the recycling of the residues has become an important task in food industry. A systematic reduction in waste disposal would be profitable in economical and ecological aspects. Currently, agricultural residues have become focused as materials on the production of bioactive compounds (Shi et al. 2005). Many of bioactive compounds were mainly located in the lower portions of the asparagus spears, which were discarded during the industrial processing (Rodríguez et al. 2005), it is of practical interest to add value to the residues by obtaining functional extract containing one or more of bioactive compounds. Therefore, it is necessary to recycle asparagus residues from wastes to supplements for food and pharmaceutical industries (Zhao et al. 2011).
Extraction was a critical step in isolation and recovery of bioactive compounds. Equilibrium and mass transfer rate were the two fundamental factors that govern the extraction process (Cacace and Mazza 2003). Mathematical modelling of solid–liquid extraction processes was an important engineering tool in the design process in order to reduce energy, time and chemical reagents consumption. The most commonly used empirical model was the Peleg’s one for the description of moisture sorption curve (Peleg 1988) which could be adopted during extraction processes (Kitanović et al. 2008; Bucić-Kojić et al. 2007; Jokić et al. 2010). In addition, there exist many factors such as solvent composition, extraction time, temperature, pH, solid-to-liquid ratio and particle size, which might significantly influence the solid–liquid extraction process (Prior et al. 2005).
Numerous assays were developed for measuring the antioxidant activities and radical-scavenging capabilities of food and biological products. However, there was no universal method that could measure the antioxidant capacities of all products accurately and quantitatively (He et al. 2012). Currently, on-line HPLC-ABTS · + assay for analyzing free radical scavenging activity was developed based on the decrease in absorbance at 734 nm after post column reaction of HPLC separated antioxidants with ABTS · + (Koleva et al. 2010; He et al. 2010; Gong et al. 2012a).
Some bioactive components in the inedible part of asparagus including polysaccharides (Zhao et al. 2011, 2012), oligosaccharides (Li et al. 2012), phenolics, mainly flavonoids (Fuentes-Alventosa et al. 2009a, b; Baiano et al. 2014) were extracted with microwave-assisted extraction (Baiano et al. 2014), ultrasonic circulating extraction (Zhao et al. 2012) and hot water extraction (Li et al. 2012). However, the extraction, fractionation, identification and evaluation antioxidant capacity of antioxidant compounds from asparagus residues were rarely reported.
The objective of this work was to investigate the effects of extraction solvent, liquid–solid ratio, temperature and time on the contents of total flavonoids (TF), total phenolics (TP) and total antioxidant activity (TAA) of the extract from asparagus residues. A mathematical model, based on Peleg’s equation, was proposed to describe extraction kinetics, and one-factor-at-a-time approach was applied to optimize extraction condition. In addition, antioxidant capacity of the extract was also evaluated by off-line and on-line of high performance liquid chromatography coupling with ABTS radical reaction system (HPLC-ABTS · +) and antioxidant compounds in the extract were identified by HPLC-ESI-MSn.
Materials and methods
Materials and chemicals
The dried segments (residues) of Asparagus officinalis L. (asparagus) were provided by Qinhuangdao Changsheng Agricultural Science and Technology Co., Ltd. (Hebei, China). Samples, with moisture content of 7.2 % after dying, were ground and passed through a 40-mesh sieve, giving particles with average diameter (dp) ≤ 420 μm.
Folin-Ciocalteu’s phenol reagent, 2,2′-azinobis-(3-ethylbenzothiazolin-6-sulfonic acid) (ABTS), 1,1-diphenyl-2-picrylhydrazyl (DPPH), 6-hydroxyl-2,5,7,8-tetramethyl-chroman-2-carboxylic acid (Trolox), were purchased from Sigma-Aldrich (St. Louis, MO, USA). All the solvents (analytical grade) were purchased from Beijing Chemical Co. (Beijing, China).
Extraction procedure
Extraction process was a very important stage for isolation and identification of bioactive components. In this study, a mathematical model, based on Peleg’s model, was proposed to describe extraction kinetics, and one-factor-at-a-time approach was applied to investigate the effects of extraction parameters (solvent, time, temperature and liquid–solid ratio) on the yield of TP, TF and TAA of the extract which were the key responses of the extraction process.
The initial step of the extraction experiment was to study the effects of extraction solvents. The asparagus residues (5 g) were placed into a flask (200 mL) and solvent (acetone, ethanol or methanol) with different concentrations in distilled water (10, 30, 50, 70 and 90 %, v/v) was added at liquid–solid ratio of 20:1. Then, the extraction flask was placed in the water bath with a speed of 80 rpm (DSHZ-300 Taicang Experimental Instrument Factory, Jiangsu, China) at the constant temperature of 70 °C for 2 h. The extract was filtered and each filtered extract was stored in an amber-colored airtight container at −18 °C until analyzed. Secondly, kinetic experiments were performed to model the influence of extraction time (from 0.25 to 2.5 h) on the yield of TP, TF and TAA. The temperature was kept 70 °C at the liquid–solid ratio of 20:1 with the appropriate solvent. Thirdly, the effects of extraction temperature on the content of TP, TF and TAA were performed between 50 and 90 °C at a certain period of time with appropriate solvent. Finally, the liquid–solid ratio were designed in the range of 10:1 and 50:1 and extraction experiments were carried out at appropriate temperature and time with proper solvent.
Preparation of the crude extract and fractions
The crude extract was centrifuged at 4,200 rpm for 10 min and supernatant was collected, vaporized under vacuum at ≤ 50 °C. Then, the supernatant was fractionized into four fractions with ethyl ether, ethyl acetate and n-butanol, respectively (He et al. 2011). The upper phase during each liquid-liquid extraction was marked as Fa, Fb and Fc. The lower phase during last liquid-liquid extraction was residue aqueous phase marked as Fd. All the fractions were evaporated to dryness under vacuum at ≤ 50 °C, redissolved in methanol (10 mL), filtered with membrane (0.45 μm) and used for HPLC analysis.
Kinetic model
It has been stated that there was a similarity between extraction curves and sorption curves (Bucić-Kojić et al. 2007; Jokić et al. 2010). Therefore, the application of Peleg’s equations for modelling preliminary extraction results was examined. The equation of the model proposed by Peleg (Peleg 1988) was adapted for extraction processes in the form of Eq. (1):
| 1 |
(where C(t) is the concentration of sample at time t (mg/g DW), t is the extraction time (min), C0 is the initial concentration of sample at time t = 0 (mg/g DW), K1 is Peleg’s rate constant (min · g/mg) and K2 is Peleg’s capacity constant (g/mg). Since C0 in all the experimental runs was 0, Eq. (2) was used in the final form of Eq. (1):
| 2 |
The Peleg’s rate constant K1 relates to extraction rate (B0) at the very beginning (t = t0),
| 3 |
The Peleg’s capacity constant K2 relates to maximum of extraction yield, i.e. equilibrium concentration of extracted total phenolis (Ce). When t → ∞, Eq. (4) gives the relations between equilibrium concentration and K2 constant,
| 4 |
C(t) could be estimated using Eq. (2) after determining K1 (Peleg’s rate constant) and K2 (Peleg’s capacity constant) values by plotting the graph between 1/Ct vs. 1/t.
Determination of total flavonoids(TF) content
TF content was determined by the aluminium chloride colorimetric method reported by Gong et al. (2012a). 0.5 mL of sample (appropriately diluted) was mixed with 3.5 mL of distilled water and 0.3 mL of sodium nitrite (75 g/L), then the mixture reacted for 5 min. 3 mL of aluminium chloride solution (10 g/L) was added and the mixture reacted for 6 min, followed by an addition of 2 mL sodium hydroxide solution (40 g/L). The final volume of the solution was up to 10 mL using distilled water. After the reaction of 15 min, the absorbance was measured against a blank at 510 nm with a UV-visible spectrophotometer (Shimadzu UV-1800, Kyoto, Japan). The calibration curve for this measurement was established with standard solution of rutin and the results were expressed as rutin equivalents (RE) mg per g dry weight (DW).
Determination of total phenolic (TP) content
TP content was measured by Folin-Ciocalteu method as described by Gong et al. (2012b) with minor modifications. 0.5 mL of sample with appropriate dilution was mixed with 2.5 mL of Folin-Ciocalteu reagent (0.2 N). After the reaction of 5 min, 2.0 mL of sodium carbonate (75 g/L) was added and reacted for 2 h at room temperature. The absorbance of the mixture was measured at 760 nm with a UV-visible spectrophotometer (Shimadzu UV-1800, Kyoto, Japan). Gallic acid was used as a standard and the results were expressed as gallic acid equivalents (GAE) mg per g DW.
Evaluation of radical scavenging capacity (RSC)
ABTS · + radical scavenging activity
The capacity of scavenging ABTS · + was evaluated as described by Gong et al. (2012b). ABTS · + was prepared by ABTS stock solution (7 mmol/L in water) mixed with 2.45 mmol/L potassium persulfate. This mixture was kept in the dark for 12–16 h at room temperature. The working solution of ABTS · + was prepared by the stock solution which was diluted until an absorbance of 0.7 ± 0.02 at 734 nm. Then, 1 mL of sample (appropriately diluted) and 3 mL of ABTS · + working solution were mixed for reaction in the dark for 1 h, and the absorbance was recorded at 734 nm with a UV-visible spectrophotometer (Shimadzu UV-1800, Kyoto, Japan). The dose–response curves of Trolox were carried out by the above mentioned method. The scavenging capacity was calculated as Eq. (5):
| 5 |
(where Asample is the absorbance of ABTS · + with sample at 734 nm; Acontrol refers to the absorbance of ABTS · +without sample at 734 nm).
All of the results were expressed as Trolox equivalent antioxidant capacity and expressed as Trolox equivalent antioxidant capacity (mmol TEAC/g DW).
DPPH · radical scavenging activity
The scavenging DPPH · was carried out on the basis of the method descrided by He et al. (2010). DPPH was dissolved in ethanol to the concentration of 1.75 × 10⁻⁴ mol/L. 2 mL of diluted extract was mixed with 2 mL of DPPH solution, the mixture was kept in dark for 60 min and the absorbance at 517 nm was measured with a UV-visible spectrophotometer (Shimadzu UV-1800, Kyoto, Japan). The dose–response curves of Trolox were carried out by the above mentioned method. The scavenging capacity was calculated as Eq. (6):
| 6 |
(where Asample is the absorbance of DPPH · with sample at 517 nm; Acontrol refers to the absorbance of DPPH · without sample at 517 nm).
All of the results were expressed as Trolox equivalent antioxidant capacity and expressed as Trolox equivalent antioxidant capacity equivalent (mmol TEAC/g DW).
HPLC-DAD and HPLC-EDI-MSn analysis
Seperation of the antioxidant compounds in four fractions of the extract was performed on a HPLC equipment of Agilent 1100 series with a diode array detector (DAD)(He et al. 2011). Sample (20 μL) was separated on an Agilent Zorbax SB C-18 comlumn (250 mm × 4.6 mm i.d., 5 μm particle size) with a gradient elution system. The mobile phase consisted of two solvents: solvent A was 0.2 % (v/v) formic acid, and solvent B was 100 % methanol. Gradient elution was carried out as follows: initially, 70 % of solvent A followed from 70 to 60 % in 10 min, 60–30 % from 10 to 25 min, from 30to 25 % in 5 min, and 25–15 % from 30 to 35 min. The flow rate was kept at 0.7 mL/min and the temperature of column was 30 °C. The DAD wavelength was set at 280 nm.
The identification of antioxidant compounds in four fractions of the extract was carried out by comparing the characteristics of DAD spectra, retention time of standard compounds and MS data to those in the literature. The mass detector was an Agilent G6310 ion-trap mass spectrometer (Agilent Technologies, USA) equipped with the electrospray ionization (ESI) system and controlled by Agilent LC/MSD trap software. Nitrogen was used as nebulizing gas at a pressure of 40 psi and the flow rate was adjusted at 12 L/min. The nebulizer temperature was 350 °C and capillary voltage was maintained at 4,000 V. The full scan mass spectra of the compounds were measured from m/z 100 to m/z 1200. MS data were acquired in the positive ionization mode and MS/MS data in the automatic mode.
HPLC coupled with ABTS assay was performed by using the method developed by He et al. (2011), (2010), Gong et al. (2012b) and Koleva et al. (2010) with some modifications. The extract (20 μL) was injected into an Agilent HPLC system. HPLC separation was carried out as described in the previous section. HPLC eluate from the column then arrived at a T-junction, where the ABTS reagent was added. The ABTS reagent flow rate was 0.5 mL/min delivered by a Waters Reagent Pumn (Waters Corporation, USA). After the eluate mixed with ABTS reagent in a reaction coil (15 m × 0.25 mm i.d. PEEK tubing) maintained at 30 °C with a Waters temperature control module (Waters Corporation, USA), the negative peaks were measured by DAD at 734 nm. Data were analyzed using Agilent Chemstation Software.
Statistical analyses
The extraction experiments were conducted in duplicate, and all the analyses were done in triplicate. The results were presented as the means ± standard deviation. Data were analyzed by one-way analysis of variance using the SPSS 16.0 package (SPSS Inc., Chicago, USA), and the means were analyzed by Duncan’s multiple-range test. The correlations analysis was carried out using the Pearson mode. The concordance between experimental data and calculated values was established by the root mean squared deviation (RMSD).
Results and discussion
Extraction procedure
Extraction solvents
The impact of different extraction solvents on TP, TF contents and TAA was evaluated and the results showed that the contents of TP, TF and TAA were dependent on the type and concentration of extraction solvents (Table 1). With the organic solvent concentration increasing, TF content was initially increased and then decreased. The content of TF in the extracts with different solvents reached the highest value at 30 % of acetone, 50 % of ethanol and 70 % of methanol, respectively. TF content in the extracts with 30 % acetone and 50 % ethanol were significantly (P < 0.05) higher than those with other solvent concentrations. This phenomenon might be attributed to the change of solvent polarity with the rise of organic solvent proportion. Furthermore, soluble phenolic compounds were mainly distributed in the cell vacuoles, while most lignin, flavonoids, and insoluble phenolics compounds were deposited in the cell wall combined with proteins and polysaccharides through the hydrogen bond and hydrophobic bond. Low concentration of organic solvents could access to cells, but high concentration would cause protein denaturation, preventing the dissolution of polyphenols and then influencing the extraction rate (Chen et al. 2013). Apart from polarity of the solvents, there were several factors such as solvent viscosity, surface tension and vapour pressure affecting extraction yield (Yang et al. 2009). Comparing the maximum levels of TP in the extract with different solvents, TP content in the extract with 50 % ethanol was significant higher than that with 70 % methanol (P < 0.05).
Table 1.
The effects of different solvents on total flavonoids (TF), total phenolics (TP) contents and antioxidant activity (TAA) of asparagus residues extract
| Extraction solvent | TF (mg RE/g) | TP (mg GAE/g) | TAA (DPPH radical scavenging) (mmol TEAC g−1) | TAA (ABTS radical scavenging) (mmol TEAC g−1) |
|---|---|---|---|---|
| Acetone (%) | ||||
| 10 | 4.50 ± 0.48bc | 10.68 ± 0.57b | 0.040 ± 0.004cde | 0.081 ± 0.005gh |
| 30 | 5.24 ± 0.44a | 11.63 ± 0.59a | 0.050 ± 0.004ab | 0.102 ± 0.005cde |
| 50 | 4.52 ± 0.31bc | 11.84 ± 0.61a | 0.044 ± 0.002bcd | 0.096 ± 0.006def |
| 70 | 4.16 ± 0.27bcd | 7.78 ± 0.44e | 0.035 ± 0.005efg | 0.074 ± 0.004h |
| 90 | 3.85 ± 0.24cd | 5.366 ± 0.55g | 0.030 ± 0.005g | 0.058 ± 0.001i |
| Ethanol (%) | ||||
| 10 | 4.26 ± 0.43bcd | 10.58 ± 0.46b | 0.040 ± 0.002cde | 0.109 ± 0.004cd |
| 30 | 4.88 ± 0.34ab | 11.24 ± 0.02ab | 0.049 ± 0.004ab | 0.127 ± 0.005b |
| 50 | 5.43 ± 0.39a | 12.03 ± 0.22a | 0.056 ± 0.003a | 0.141 ± 0.003a |
| 70 | 4.36 ± 0.44bcd | 9.55 ± 0.31c | 0.044 ± 0.001bc | 0.111 ± 0.003c |
| 90 | 4.05 ± 0.52cd | 4.43 ± 0.45h | 0.031 ± 0.002fg | 0.086 ± 0.006fgh |
| Methanol (%) | ||||
| 10 | 3.68 ± 0.21d | 6.16 ± 0.21f | 0.031 ± 0.001fg | 0.056 ± 0.005i |
| 30 | 3.84 ± 0.20cd | 7.64 ± 0.19e | 0.038 ± 0.001cde | 0.075 ± 0.005h |
| 50 | 4.16 ± 0.06bcd | 8.56 ± 0.54d | 0.040 ± 0.001cde | 0.096 ± 0.001def |
| 70 | 4.26 ± 0.17bcd | 8.92 ± 0.31cd | 0.043 ± 0.002bcd | 0.105 ± 0.004cd |
| 90 | 4.08 ± 0.12cd | 7.17 ± 0.55e | 0.037 ± 0.002def | 0.089 ± 0.007efg |
Extractions were carried out at 70 °C for 2 h in the liquid–solid ratio of 20:1
The results were expressed as mean ± standard deviation (n = 3), the different letters indicated that difference was significant (P < 0.05), and the same letter was expressed as insignificant difference (P > 0.05)
The value of TAA was gradually elevated with the increase of organic solvent proportion in the extraction solvent, and the maximum values were observed in the extract obtained with 30 % acetone, 50 % ethanol and 70 % methanol, respectively. This phenomenon was similar to the extraction of phenol compounds from the rootlets reported by Meng et al.(2009). TAA of the extracts obtained with different extraction solvents presented the following order: 50 % ethanol > 30 % acetone (P > 0.05) > 70 % methanol (P > 0.05) (DPPH assay), 50 % ethanol > 70 % methanol (P < 0.05) > 30 % acetone (P > 0.05) (ABTS assay). The higher activity of the extract obtained with medium concentration ethanol was probably due to its higher polarity, lower viscosity and surface tension as compared to other solvents. Considering TP, TF contents and TAA, as well the safety of solvents, 50 % ethanol was ultimately chosen as the extraction medium. The same conclusion was also reported by Liyana-Pathirana and Shahidi (2005) and Jing et al. (2011).
Relationship between TAA and contents of TP and TF
From Table 1, it could be found that TAA was increased with the rise of TP and TF contents in the extract. To gain a better understanding of the relationship between TAA and contents of TP and TF, the analysis of TAA correlating with TP and TF contents were performed (Table 2). TAAs with ABTS · + and DPPH · were correlated with TP and TF contents in the extract with different organic solvents. And, the different correlation coefficients of two assays (DPPH and ABTS) was estimated due to the production of the free radicals in different ways. DPPH · was a nitrogen radical relatively stable, ABTS · + was produced by the reaction among ABTS, potassium persulfate and H2O2 (Re et al. 1999). ABTS · + was soluble in both aqueous and organic solvents and was not affected by ionic strength. Some antioxidants, which reacted quickly with peroxyl radicals, might react slowly or even be inert to DPPH · due to steric inaccessibility (Koleva et al. 2010). These results of correlation analysis revealed that phenolics and flavonoids compounds would probably play an important role in the antioxidant capacity of the extract from asparagus residues, which corresponded to the previous reports (Sun 2007; Fuentes-Alventosa et al. 2008).
Table 2.
Linear correlation coefficients between the contents of total flavonoids (TF), total phenolics (TP) and antioxidant activity of the extract
| Ethanol | Acetone | Methanol | ||||
|---|---|---|---|---|---|---|
| TAA | DPPH· | ABTS · + | DPPH· | ABTS · + | DPPH· | ABTS · + |
| TF | y = 1.62x−0.32 | y = 3.53x−0.47 | y = 1.47x−0.25 | y = 0.25x + 0.15 | y = 3.47x−0.66 | y = 1.57x−0.37 |
| R2 = 0.878 | R2 = 0.910 | R2 = 0.947 | R2 = 0.840 | R2 = 0.817 | R2 = 0.877 | |
| TP | y = 0.28x + 0.16 | y = 0.62x + 0.55 | y = 3.12x−0.56 | y = 0.59x + 0.26 | y = 0.89x + 0.02 | y = 0.59x + 0.07 |
| R2 = 0.801 | R2 = 0.819 | R2 = 0.852 | R2 = 0.902 | R2 = 0.913 | R2 = 0.949 | |
Extraction time
Figure 1(a) and (b) showed the variations of TF and TP content as well TAA with the extension of time in the extracts obtained with a 50 % aqueous ethanol solution at temperature of 70 °C. As observed, both TP, TF contents and TAA were rapidly increased with time extension at the first 1 h, then kept to a constant value or slightly decreased. The kinetic curve was composed of three parts: the first part corresponded to dissolution of easily available substances at a particle surface. The second part described the simultaneous dissolution of the remaining substances at the surface and the substances in the internal region of the solid and last part was slowly (or no) rise of the curve, which showed the entire exhausting of the surface region of soluble substances (Diankov et al. 2011).
Fig. 1.

Comparison of experimental (symbols) and predicted by Peleg’s model (line) values for the extraction of antioxidant compounds from asparagus residues with 50 % aqueous ethanol (each experimental value was the mean of three measurements)
After a very fast initial increase (0–0.5 h), the rate of TF and TP accumulation in the solvent was rapidly decreased. After about 2 h of extraction, TP and TF contents reached a maximum values, which were 11.42 mg/g and 4.95 mg/g, respectively. Decrease of TF and TP contents with an extension of extraction time, especially after the rapidly initial increase, suggested that although TF and TP were efficiently extracted, they were not stable at high temperature and probably a part of already extracted flavonoids and phenolics were thermally degraded under these conditions. Such thermal instability of flavonoids and phenolics has been reported for the extracts and juices from other vegetal sources (Fischer et al. 2013; Cissé et al. 2012; Kechinski et al. 2010). Therefore, an excessive time was not effective to the extraction process, which might be attributed to the degradation of TP and TF for longer extraction time (Liyana-Pathirana and Shahidi 2005; Chirinos et al. 2007).
Peleg’s equations (Eq. (2)) were fitted to the experimental data and the model parameters were estimated. In addition, Fig. 1 showed a very good agreement between experimental data and those estimated by the Peleg’s model. Therefore, this model was selected for describing the kinetics of the extraction process from asparagus residues. The values of the initial extraction rate (B0) and maximum content and the strongest TAA (Ce) from the Peleg’s model were estimated (Table 3).
Table 3.
The kinetic parameters of Peleg’s model for TF, TP and TAA; and comparison of experimental and calculated values
| Bioactive compounds | B0(mg/g · min) | K1(min · g/mg) | K2(g/mg) | Ce(mg/g) | RMSD |
| TP | 0.9017 | 1.109 | 0.073 | 13.698 | 0.6211 |
| TF | 0.8496 | 1.177 | 0.207 | 4.831 | 0.2935 |
| TAA | B0(mmol/g · min) | K1(min · g/mmol) | K2(g/mmol) | Ce(mmol/g) | RMSD |
| ABTS · + | 0.0129 | 77.28 | 6.14 | 0.1629 | 0.0046 |
| DPPH· | 0.0118 | 84.96 | 16.80 | 0.0595 | 0.0028 |
The maximum contents of TF and TP for extraction time of 2 h, were 4.78 mg/g and 11.8 mg/g, respectively, which were 1.7 and 1.5 times higher than those for 0.5 h. Figure 1(b) indicated that TAAs (ABTS · + and DPPH·) were increased with the extension of extraction time, and reached to the maximum values at 2 h, which were 0.142 mmol/g and 0.062 mmol TEAC/g, respectively. Similar phenomenon was also observed in other studies (Sun 2007; Karacabey and Mazza 2010). Thus, the extraction time of 2 h was preferred as the appropriate extraction time.
Extraction temperature
The effect of extraction temperature (50–90 °C) on the contents of TP and TF as well TAA was investigated with 50 % ethanol and liquid–solid ratio of 20:1 for 2 h. Figure 2(a) demonstrated that the content of TP was affected significantly (P < 0.05) by the temperature. With the rise of temperature, the contents of TP, TF and TAA were firstly increased and then decreased (Fig. 2b). This phenomenon could be explained that at low temperatures, the mass transfer was slow and the raw material was required for longer time to dissolve bioactive components into the solution, at high temperature, solvent viscosity was declined and the molecular movement was accelerated, which led to increase the dissolution of bioactive compounds due to the increase of diffusion coefficient. However, at higher temperature, bioactive compound dissolution came into equilibrium in a short period and had little change with the increase of the extraction temperature, even bioactive compounds were gradually degraded (Liyana-Pathirana and Shahidi 2005; Türker and Erdoğdu 2010). The contents of TP and TF reached maximum values at 80 °C, which were 11.7 mg/g and 5.5 mg/g, respectively. Thus, the extraction temperature of 80 °C was preferred.
Fig. 2.

Influence of extraction temperature on the contents of total phenolics, total flavonoids and total antioxidant activity (DPPH, ABTS assays) of the extracts from asparagus residues a. Theresults were expressed as mean ± standard deviation (n = 3), the different letters indicated that the difference was significant (P < 0.05), and the only same letter was expressed as insignificant difference (P > 0.05). a Extractions were carried out for 2 h with the solvent of 50 % ethanol
Extraction liquid–solid ratio
In order to evaluate the effect of liquid–solid ratio ranging from 10:1 to 50:1 on contents of TP and TF, the extractions were carried out with ethanol concentration of 50 %, extraction time of 2 h and temperature of 80 °C. The results indicated that with the increase of liquid–solid ratio, TF and TP contents were firstly increased and then decreased (Fig. 3a). This was because the higher liquid–solid ratio provided the larger concentration gradient which was favored to the mass transfer but this effect was more significant at small scope of liquid–solid ratio. As the restriction to the mass transfer was greatly related with the solid interior, larger amount of solvent could hardly change the concentration gradient (Mangesh et al. 2013). However, the effect of liquid–solid ratio on the contents of TP and TF was not significant. The similar conclusion was also presented by Yang et al. (2009). From Fig. 3b, the difference of liquid–solid ratio had no significant effect on TAA. TAAs (DPPH and ABTS assays) were initially increased from10:1 to 30:1, and then decreased. Therefore, the appropriate extraction liquid–solid ratio was preferred as 30:1.
Fig. 3.

Influence of liquid–solid ratio on the contents of total phenolics, total flavonoids and total antioxidant activity (DPPH, ABTS assays) of the extracts from asparagus residuesb. The results were expressed as mean ± standard deviation (n = 3), the different letters indicated that the difference was significant (P < 0.05), and the only same letter was expressed as insignificant difference (P > 0.05). b Extractions were carried out for 2 h with the solvent of 50 % ethanol at temperature of 80 °C
On-line HPLC-ABTS assay
Two in vitro assays based on DPPH · and ABTS · + radical scavenging capacity were applied to evaluate antioxidant activity of the extract from asparagus residues. ABTS · + solution was stable during the reaction with fractions. Accordingly, on-line HPLC-ABTS · + rapid screening of individual antioxidants in the extract and fractions was established. ABTS · + solution has a deep green color with maximum absorbance at 734 nm, and any quenching of the radical resulting in a loss of color was indicated by a negative peak on the HPLC profile. The four fractions showed the similar chromatographic fingerprints according to Figs. 4, 5, 6 and 7, and HPLC peaks 1, 3 and 4 could generally be found in the profiles of Fa to Fd. Compounds 5, 7, 8, 9 exhibited little or no (compound 6) scavenging capacity even though they had relative high response values in HPLC profiles. Compounds 1, 2, 3 and 4 showed stronger antioxidant activity. The post-reaction fingerprints of the ABTS · + showed that compounds 1 and 7 exhibited maximal wavelength between 210 and 290 nm, which indicated that they might be phenolic acids with the benzoic acid carbon framework (Robbins 2003). Several other antioxidant compounds detected in Fa (peaks 2, 3, 4 and 5) could give positive peaks in the UV detector at 260 nm and 360 nm, which were the typical flavonoid peaks (De Rijke et al. 2006).
Fig. 4.

HPLC-ABTS · + chromatographic profiles of antioxidant compounds in ethyl ether fraction of the extractc. c Extraction was carried out at 80 °C for 2 h with 50 % ethanol in liquid–solid ratio of 30:1
Fig. 5.
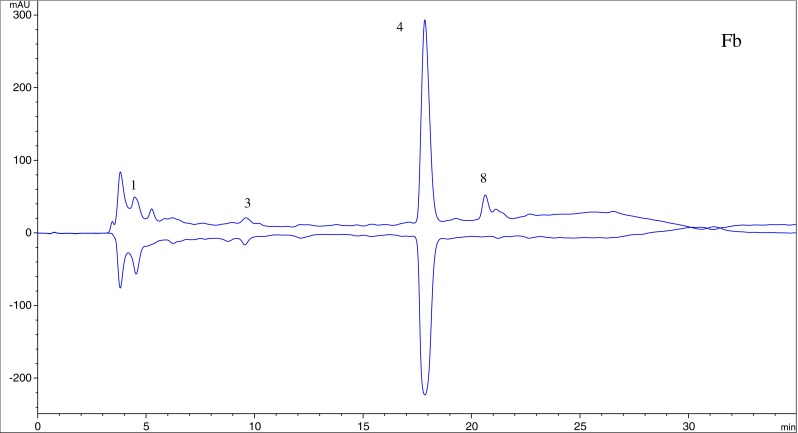
HPLC-ABTS · + chromatographic profiles of antioxidant compounds in ethyl acetate fraction of the extract
Fig. 6.
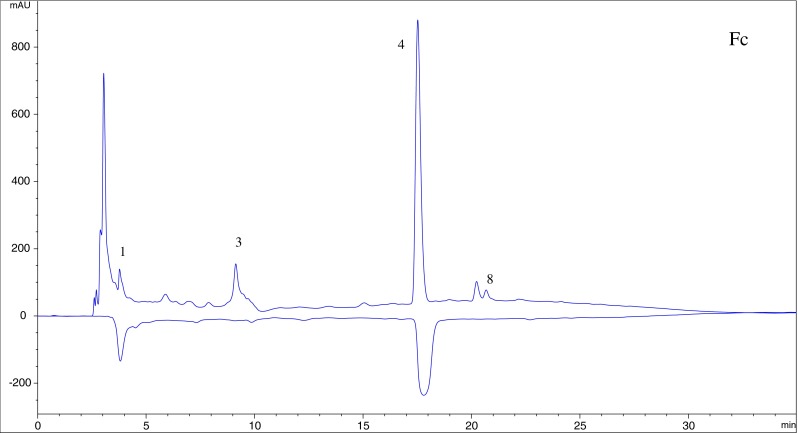
HPLC-ABTS · + chromatographic profiles of antioxidant compounds in n-butanol fraction of the extract
Fig. 7.
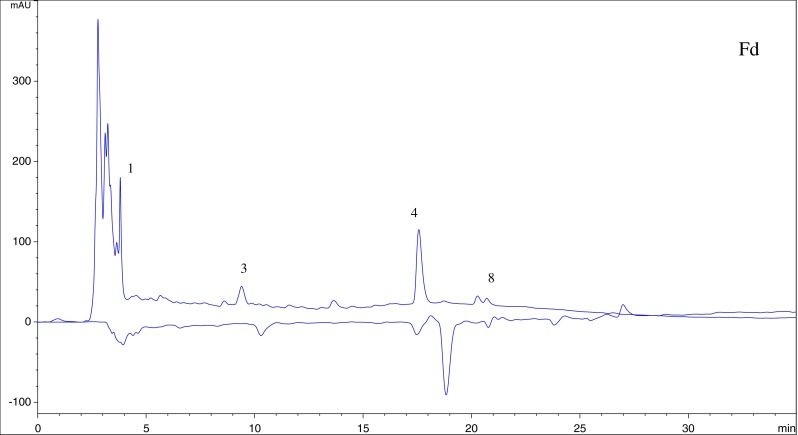
HPLC-ABTS · + chromatographic profiles of antioxidant compounds in aqueous fraction of the extract
HPLC-ESI-MS/MS analysis
HPLC-ESI-MS/MS analysis was conducted to identify targeted compounds. Based on the retention time, DAD and MS/MS spectra, the major free radical scavengers were tentatively identified, and spectral data were presented in Table 4. These compounds could be classified into three categories: phenolic acid, flavonoid glycosides and flavonols.
Table 4.
Mass spectral characteristics and identification of antioxidant activity compounds in asparagus extract
| Peak No. | [M+H]+ | Product ion scan fragments of [M+H]+ (M/Z(%)) | UV-visible max (nm) | Compound |
|---|---|---|---|---|
| 1 | 195 | 178 (89), 132 (23) | 241, 315 | Ferulic acid |
| 2 | 611 | 465(65), 303(84) | 255, 365 | Quercetin-3-rutinoside a |
| 3 | 303 | 275(90), 195(12) | 260, 350 | Quercetin |
| 4 | 317 | 301(86), 153(35), | 240, 365 | Isorhamnetin |
| 5 | 287 | 269(76), 165(33) | 255, 351 | Kaempferol |
| 6 | 432 | 290(67), 247(45), 183(33) | 230, 320 | Not identified |
| 7 | 499 | 481(78), 437(34), 355(52) | 225, 275 | Not identified |
| 8 | 349 | 329(98) | 230, 325 | Not identified |
| 9 | 340 | 322(86), 209(46) | 250, 325 | Not identified |
aComparison with standard
Compound 1, λmax of 315 nm with a shoulder at 240 nm, indicated that it’s phenolic acid. The parent ion of compound1 was m/z 195, and it generated a series of fragments ions at m/z 178, m/z 132. The daughter ion at m/z 178 was formed by the loss of one water molecule from the parent ion. Based on the MS and UV information and comparing with the literature data (Jong et al. 2006), compound 1 was identified as ferulic acid.
Compounds 2, 3 presented two absorption peaks between 190 and 400 nm and could be easily associated with flavonoid. Flavonoid has two maximum absorbances in ultraviolet region of 240–285 nm (band II) and 300–400 nm (band I) (Plazonić et al. 2009). Compound 2 was inferred as flavonoid glycosides on the basis of its UV spectrum. The ESI-MS spectrum displayed an intense parent ion at m/z 611, a fragment m/z 465, which was due to a loss of a rhamnose moiety from the parent ion. The MS/MS fragment at m/z 303 matched with quercetin derivatives. In previous study, the presence of quercetin-3-rutinoside (rutin, compound 2) was revealed in asparagus (Devaraj et al. 2011; Fuentes-Alventosa et al. 2009a, b). Moreover, by comparison with MS, MS/MS data and UV spectrum of the standard compound, compound 2 was identified as quercetin-3-rutinoside (Del Rio et al. 2004; Wang et al. 2003). According to MS, MS/MS data and UV spectrum of compound 3, the fragments of m/z 275 were the products of [M+H-CO], therefore, it was identified as quercetin (Mullen et al. 2003).
Compound 4 (m/z 317), made up of fragments of m/z 301 ([M+H-O]) and m/z 153. According to the literature (Hossain et al. 2010), compound 4 was identified as isorhamnetin.
Compound 5 with [M+H]+of m/z 287 generated a series of fragments ions at m/z 269 and m/z 165. This fragmentation pattern was testified as kaempferol (Lu et al. 2010), so, compound 5 was tentatively identified as kaempferol.
The MS information of peaks 6, 7, 8 and 9 was uncertain and further research work was required to identify their structures.
Conclusion
In this study, the kinetics and favorable parameters of solid–liquid extraction of antioxidant compounds from asparagus residues were estimated. The extract was fractionized into four parts and their antioxidant activities were evaluated by on-line HPLC-ABTS · + method. Flavonoids and phenolics compounds were dominantly contributed to antioxidant activity of the extract from asparagus residues. Five antioxidant compounds, ferulic acid, kaempferol, quercetin, rutin and isorhamnetin were identified with HPLC-MS/MS. The findings implied that asparagus residues could be potential to be utilized as nutraceutical resource.
References
- Baiano A, Bevilacqua L, Terracone C, Contò F, Del Nobile MA. Single and interactive effects of process variables on microwave-assisted and conventional extractions of antioxidants from vegetable solid wastes. J Food Eng. 2014;120:135–145. doi: 10.1016/j.jfoodeng.2013.07.010. [DOI] [Google Scholar]
- Bucić-Kojić A, Planinić M, Tomas S, Bilić M, Velić D. Study of solid–liquid extraction kinetics of total polyphenols from grape seeds. J Food Eng. 2007;81:236–242. doi: 10.1016/j.jfoodeng.2006.10.027. [DOI] [Google Scholar]
- Cacace JE, Mazza G. Mass transfer process during extraction of phenolic compounds from milled berries. J Food Eng. 2003;4:379–389. doi: 10.1016/S0260-8774(02)00497-1. [DOI] [Google Scholar]
- Chen XX, Wu XB, Chai WM, Feng HL, Shi Y, Zhou HT, Chen QX. Optimization of extraction of phenolics from leaves of Ficus virens. J Zhejiang Univ Sci B. 2013;10:903–915. doi: 10.1631/jzus.B1200365. [DOI] [PMC free article] [PubMed] [Google Scholar]
- Chirinos R, Rogez H, Campos D, Pedreschi R, Larondelle Y. Optimization of extraction conditions of antioxidant phenolic compounds from mashua (Tropaeolum tuberosum Ruíz& Pavón) tubers. Sep Purif Technol. 2007;55:217–225. doi: 10.1016/j.seppur.2006.12.005. [DOI] [Google Scholar]
- Cissé M, Bohuon P, Sambe F, Kane C, Sakho M, Dornier M. Aqueous extraction of anthocyanins from Hibiscussabdariffa: experimental kinetics and modeling. J Food Eng. 2012;109:16–21. doi: 10.1016/j.jfoodeng.2011.10.012. [DOI] [Google Scholar]
- De Rijke E, Out P, Niessen WMA, Ariese F, Gooijer C, Brinkman UA. Analytical separation and detection methods for flavonoids. J Chromatogr A. 2006;1112:31–63. doi: 10.1016/j.chroma.2006.01.019. [DOI] [PubMed] [Google Scholar]
- Del Rio D, Stewart AJ, Mullen W, Burns J, Lean ME, Brighenti F, Crozier A. HPLC-MSn analysis of phenolic compounds and purine alkaloids in green and black tea. J Agric Food Chem. 2004;10:2807–2815. doi: 10.1021/jf0354848. [DOI] [PubMed] [Google Scholar]
- Devaraj VC, Krishna BG, Viswanatha GL. Simultaneous determination of quercetin, rutin and kaempferol in the leaf extracts of Moringa oleifera Lam. and Raphinus sativus Linn. by liquid chromatography-tandem mass spectrometry. Chin J Integr Med. 2011;9:1022–1030. doi: 10.3736/jcim20110914. [DOI] [PubMed] [Google Scholar]
- Diankov S, Karsheva M, Hinkov I. Extraction of natural antioxidants from lemon peels. Kinetics and antioxidant capacity. J Univ Chem Technol Metall. 2011;46:315–319. [Google Scholar]
- Fischer UA, Carle R, Kammerer DR. Thermal stability ofanthocyanins and colourless phenolics in pomegranate (Punica granatum L.) juices and model solutions. Food Chem. 2013;138:1800–1809. doi: 10.1016/j.foodchem.2012.10.072. [DOI] [PubMed] [Google Scholar]
- Fuentes-Alventosa JM, Jaramillo S, Rodriguez-Gutierrez G, Cermeno P, Espejo JA, Jimenez-Araujo A. Flavonoid profile of green asparagus genotypes. J Agr Food Chem. 2008;56:6977–6984. doi: 10.1021/jf8009766. [DOI] [PubMed] [Google Scholar]
- Fuentes-Alventosa JM, Jaramillo-Carmona S, Rodríguez-Gutiérrez G, Rodríguez-Arcos R. Effect of the extraction method on phytochemical composition and antioxidant activity of high dietary fiber powders obtained from asparagus by-products. Food Chem. 2009;116:484–490. doi: 10.1016/j.foodchem.2009.02.074. [DOI] [Google Scholar]
- Fuentes-Alventosa JM, Rodríguez-Gutiérrez G, Jaramillo-Carmona S, Espejo-Calvo JA, Rodríguez Arcos R, Fernández-Bolaños Guzmán J, Guillén Bejarano R, Jiménez Araujo A. Effect of extraction method on chemical composition and functional characteristics of high dietary fibre powders obtained from asparagus by-products. Food Chem. 2009;113:665–671. doi: 10.1016/j.foodchem.2008.07.075. [DOI] [Google Scholar]
- Fukushi E, Onodera S, Yamamori A, Shiomi N, Kawabata J. NMR analysis of tri- and tetrasaccharides from asparagus. Magn Reson Chem. 2010;38:1005–1011. doi: 10.1002/1097-458X(200012)38:12<1005::AID-MRC772>3.0.CO;2-Q. [DOI] [Google Scholar]
- Gong Y, Hou ZQ, Gao YX, Xue YS, Liu X, Liu GM. Optimization of extraction parameters of bioactive components from defattedmarigold (Tageteserecta L.) residue using response surface methodology. Food Bioprod Process. 2012;90:546–552. [Google Scholar]
- Gong Y, Liu X, He WH, Xu HG, Yuan F, Gao YX. Investigation into the antioxidant activity and chemical composition of alcoholic extracts from defatted marigold (Tagetes erecta L.) residue. Fitoterapia. 2012;83:481–489. doi: 10.1016/j.fitote.2011.12.013. [DOI] [PubMed] [Google Scholar]
- Hafizur RM, Kabir N, Chishti S. Asparagus officinalis extract controls blood glucose by improving insulin secretion and β-cell function in streptozotocin-induced type 2 diabetic rats. Brit Jof Nutr. 2012;108:1586–1595. doi: 10.1017/S0007114511007148. [DOI] [PubMed] [Google Scholar]
- He WH, Liu X, Xu HG, Gong Y, Yuan F, Gao YX. On-line HPLC-ABTS screening and HPLC-DAD-MS/MS identification of free radical scavengers in Gardenia (Gardenia jasminoides E.) fruit extracts. Food Chem. 2010;123:521–528. doi: 10.1016/j.foodchem.2010.04.030. [DOI] [Google Scholar]
- He L, Xu HG, Liu X, He WH, Yuan F, Gao YX. Identification of phenolic compounds from pomegranate (Punica granatum L.) seed residues and investigation into their antioxidant capacities by HPLC-ABTS+ assay. Food Res Int. 2011;44:1161–1167. doi: 10.1016/j.foodres.2010.05.023. [DOI] [Google Scholar]
- He L, Zhang XF, Xu HG, Xu C, Yuan F, Knezb Z, Novak Z, Gao YX. Subcritical water extraction of phenolic compounds from pomegranate (Punica granatum L.) seed residues and investigation into their antioxidant activities with HPLC-ABTS•+ assay. Food Bioprod Process. 2012;90:215–223. doi: 10.1016/j.fbp.2011.03.003. [DOI] [Google Scholar]
- Hossain MB, Rai DK, Brunton NP, Martin-Dianac AB, Barry-Ryan C. Characterization of Phenolics Composition in Lamiaceae Spices by LC-ESI-MS/MS. J Agric Food Chem. 2010;19:10576–10581. doi: 10.1021/jf102042g. [DOI] [PubMed] [Google Scholar]
- Jang DS, Cuendet M, Fong HHS, Pezzuto JM, Kinghorn AD. Constituents of Asparagus officinalis evaluated for inhibitory activity against cyclooxygenase-2. J Agric Food Chem. 2004;52:2218–2222. doi: 10.1021/jf0305229. [DOI] [PubMed] [Google Scholar]
- Jing J, Chan CO, Xu LJ, Jin DP, Cao XW, Mok DK, Parekh HS, Chen S. Development of an in-line HPLC fingerprint ion-trap mass spectrometric method for identification and quality control ofRadix Scrophulariae. J Pharmaceut Biomed. 2011;4:830–835. doi: 10.1016/j.jpba.2011.07.032. [DOI] [PubMed] [Google Scholar]
- Jokić S, Velić D, Bilić M, BuCić-koJić A, PlANiNić M, ToMAS S. Modelling of the process of solid–liquid extraction of total polyphenols from soybeans. Czech J Food Sci. 2010;28:206–212. [Google Scholar]
- Jong TT, Lee MR, Chiang YC, Chiang ST. Using LC/MS/MS to determine matrine, oxymatrine, ferulic acid, mangiferin, and glycyrrhizin in the Chinese medicinal preparations Shiau-feng-saan and Dang-guei-nian-tong-tang. J Pharmaceut Biomed. 2006;2:472–477. doi: 10.1016/j.jpba.2005.07.036. [DOI] [PubMed] [Google Scholar]
- Karacabey E, Mazza G. Optimisation of antioxidant activity of grape cane extracts using response surface methodology. Food Chem. 2010;119:343–348. doi: 10.1016/j.foodchem.2009.06.029. [DOI] [Google Scholar]
- Kechinski CP, Guimaraes PVR, Norena CPZ, Tessaro IC, Marczak LDF. Degradation kinetics of anthocyanin inblueberry juice during thermal treatment. J Food Sci. 2010;75:C173–C176. doi: 10.1111/j.1750-3841.2009.01479.x. [DOI] [PubMed] [Google Scholar]
- Kitanović S, Milenović D, Veljković VB. Empirical kinetic models for the resinoid extraction from aerial parts of St. John’s wort (Hypericum perforatum L.) Biochem Eng J. 2008;41:1–11. doi: 10.1016/j.bej.2008.02.010. [DOI] [Google Scholar]
- Koleva II, Niederlander HAG, Van Beek TA. Application of ABTS radical cation for selective on-line detection of radical scavengers in HPLC eluates. Anal Chem. 2010;73:3373–3381. doi: 10.1021/ac0013610. [DOI] [PubMed] [Google Scholar]
- Li XY, Xie B, Guo WL, Guo RZ, Kou XH. Extraction and purification of asparagus oligosaccharides. Adv Mater Res. 2012;550:1886–1892. doi: 10.4028/www.scientific.net/AMR.550-553.1886. [DOI] [Google Scholar]
- Liyana-Pathirana C, Shahidi F. Optimization of extraction of polyphenols compounds from wheat using response surface methodology. Food Chem. 2005;93:47–56. doi: 10.1016/j.foodchem.2004.08.050. [DOI] [Google Scholar]
- Lu L, Song FR, Tsao R, Jin YR, Liu ZQ, Liu SY. Studies on the homolytic and heterolytic cleavage of kaempferol and kaempferide glycosides using electrospray ionization tandem mass spectrometry. Rapid Commun Mass Sp. 2010;24:169–172. doi: 10.1002/rcm.4368. [DOI] [PubMed] [Google Scholar]
- Mangesh DV, Vikesh GL, Virendra KR. Extraction of ursolic acid from Ocimum sanctum by ultrasound: process intensification and kinetic studies. Chem Eng Process. 2013;69:24–30. doi: 10.1016/j.cep.2013.01.011. [DOI] [Google Scholar]
- Meng DJ, Lu J, Fan W, Dong JJ. Optimization of extraction conditions for antioxidant phenolic compounds from malt rootlets using response surface methodology. J Food Biochem. 2009;33:291–305. doi: 10.1111/j.1745-4514.2009.00218.x. [DOI] [Google Scholar]
- Mullen W, Yokota T, Lean ME, Crozier A. Analysis of ellagitannins and conjugates of ellagic acid and quercetin in raspberry fruits by LC-MSn. Phytochemistry. 2003;64:617–624. doi: 10.1016/S0031-9422(03)00281-4. [DOI] [PubMed] [Google Scholar]
- Peleg M. An empirical model for the description of moisture sorption curves. J. Food Sci. 1988;53:1216–1217. doi: 10.1111/j.1365-2621.1988.tb13565.x. [DOI] [Google Scholar]
- Plazonić A, Bucar F, Maleš Ž, Mornar A, Nigović B, Kujundžić N. Identification and quantification of flavonoids and phenolic acids in Burr Parsley (Caucalis platycarpos L.) using high-performance liquid chromatography with diode array detection and electrospray ionization mass spectrometry. Molecules. 2009;14:2466–2490. doi: 10.3390/molecules14072466. [DOI] [PMC free article] [PubMed] [Google Scholar]
- Prior RL, Wu L, Schaich K. Standardized methods for the determination of antioxidant capacity and phenolics in foods and dietary supplements. J Agric Food Chem. 2005;10:4290–4302. doi: 10.1021/jf0502698. [DOI] [PubMed] [Google Scholar]
- Re R, Pellegrini N, Proteggente A, Pannala A, Yang M, Rice-Evans C. Antioxidant activity applying an improved ABTS radical cation decolorization assay. Free Radic Bio Med. 1999;26:1231–1237. doi: 10.1016/S0891-5849(98)00315-3. [DOI] [PubMed] [Google Scholar]
- Robbins RJ. Phenolic acids in foods: an overview of analytical methodology. J Agric Food Chem. 2003;51:2866–2887. doi: 10.1021/jf026182t. [DOI] [PubMed] [Google Scholar]
- Rodríguez R, Jaramillo S, Guillén R, Jiménez A, Fernández-Bolaños J, Heredia A. Cell wall phenolicss of white and green asparagus. J Sci Food Agric. 2005;85:971–978. doi: 10.1002/jsfa.2053. [DOI] [Google Scholar]
- Shi J, Nawaz H, Pohorly J, Mittal G, Kakuda Y, Jiang Y. Extraction of polyphenols from plant material for functional foods engineering and technology. Food Rev Int. 2005;21:139–166. doi: 10.1081/FRI-200040606. [DOI] [Google Scholar]
- Sun T. Evaluation of the antioxidant activity of asparagus, broccoli and their juices. Food Chem. 2007;105:101–106. doi: 10.1016/j.foodchem.2007.03.048. [DOI] [Google Scholar]
- Tsao R, Deng Z. Separation procedures for naturally occurring antioxidant phytochemicals. J Chromatogr B. 2004;812:85–99. doi: 10.1016/S1570-0232(04)00764-0. [DOI] [PubMed] [Google Scholar]
- Türker N, Erdoğdu F. Effects of pH and temperature of extraction medium on effective diffusion coefficient of anthocyanin pigments of black carrot (Daucus carota var. L.) J Food Eng. 2010;76:579–583. doi: 10.1016/j.jfoodeng.2005.06.005. [DOI] [Google Scholar]
- Wang MF, Tadmor Y, Wu QL, Chin CK, Garrison SA, Simon JE. Quantification of Protodioscin and Rutin in Asparagus Shoots by LC/MS and HPLC Methods. J Agric Food Chem. 2003;51:6132–6136. doi: 10.1021/jf0344587. [DOI] [PubMed] [Google Scholar]
- Yang L, Jiang JG, Li WF, Chen J, Wang DY, Zhu L. Optimum extraction process of polyphenols from the bark of Phyllanthus emblica L. based on the response surface methodology. J Sep Sci. 2009;32:1437–1444. doi: 10.1002/jssc.200800744. [DOI] [PubMed] [Google Scholar]
- Zhao QS, Kennedy JF, Wang XD, Yuan XF, Zhao B, Peng YS, Huang YX. Optimization of ultrasonic circulating extraction of polysaccharides from Asparagus officinalis using response surface methodology. Int J Biol Macromol. 2011;49:181–187. doi: 10.1016/j.ijbiomac.2011.04.012. [DOI] [PubMed] [Google Scholar]
- Zhao QS, Xie BX, Yan J, Zhao FC, Xiao J, Yao LY, Zhao B, Huang YX. In vitro antioxidant and antitumor activities of polysaccharides extracted from Asparagus officinalis. Carbohyd Poly. 2012;1:392–396. doi: 10.1016/j.carbpol.2011.07.068. [DOI] [PubMed] [Google Scholar]