Abstract
Oscillatory and steady shear rheology of gellan (G) and dextran (D) solution individually, and in blends (G/D ratio 1:1, 1:2, and 1:3 w/v) with a total hydrocolloid concentration of 3 % (w/v) were studied at 25 °C. Individually, 1.5 % dextran and 1.5 % gellan in solution exhibited Newtonian and non-Newtonian behavior, respectively. A blend of equal proportion of dextran and gellan (G/D = 1:1) exhibits a distinct gel point (G′ = G″), and further addition of dextran in the blend (G/D = 1:2 and 1:3) resulted predominating liquid-like (G″ > G′) behavior. A plot of G′ vs G″ distinctly showed the gradual transition of the blend. Shear stress (τ)-shear rate () data fitted well the Herschel–Bulkley model. The G/D blend exhibited shear thinning behavior with flow behavior index less than unity. The Cox–Merz rule did not fit well for the complex shear viscosity (η*) and apparent viscosity (η) of the blend.
Keywords: Gellan, Dextran, Oscillatory rheology, Complex viscosity, Cox–Merz rule, Herschel-Bulkley
Introduction
Gellan is an extracellular bacterial polysaccharide produced by fermentation of Sphingomonas elodea (ATCC31461) (Pollock 1993), and has commercial significance (Sanderson 1990). It is a linear anionic polymer consists of tetrasaccharides repeat units of D-glucose, D-glucuronic acid and α-L-rhamnose in the molar ratios of 2:1:1 (Ikeda et al. 2004; Banik and Santhiagu 2006). The deacylated polymer is known generically as “gellan gum” or by the proprietary names of Kelcogel (food-grade) or Gelrite (for non-food applications) (Morris et al. 2012). In the food and pharmaceutical industries, gellan is used as a stabilizing, gelling, film-forming, encapsulating agent and drug delivery vehicle (Coviella et al. 2007; León et al. 2008; Kiani et al. 2010). In addition, gellan has been used in enzyme and cell immobilization and gel electrophoresis (Prajapati et al. 2013). Gellan gum forms thermoreversible physical gels at concentrations remarkably lower than other hydrocolloids such as carrageenans, alginate, pectin or gelatin when hot solutions are cooled in the presence of gel-promoting cations (Caggioni et al. 2007; Pérez-Campos et al. 2012). Gellan gum undergoes a disorder–order coil-helix transition during the cooling of the hot solution. It is reported that gellan molecules take double helical conformations in solutions at lower temperatures, and above a certain critical concentration, they form aggregates which play a role of junction zones to result a three dimensional network (Morris et al. 2012). The thermo-reversible sol–gel transition is, however, controlled by temperature, pH, presence of metal ions etc. Gellan gum forms a reversible temperature-dependent gel individually however introduction of divalent cations such as Ca++ or Mg++ promotes the gelation of aqueous solutions of gellan gum substantially (Pérez-Campos et al. 2012).
Dextran is another bacterial polysaccharide with high water solubility produced from sucrose by extracellular dextransucrases. Mostly dextrans are derived from the bacteria Leuconostoc mesenteroides, strain B-512F and contain a backbone of consecutive α-1,6 linkages, with the remaining being branched α-1,3 linkages (Tirtaatmadja et al. 2001). Dextran has commercial applications in the pharmaceutical industry particularly in drug released system which includes blood plasma expander and as an intravenous fluid (lubricant) of eye drop solution (Bhavani and Nisha 2010). Recent finding in human tissue engineering by Fathi et al. (2011) has a great potential when interaction of polyvinyl alcohol (PVA) and dextran was found compatible. Similar promising outcome also found by Wang et al. (2012) through interaction of gelatin and dextran although gelatin may cause religious and health concern among certain group of consumers (Karim and Bhat 2008). Dextran is not very popular in food applications since in solutions it is not as viscous as other polysaccharides, and also for its inability to form gels therefore new applications in the food industry are being explored.
Rheological properties of hydrocolloids are very important for applications and handling of food products including food product development, process design, and selection of the process equipment. Rheological measurements have also been considered as an analytical tool to provide fundamental insights on the structural organization of food (Ahmed et al. 2005). It is well established now, the aqueous system of gellan changes from solution to gel due to the coil-to-helix transition of gellan molecules and the subsequent aggregation of the helices (Garcia et al. 2011). Rheological properties of aqueous and concentrated gellan solutions with different polymer concentration and solution temperature have been studied extensively. Variation of coil-helix (Tch = 20 to 43 °C) and sol–gel (Tsg = 9.4 to 43 °C) transition temperature of Na+ gellan was found to be systematically increased with increasing concentration (0.5 to 4.5 %) (Miyoshi and Nishinari 1999). Another study performed by Jampen et al. (2000) found that the aqueous system of gellan (0.5 %) exhibited the non-Newtonian behavior and followed the power law model at low temperature (5–20 °C) in solutions. However, the concentrated gellan solutions (1.5 and 2 %) showed Newtonian behavior at high temperature (45 °C). This indicated that the behavior of gellan influenced by both temperature and concentration. In the presence of calcium ions, the elasticity of dilute gellan solutions was increased as function of calcium ion concentration (Pérez-Campos et al. 2012). Rheological measurement of commercial dextran solutions indicated those fluids follow Newtonian behavior with molecular weight ranging from 71,500 to 531,000 and concentrations up to 30 wt.%. Above 30 %, dextran does not form gel but formed entanglements as concentration increased (Carrasco et al. 1987; Ioan et al. 2001; Icoz et al. 2005).
Numerous investigations on rheological behaviors of gellan and dextran and their blends with other biopolymers have been studied as there is an increasing demand for gellan–based polymers for food and non-food applications. Interaction of gellan with various biopolymers including gelatin (Fonkwe et al. 2003), calcium alginate (Papageorgiou et al. 1994) kappa carrageenans (Nishinari et al. 1996) and inulin (Evageliou et al. 2010) have been reported. These studies provide information on in/compatibility, interactions and network formation, synergistic/antagonistic effects between biopolymers. This interaction related closely to food product stability and mouth-feel properties as those are crucial consumer’s perception towards food products. Through oscillatory and steady shear measurement, it is important to understand the character of the food ingredient we want to choose before designing a food product. Although dextrans do not form gels, they do interact in semi-dilute solution to form aggregates, and the presence of these aggregates should be apparent in the rheological properties of the solutions. The gellan/dextran blend system could be used in various food industry applications such as stabilizing agent in yogurt as gellan acts an excellent gelling agent (Prajapati et al. 2013) in low concentration and dextran has been found to delay ice crystal growth although dextran produced unfavorable firmness and melting characteristic of frozen dairy products (McCurdy et al. 1994). Considering the potential of many industrial applications of gellan and dextran blend in aqueous media, the objective of the present work was to investigate the influence of dextran concentration on steady flow and oscillatory rheology of low-acyl gellan in solution.
Materials and methods
Material
Commercial dextran (D1662, Mw 35,000–45,000) and deacylated gellan (Gelzan™ G1910; Fw = 1,000 kg/mol) were purchased from Sigma-Aldrich (St. Louis, Missouri, USA). The commercial form of deacylated gellan and dextran without further purification was used to give a true representation of its behavior in industrial applications.
Proximate analysis
Moisture, ash, protein and lipid contents of hydrocolloid sample were determined according to the AOAC methods (2005). Crude protein contents were measured by Kjeldahl method and a conversion factor of 6.25 was used for calculating nitrogen to crude protein content.
Preparation of gellan–dextran mixtures
Blend hydrogel samples were prepared according to the method described by Meena et al. (2009). Gellan (1.5 g) and dextran (1.5 g) was dissolved in distilled water (100 ml) under magnetic stirring at 90 °C for gellan and 25 °C (room temperature) for dextran for 1 h. Both solutions were then autoclaved at 120 °C for 20 min. Three blended samples [gellan to dextran ratio 1:1 1:2 and 1:3 (w/v) or 50, 66.66 and 75 wt.% dextran] were prepared by mixing the required volumes of gellan and dextran in a microwave oven (1,000 W; Samsung, South Korea) at 90 °C for 120 s. The total polysaccharide concentration was kept constant at 3 wt.% level. It could be reasoned that at higher concentration level the resultant gel becomes hard, and therefore, the concentration level above 1.5 % each was not considered. This concentration range is also used by other studies which investigating the potential use of polysaccharides (for gelatin replacement) as yogurt stabilizer (Tamine and Robinson 1999; McCann et al. 2011). The resulting solution were stored at room temperature (25 °C) for 15 min to obtain soft to semi-solid gels. In this study, ambient temperature (25 °C) was maintained throughout the study to represent true exposure temperature for most food materials.
Rheological measurement
Steady and dynamic rheological measurements of gellan-dextran mixture were carried out using a AR-G2 rheometer (TA Instruments, West Sussex, England) equipped with a heating circulator (Julabo, model F12, Germany). A cone and plate geometry (60 mm diameter, 1° angle) was used for the measurement. The width of the gap between two plates was 31 μm. Approximately 1 ml of sample was transferred to the center of the peltier plate for 5 min for complete temperature equilibration. A platinum resistance thermometer (PRT) sensor is positioned in the middle of the lower sample plate and ensures accurate sample temperature measurement (25 ± 0.1 °C). The geometry plates were then lowered approaching Peltier plate, pressed the sample and excess sample at the edge of the geometry plate was truncated to avoid inaccurate reading. The periphery of the samples was covered with a thin layer of paraffin oil to avoid evaporation during the experiment. Small-amplitude oscillatory strain sweep experiments were performed to determine the limit of the linear visco-elastic region (LVR). The LVR was tested for the studied temperature, and the measurement was carried out accordingly. Furthermore, the frequency sweep tests (0.01–10 Hz) of individual and blended samples were carried out in the linear regime, at constant strain (0.03). All rheological measurements were carried out in triplicate and rheological parameters (elastic modulus, G′; viscous modulus, G″ and complex viscosity, η*) were obtained directly from the manufacturer supplied computer software (TRIOS, TA Instruments, West Sussex, England). For steady flow measurement the rheometer was programmed for shear changing from 0.1 to 1,000 s−1 at 25 °C. Rheological parameters (shear stress, shear rate, apparent viscosity) were obtained from the software. All rheological data presented herein were means of three replicate measurements. The deviation did not exceed 5 % between duplicate runs, as the experiment was repeated. The average of the triplicate runs was reported as the measured value.
Statistical analysis
The data reported are mean of triplicate observations. The data were subjected to statistical analysis using Minitab Release 14 Statistical Software (Minitab Inc., State College, Pennsylvania, USA). Results were analyzed using analysis of variance (ANOVA) and Tukey’s HSD significance test. Results were considered statistically significant when p < 0.05.
Results and discussion
Proximate analysis
The analysis indicated that the gellan sample contained 36.58 ± 0.15 % moisture, 0.05 % ash, 1.62 ± 0.33 % protein and 3.78 ± 0.95 % lipid. Dextran contained 46.06 ± 0.09 % moisture, 0.86 ± 0.29 % crude protein, 4.61 ± 1.67 % crude fat and 0.001 ± 0.00 % ash content.
Rheological properties
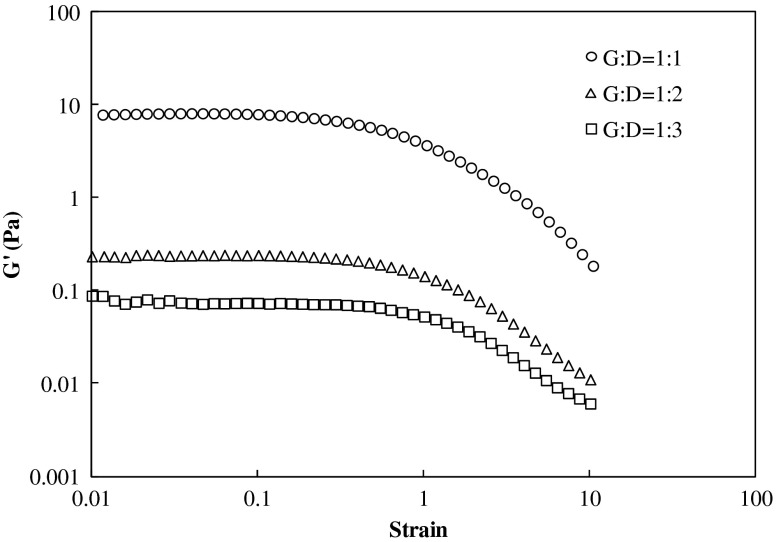
Strain sweep tests were conducted at 1 Hz to estimate the linear visco-elastic range (LVR) in oscillatory shear for each hydrocolloid individually and also in blends (1:1; 1:2 and 1:3 w/v). Figure 1 illustrates the typical response shown by all three gellan/dextran blends. The non-linear response was markedly observed by decreased storage modulus (G′) which corresponds to critical strain amplitude of each sample. The average critical strain showed was approximately 0.1, and the value was used throughout the experiments.
Fig 1.
Determination of the dynamic linear visco-elastic range of gellan-dextran blend
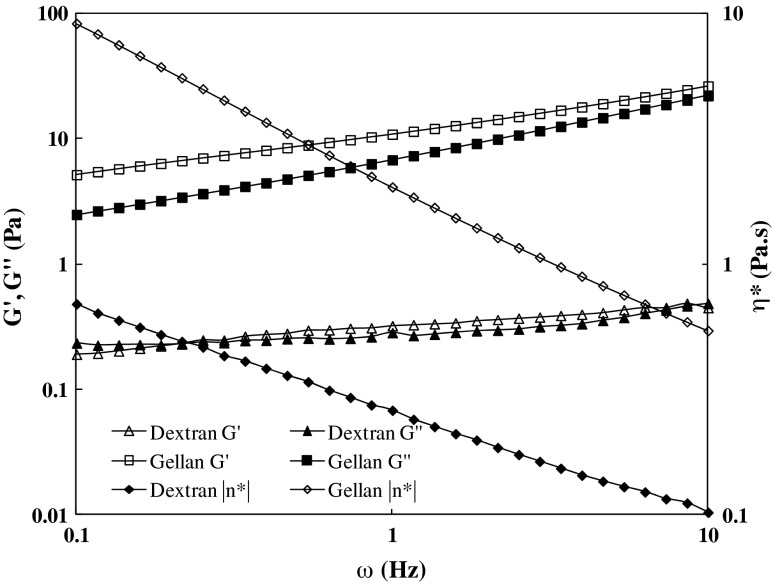
The mechanical spectra of 1.5 % gellan and 1.5 % dextran solutions at 25 °C are shown in Fig. 2. Both hydrocolloids in solution display an increase in elastic modulus (G′) and viscous modulus (G″) with frequency whereas the complex viscosity (η*) decreased with an increase in frequency. The neat gellan sample showed significantly higher gel rigidity (G′ > G″) and exhibiting its gel nature. Formation of a continuous gel network happens only while the polymer concentration (C) reaches a minimum critical value, Co. It seems 1.5 % gellan concentration was above the critical limit and, therefore, forms a gel. The gel formation may be attributed by weak junction zones consisting of aggregates of double helices (Ross-Murphy 2008). The higher G′ of gellan sample was mainly contributed by the conformational transition from a disordered conformation (coil) to an ordered conformation (helix), and helices aggregation. The complex viscosity of gellan sample was significantly higher (1 to 2 log cycles) than that of dextran and confirming more viscoelastic nature. For 1.5 % dextran solution, the G′ was slightly edge over G″ in the studied frequency range which infers that dextran behaved like a typical macromolecular entangled biopolymer. Further, a distinct gel point (cross-over of G′ and G″) was observed at 0.18 Hz for dextran solution. Similar cross-over was earlier reported by Padmanabhan et al. (2003) for dextran solution. Authors advocated that the entanglement network shown by dextran sample is different from cross-linked network and physical gels.
Fig 2.
Mechanical spectra of 1.5 % gellan and 1.5 % dextran solutions at 25 °C
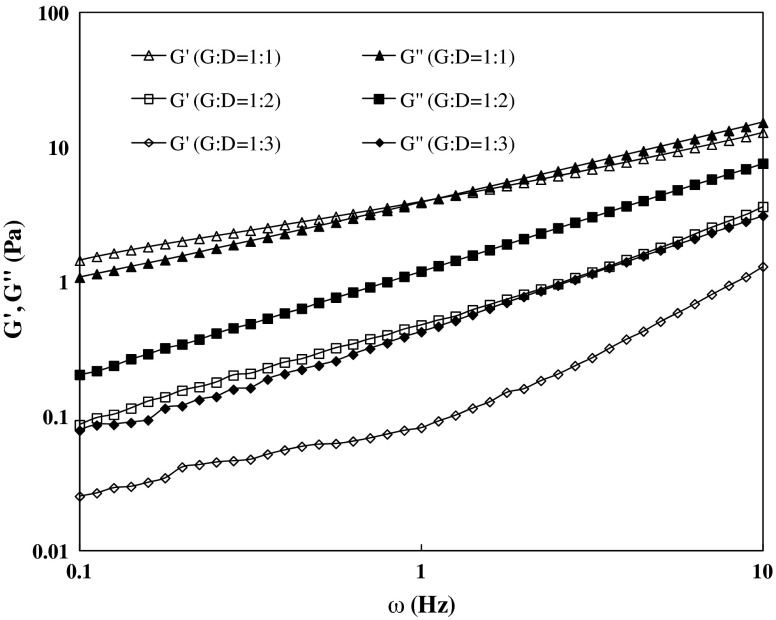
Effect of dextran proportion on the mechanical strength of G/D blending is illustrated in Fig. 3. When solutions of two biopolymers are mixed, interactions between their chains depend on the balance between the enthalpy and the entropy changes on mixing, being, therefore, either favorable (association) or unfavorable (segregation) (Dickinson 2003). With addition of equal concentration of gellan to dextran (G/D = 1:1 ratio), a gel point was detected at 0.79 Hz, which was absent in neat gellan sample as shown in Fig. 2. A similar gel point (sol–gel transition) of 2.5 % gellan was earlier reported at about 26 °C gellan (Miyoshi and Nishinari 1999). It is believed that at higher frequencies, where there is less time for disentanglement, the predominant response to oscillatory strain becomes elastic distortion of the entangled network, and the mechanical spectra become similar to those observed for gels (Morris et al. 2012). Both dynamic moduli of blended sample decreased abruptly from the control gellan sample whereas an increase was recorded with respect to dextran sample. The rheogram further indicates that there is an interaction between two hydrocolloids, and addition of dextran facilitates the lowering dynamic moduli by working as plasticizer in the blend. Almost all biopolymer mixtures exhibit segregate interactions, unless there is an electrostatic drive to association. These usually result in phase separated networks where the components tend to exclude each other from their domains (Evageliou et al. 2010). The G/D ratio of 1:1 seems to be a critical minimum concentration ratio for the blend gelation. Further increase in dextran concentration (1:2 and 1:3) dropped the dynamic moduli and the blend exhibited predominating liquid-like properties (G″ > G′). The G′ dropped dramatically in 1:3 G/D blend even lower than that of neat dextran irrespective of presence of 25 % gellan. Blending of dextran into gelatin showed that small amounts of dextran led to a large increase in the rate of conformational ordering of gelatine and affects the mechanical properties of the resulting gels (Schacht et al. 1997).
Fig 3.
Mechanical spectra of blended gellan and dextran solutions at 25 °C
The viscoelastic nature of the gel was well described by calculated slopes of the linear regression of the power-type relationship of ln ω vs ln G′ (Eq. 1) and ln ω vs ln G″ (Eq. 2) which are commonly used to predict the solid-like and liquid-like characteristics of polymers, respectively (Table 1).
| 1 |
| 2 |
Table 1.
Effect of different ratio on slope (n 1, n 2) and intercept (A 1, A 2) parameters at 25 °C as determined from Eqs. (1) and (2)
| Sample type | Slope (n 1) | Intercept (A 1) | R 2 | Slope (n 2) | Intercept (A 2) | R 2 |
|---|---|---|---|---|---|---|
| 1.5 % gellan | 0.35 ± 0.01a | 11.1 ± 0.01a | 0.99 | 0.47 ± 0.01a | 6.98 ± 0.01a | 0.99 |
| G/D = 1:1 | 0.46 ± 0.01a | 1.67 ± 0.08a | 0.99 | 0.58 ± 0.00a | 1.30 ± 0.06a | 0.99 |
| G/D = 1:2 | 0.78 ± 0.05a | 0.16 ± 0.05b | 0.99 | 0.79 ± 0.07b | 0.32 ± 0.03b | 0.99 |
| G/D = 1:3 | 0.81 ± 0.13a | 0.04 ± 0.01b | 0.95 | 0.82 ± 0.04b | 0.07 ± 0.06c | 0.99 |
In columns, averages followed by different letters are significantly different (p ≤ 0.05)
Where n1 and n2 are the slope (dimensionless) and A1 and A2 are the intercept (Pa.sn). Generally a true gel is characterized by a zero slope of the power law model (Ross-Murphy 1984). The magnitudes of slopes for Eqs. (1) and (2) are ranged between 0.35 and 0.82 which clearly indicating transformation of solid-like character to liquid-like character with blending with dextran or plasticization. Earlier Dai et al. (2008) reported similar range of slopes (0.38 to 0.77) for commercial gellan (Gelrite) in water. Variation of slope with concentration appears to be confined to polymers that form “physical gels” by co-operative noncovalent association, and may reflect departure from the random growth of network structure that occurs on chemical (covalent) crosslinking and is assumed in theoretical models that predict “universal” values of slope (Morris et al. 2012).
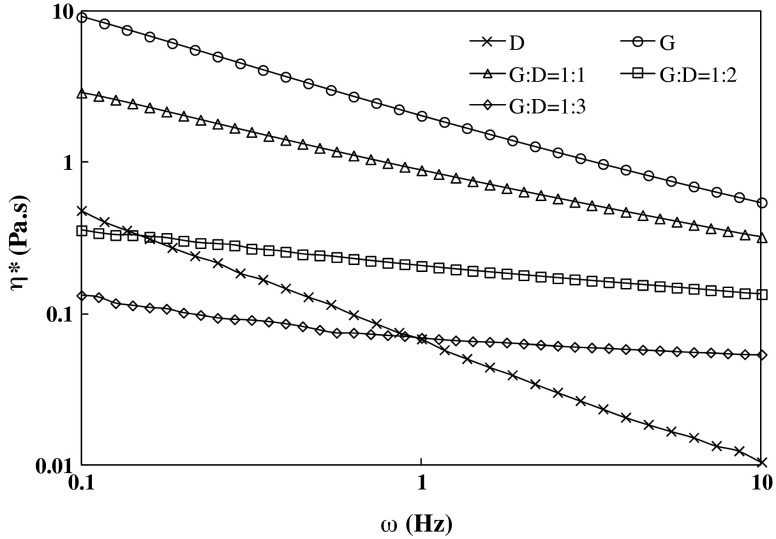
The frequency-dependence of η* of individual and blended samples is illustrated in Fig. 4. The complex viscosity decreased systematically as frequency was increased from 0.1 to 10 Hz for all samples except two blends (1:2 and 1:3) where η* exhibited almost frequency dependency. This study confirms the lowering of gellan viscosity by addition of dextran. Similar lowering of viscosity was earlier observed for a blend of xanthan and Arabic gum (Ahmed et al. 2005) compared to individual gums. An attempt was made to correlate the complex viscosity data obtained experimentally and calculated value for different combinations based on individual hydrocolloid at 1 Hz (Eq. 3), although the calculated value was significantly higher than that of experimental values.
| 3 |
| 4 |
Fig 4.
Frequency dependence of complex viscosity for gellan, dextran and blended solutions at 25 °C
Where ηblend th is the combined η value obtained from individual hydrocolloid at 1 Hz and at 1.5 % (w/v); g and d represents gellan and dextran; x and y are hydrocolloid fraction used in the blend; and ηexp is the value obtained directly from the rheometer. The experimental and theoretical values fitted well, and showed a linear relationship (Eq. 4) (R2 = 0.99).
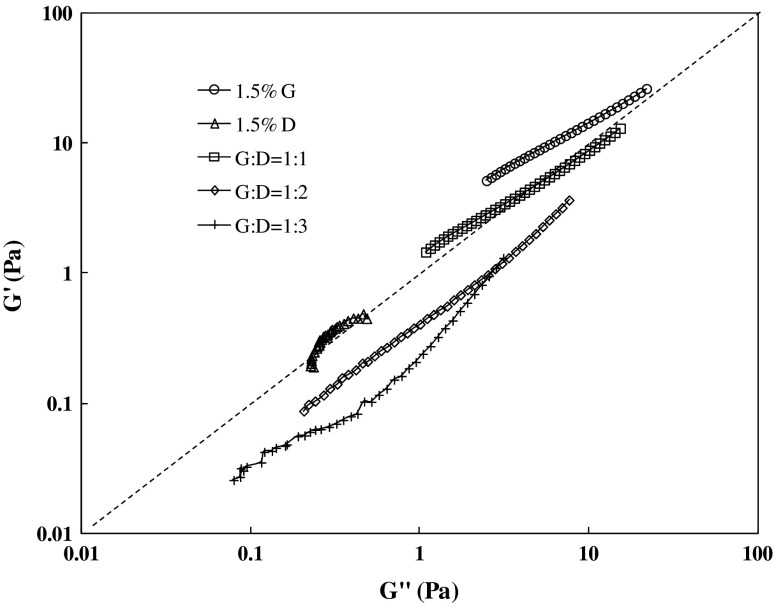
The change in microstructure during blending of hydrocolloids in different proportions can be described by a plot of G′ vs. G″ at a given temperature. Slopes of the G′ vs. G″ curves were used as an indication of change in morphology of polymer and nanocomposite blends (Liu and Chen 2008; Al-Saleh and Sundararaj 2010; Ahmed et al. 2012). Figure 5 shows a plot of G′ versus G″ as function of G/D blend concentration. It is evident from Fig. 5 that the curves for blends do not superimpose with each other which indicates that the blend forms different structures after blending. The curves moved gradually from predominating G′ to G″ with increase in dextran concentration in the blend. The blend containing equal proportion of gellan and dextarn by showing predominating solid-like characteristics and the curve lies above the border line of G′ vs. G″. It is evident from the curves that slopes decreased from 0.79 to 0.37 with increase in dextran concentration. This shift and the change in the slope of the curves of G′ versus G″ also indicate that, with the addition of the plasticizer like dextran, the microstructure of these blends changes significantly. It further implies that the sample is really rheologically heterogeneous.
Fig 5.
G′ as a function of G″ for gellan and dextran blending with different concentration at 25 °C
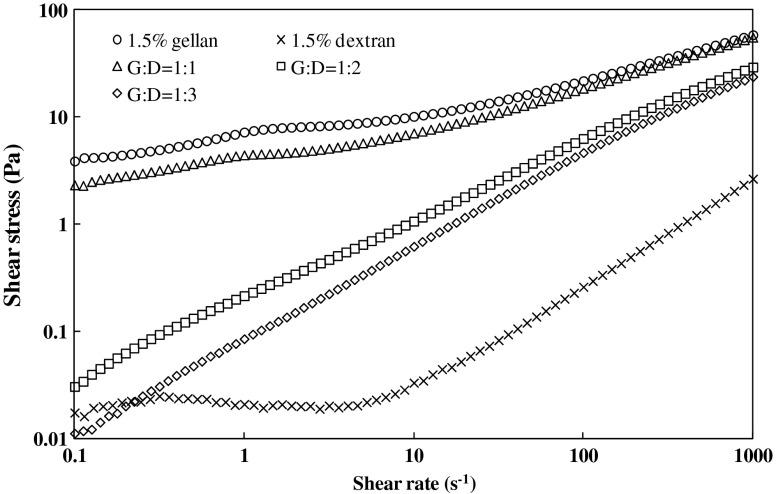
Shear stress (τ)-shear rate () curves for neat and blended hydrocolloid samples are shown in Fig. 6. The flow behavior of gellan and dextran individually and in blend solution was fitted by the Herschel–Bulkley model (Eq. 5) and rheological parameters are presented in Table 2. In all samples, the coefficient of determination (R2); was not lower than 0.97, while the standard errors (SE) were lower than 10 (according to the software the SE value less than 20 is adequate for model fitting). All samples showed a distinct yield stress (τ0) although the magnitude for dextran is too small (although it was detected due to strong sensitivity of the instrument) which is 5.99 × 10⁻³ Pa. The maximum value of τ0 (4.44 Pa) was recorded for 1.5 % gellan and it decreased systematically with an increase in dextran concentration. The least τ0 value (0.1 Pa) was obtained at G/D ratio of 1:3. Following the trend, a significant decrease is observed in the consistency index (K) and an increase in flow behavior index (n). The 1.5 % dextran exhibited Newtonian behavior with the flow behavior index of unity. A blending of gellan (n = 0.49) and dextran (n = 1.0) resulting increase in n values systematically and the highest value was observed for G/D ratio of 1:3.
| 5 |
Fig 6.
Shear stress-shear rate plot for gellan and dextran blends at 25 °C
Table 2.
Herschel-Bulkley model parameters for individual hydrocolloid and combinations
| Sample type | τo (Pa) | K (Pa.sn) | n (−) | R2 |
|---|---|---|---|---|
| 1.5 % gellan | 4.44 ± 0.00b | 1.85 ± 0.00b | 0.49 ± 0.01a | 0.99 |
| 1.5 % dextran | 5.99 × 10⁻³ ± 0.05b | 3.18 × 10⁻³ ± 0.05b | 1.0 ± 0.00b | 0.97 |
| G:D = 1:1 | 2.25 ± 0.00b | 1.63 ± 0.83a | 0.51 ± 0.00b | 0.99 |
| G:D = 1:2 | 0.20 ± 0.00b | 0.35 ± 0.05b | 0.66 ± 0.00b | 0.99 |
| G:D = 1:3 | 0.10 ± 0.00b | 0.20 ± 0.00b | 0.70 ± 0.01c | 0.98 |
In columns, different letters are significantly different (p ≤ 0.05)
Where τ is the shear stress (Pa), K is the consistency index (Pa.sn), n is the flow behavior index (−) and is the shear rate (s−1). The shear thinning behavior of G/D blends might be due to modifications in macromolecular arrangement which represent an irreversible structural break down. Thus molecular orientation that takes place within such substance resulted in decrease of inner friction hence lowering the viscosity (Koocheki et al. 2009). Similar shear thinning effect was already observed in semi-dilute dextran solution produced by Leuconostoc mesenteroides NRRL B-640 (Purama et al. 2009) and also in gellan produced by Pseudomonas elodea. However, the gellan sample showed less shear thinning behavior since it does not contain side chains in the backbone structure (Morris et al. 2012). Shear thinning hydrocolloids are extensively used to improve or modify food texture. The reduction in solution viscosity provides processing advantage during high-shear processing operations such as pumping and filling whereas the high apparent viscosity gives desirable mouth feel properties (Marcotte et al. 2001). From these observations, it was found that the viscosity and pseudoplasticity of gellan/dextran mixture was greatly influenced by different ratio applied.
Applicability of Cox–Merz rule between steady shear and oscillation
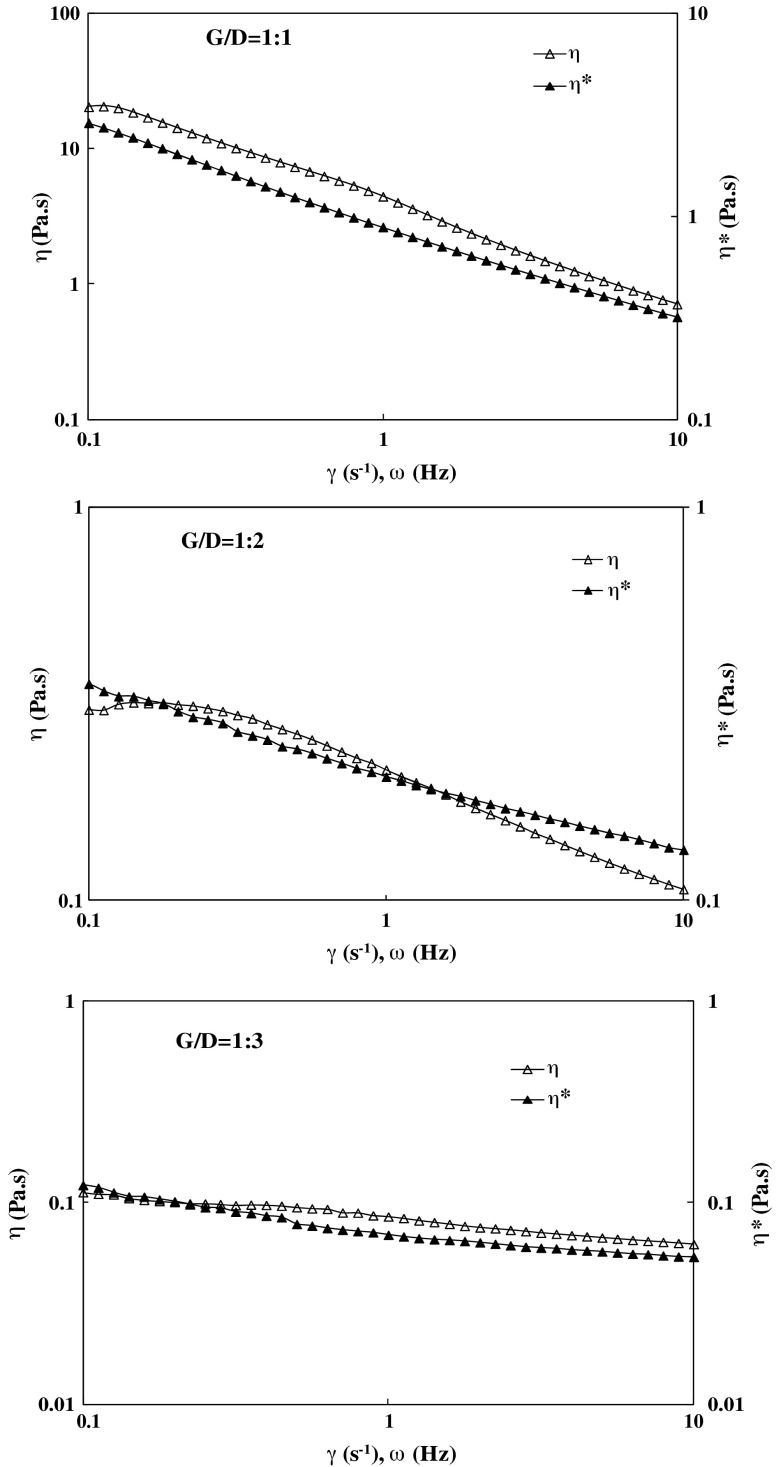
The empirical Cox–Merz rule (Cox and Merz 1958) states that the magnitudes of the complex viscosity (η*) and the steady shear viscosity (η) must be superimposed at equal values of frequency and shear rate (Eq. 6). Figure 7 illustrates that the Cox–Merz rule does not fit η and η* plotted at equivalent values of shear rate (0.1–10 s−1) and frequency range (0.1–10 Hz) for G/D ratio of 1:1 however partially fits for higher dextran concentration in the blend (G/D = 1:2 and 1:3). Parallel dependencies of η on shear rate and η* on frequency are obtained with the values of η higher than the η* values from continuous shear ramps for G/D of 1:1. Similar violation of the Cox-Merz rule has been observed for “weak gels” of ordered xanthan (Richardson and Ross-Murphy 1987). The partial applicability of Cox-Merz rule (especially lower shear range 0.1 to 1 Hz/s−1) for G/D blends 1:2 and 1:3 is probably due to dilution/plasticization by low viscous dextran. It is believed that gellan solutions form gels above a critical concentration and the junction zones are believed to consist of aggregates of double helical gellan molecules. During addition of further dextran (e.g. 1:2 and 1:3), the helical conformations of gellan molecules gradually transforms to coil conformations since the number of helices is not sufficient to prevail a whole space, and to form a three dimensional network at lower concentration. Therefore, the mechanical spectra show a typical behavior for dilute polymer solutions and partially superimpose in the blends (1:2 and 1:3).
Fig. 7.
Applicability of Cox-Merz rule for gellan and dextran blends at 25 °C
The rheological properties of the investigated systems differ from those of the polymer solutions and are more similar to those of the structured systems.
| 6 |
where η and η* are steady shear viscosity and complex viscosity respectively, k is constants decided experimentally.
Conclusions
The study was focused on the oscillatory and steady flow rheological characteristics of selected blend of gellan and dextran which could be beneficial for development of designed food product. Individually, dextran was found to be a Newtonian fluid and gellan shows predominating solid-like characteristics. During blending, dextran plays a significant role and transforms the solid-like characteristics to liquid-like behavior with an increase in dextran concentration in the blend. The steady flow behavior is well characterized by the Herschel-Bulkley model with definite yield stress. The flow behavior index increased and the consistency constant decreased with addition of dextran in the blend. Steady shear data supported oscillatory measurements and revealed that the blend sample exhibited shear thinning behavior with flow index less than unity. Steady shear viscosity and complex viscosity of the blend samples did not fit the Cox–Merz rule adequately however; dextran incorporation has influence on the partial fitting of the empirical equation.
Acknowledgments
The authors express their gratitude to Rosmawati Jaaper for technical support and Universiti Putra Malaysia under Fundamental Research Grant Scheme (FRGS) (Vot no. 5524053) for financial support.
References
- Ahmed J, Ramasamy HS, Ngadi O. Rheological characteristics of Arabic gum in combination with guar and xanthan gum using response surface methodology: effect of temperature and concentration. Int J Food Prop. 2005;8:179–192. doi: 10.1081/JFP-200060234. [DOI] [Google Scholar]
- Ahmed J, Auras R, Kijachavengkul T, Varshney SK. Rheological, thermal and structural behavior of poly(ε-caprolactone) and nanoclay blended films. J Food Eng. 2012;111:580–589. doi: 10.1016/j.jfoodeng.2012.03.014. [DOI] [Google Scholar]
- Al-Saleh MH, Sundararaj U. Processing-microstructure-property relationship in conductive polymer nanocomposites. Polymer. 2010;51(12):2740–2747. doi: 10.1016/j.polymer.2010.03.022. [DOI] [Google Scholar]
- AOAC . Official methods of analysis of AOAC International. 18. Arlington: Association of Official Analytical Chemist; 2005. [Google Scholar]
- Banik RM, Santhiagu A. Improvement in production and quality of gellan gum by Sphingomonas paucimobilis under high dissolved oxygen tension levels. Biotechnol Lett. 2006;28(17):1347–1350. doi: 10.1007/s10529-006-9098-3. [DOI] [PubMed] [Google Scholar]
- Bhavani A, Nisha J. Dextran—the polysaccharides with versatiles uses. Int J Pharma Biosci. 2010;1:569–573. [Google Scholar]
- Caggioni M, Spicer PT, Blair DL, Lindberg SE, Weitz DA. Rheology and microrheology of a microstructured fluid: the gellan gum case. J Rheol. 2007;51(5):851–865. doi: 10.1122/1.2751385. [DOI] [Google Scholar]
- Carrasco F, Chornel E, Overend RP. Thermomechanical depolymerization of dextrans in aqueous phase. J Appl Polym Sci. 1987;34:153–165. doi: 10.1002/app.1987.070340113. [DOI] [Google Scholar]
- Coviella T, Matricardi P, Marianecci C, Alhaique F. Polysaccharide hydrogels for modified release formulations. J Control Release. 2007;119(1):15–24. doi: 10.1016/j.jconrel.2007.01.004. [DOI] [PubMed] [Google Scholar]
- Cox WP, Merz EH. Correlation of dynamic and steady state flow viscosities. J Polym Sci. 1958;28:619–622. doi: 10.1002/pol.1958.1202811812. [DOI] [Google Scholar]
- Dai L, Liu X, Liu Y, Tong Z. Concentration dependence of critical exponents for gelation in gellan gum aqueous solutions upon cooling. Eur Polym J. 2008;44:4012–4019. doi: 10.1016/j.eurpolymj.2008.09.032. [DOI] [Google Scholar]
- Dickinson E. Hydrocolloids at interfaces and the influence on properties of dispersed systems. Food Hydrocoll. 2003;17:25–39. doi: 10.1016/S0268-005X(01)00120-5. [DOI] [Google Scholar]
- Evageliou V, Tseliou G, Mandala I, Komaitis M. Effect of inulin on texture and clarity of gellan gels. J Food Eng. 2010;101(4):381–385. doi: 10.1016/j.jfoodeng.2010.07.023. [DOI] [Google Scholar]
- Fathi E, Atyabi N, Imani M, Alinejad Z. Physically crosslinked polyvinyl alcohol-dextran xerogels: morphology and thermal behavior. Carbohydr Polym. 2011;84:145–152. doi: 10.1016/j.carbpol.2010.11.018. [DOI] [Google Scholar]
- Fonkwe LG, Narishman G, Cha AS. Characterization of gelation time and texture of gelatin and gelatin–polysaccharide mixed gels. Food Hydrocoll. 2003;17(6):871–883. doi: 10.1016/S0268-005X(03)00108-5. [DOI] [Google Scholar]
- Garcia MC, Alfaro MC, Calero N, Munoz J (2011) Influence of gellan gum concentration on the dynamic viscoelasticity and transient flow of fluid gels. Biochem Eng J 55:73–81
- Icoz DZ, Moraru CI, Kokini JL (2005) Polymer–polymer interactions in dextran systems using thermal analysis. Carbohydr Polym 62(2):120–129
- Ikeda S, Nitta Y, Kim BS, Temsiripong T, Pongsawatmanit R, Nishinari K. Single-phase mixed gels of xyloglucan and gellan. Food Hydrocoll. 2004;18:669–675. doi: 10.1016/j.foodhyd.2003.11.005. [DOI] [Google Scholar]
- Ioan CE, Aberle T, Burchard W. Light scattering and viscosity behaviour of dextran in semidilute solution. Macromolecules. 2001;34:326–336. doi: 10.1021/ma992060z. [DOI] [Google Scholar]
- Jampen S, Britt IJ, Tung MA. Gellan polymer solution properties : dilute and concentrated regimes. Food Res Int. 2000;33:579–586. doi: 10.1016/S0963-9969(00)00094-6. [DOI] [Google Scholar]
- Karim A, Bhat R. Gelatin alternatives for the food industry: recent developments, challenges and prospects. Trends Food Sci Technol. 2008;19(12):644–656. doi: 10.1016/j.tifs.2008.08.001. [DOI] [Google Scholar]
- Kiani H, Moisavi ME, Razavi H, Morris ER. Effect of gellan, alone and in combination with high-methoxy pectin, on the structure and stability of doogh, a yogurt-based Iranian drink. Food Hydrocoll. 2010;24(8):744–754. doi: 10.1016/j.foodhyd.2010.03.016. [DOI] [Google Scholar]
- Koocheki A, Mortazavi SA, Shahidi F, Razavi SMA, Taherian A. Rheological properties of mucilage extracted from Assylum homocarpum seed as a new source of thickening agent. J Food Eng. 2009;91:490–496. doi: 10.1016/j.jfoodeng.2008.09.028. [DOI] [Google Scholar]
- León PG, Lamanna ME, Gerschenson LN, Rojas AM. Influence of composition of edible films based on gellan polymers on l-(+)-ascorbic acid stability. Food Res Int. 2008;41(6):667–675. doi: 10.1016/j.foodres.2008.04.005. [DOI] [Google Scholar]
- Liu Q, Chen D. Viscoelastic behaviors of poly(ε-caprolactone)/attapulgite nanocomposites. Eur Polym J. 2008;44(7):2046–2050. doi: 10.1016/j.eurpolymj.2008.04.035. [DOI] [Google Scholar]
- Marcotte M, Taheran Hoshahili AR, Ramaswamy HS. Rheological properties of selected hydrocolloids as a function of concentration and temperature. Food Res Int. 2001;34(8):695–703. doi: 10.1016/S0963-9969(01)00091-6. [DOI] [Google Scholar]
- McCann TH, Fabre F, Day L. Microstructure, rheology and storage of low-fat-yoghurt structured by carrot cell wall particles. Food Res Int. 2011;44:884–892. doi: 10.1016/j.foodres.2011.01.045. [DOI] [Google Scholar]
- McCurdy RD, Goff HD, Stanley DW. Properties of dextran as a cryoprotectant in ice cream. Food Hydrocoll. 1994;8(6):625–633. doi: 10.1016/S0268-005X(09)80069-6. [DOI] [Google Scholar]
- Meena R, Prasad K, Siddhanta AK. Development of a stable hydrogel network based on agar–kappa-carrageenan blend cross-linked with genipin. Food Hydrocoll. 2009;23(2):497–509. doi: 10.1016/j.foodhyd.2008.03.008. [DOI] [Google Scholar]
- Miyoshi E, Nishinari K. Rheological and thermal properties near the sol–gel transition of gellan gum aqueous solutions. Prog Colloid Polym Sci. 1999;114:68–82. doi: 10.1007/3-540-48349-7_11. [DOI] [Google Scholar]
- Morris ER, Nishinari K, Rinaudo M. Gelation of gellan—a review. Food Hydrocoll. 2012;28(2):373–411. doi: 10.1016/j.foodhyd.2012.01.004. [DOI] [Google Scholar]
- Nishinari K, Watase M, Rinaudo M, Milas M. Characterization and properties of gellan-κ-carrageenan mixed gels. Food Hydrocoll. 1996;10(3):277–283. doi: 10.1016/S0268-005X(96)80002-6. [DOI] [Google Scholar]
- Padmanabhan PA, Kim DS, Pak D, Sim SJ. Rheology and gelation of water-insoluble dextran from Leuconostoc mesenteroides NRRL B- 523. Carbohydr Polym. 2003;53:459–468. doi: 10.1016/S0144-8617(03)00140-1. [DOI] [Google Scholar]
- Papageorgiou M, Gothard MG, Willoughby LE, Kasapis S, Richardson RK, Morris ER. Rheology and structure of gellan-alginate co-gels. In: Phillips PA, Wedlock GO, Williams DJ, editors. Gums and stabilisers for the food industry. Oxford: Oxford Univ Press; 1994. pp. 345–356. [Google Scholar]
- Pérez-Campos SJ, Chavarria-Hernández N, Tecante A, Ramírez-Gilly M, Rodríguez-Hernández AI. Gelation and microstructure of dilute gellan solutions with calcium ions. Food Hydrocoll. 2012;28(2):291–300. doi: 10.1016/j.foodhyd.2012.01.008. [DOI] [Google Scholar]
- Pollock TJ. Gellan-related polysaccharides and the genus Sphingomonas. J Gen Microbiol. 1993;139(8):1939–1945. doi: 10.1099/00221287-139-8-1939. [DOI] [Google Scholar]
- Prajapati VD, Jani GK, Zala B. An insight into emerging exopolysaccharide gellan gum a novel polymer. Carbohydr Polym. 2013;93:670–678. doi: 10.1016/j.carbpol.2013.01.030. [DOI] [PubMed] [Google Scholar]
- Purama RK, Goswami P, Khan AT, Goyal A. Structural analysis and properties of dextran produced by Leuconostoc mesenteroides NRRL B-640. Carbohydr Polym. 2009;76(1):30–35. doi: 10.1016/j.carbpol.2008.09.018. [DOI] [Google Scholar]
- Richardson RK, Ross-Murphy SB. Nonlinear viscoelasticity of polysaccharide solutions. 2: xanthan polysaccharide solutions. Int J Biol Macromol. 1987;9:257–264. doi: 10.1016/0141-8130(87)90063-8. [DOI] [Google Scholar]
- Ross-Murphy SB. Rheological methods. In: Chan HW-S, editor. Biophysical methods in food research. Critical reports on applied chemistry. London: SCI; 1984. pp. 195–290. [Google Scholar]
- Ross-Murphy SB (2008) Lecture course at Department of Polymer Chemistry, Kyoto University, Japan, March 2008
- Sanderson GR. Gellan gum. In: Harris P, editor. Gellan gum. 2. London: Elsevier; 1990. pp. 201–232. [Google Scholar]
- Schacht E, Bogdanov B, Van Den Bulcke A, De Rooze N. Hydrogel prepared by crosslinking of gelatin with dextran dialdehyde. React Funct Polym. 1997;33:109–116. doi: 10.1016/S1381-5148(97)00047-3. [DOI] [Google Scholar]
- Tamine YA, Robinson RK. Yogurt: science and technology. 2. Cambridge, UK: Woodhead Publishing Ltd.; 1999. [Google Scholar]
- Tirtaatmadja V, Dunstan DE, Boger D. Rheology of dextran solutions. J Non-Newtonian Fluid Mech. 2001;97:295–301. doi: 10.1016/S0377-0257(00)00226-3. [DOI] [Google Scholar]
- Wang T, Nie J, Yang D. Dextran and gelatin based photocrosslinkable tissue adhesive. Carbohydr Polym. 2012;90:1428–1436. doi: 10.1016/j.carbpol.2012.07.011. [DOI] [PubMed] [Google Scholar]


