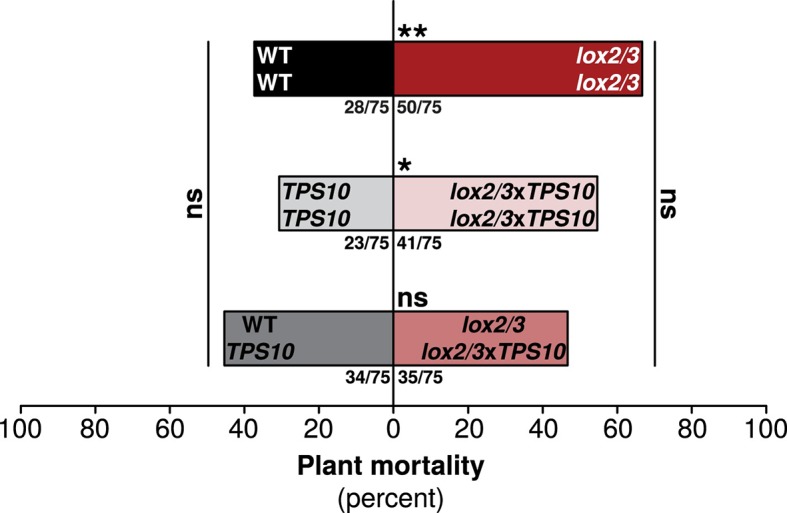
Figure 9. One TPS10-expressing plant per population counteracts a mortality increase in LOX2/3-deficient populations.
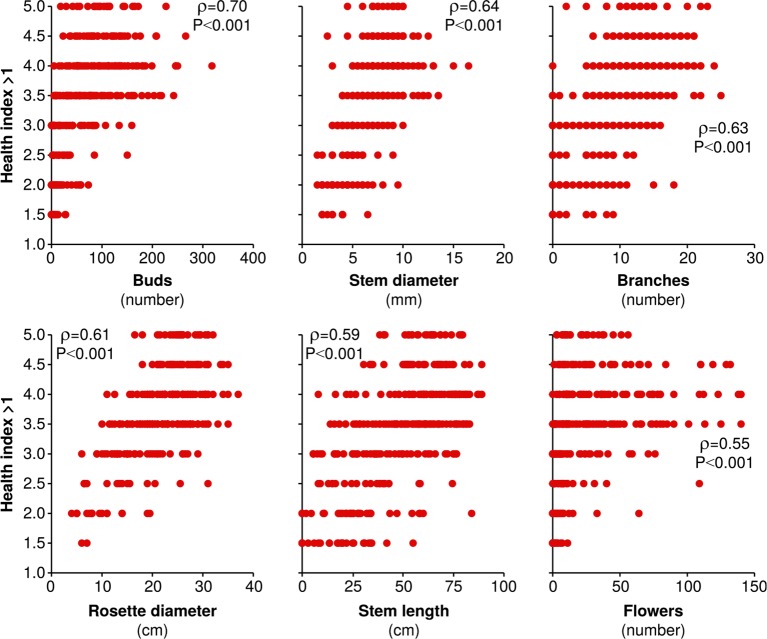
Bars indicate total percentage mortality for all plants in each population type, and ratios in bars indicate numbers of dead/total plants (n = 75). WT and TPS10 populations (left, black, and grey bars) are compared to the equivalent lox2/3 and lox2/3xTPS10 populations (right, red, and pink bars) differing only in the lox2/3 silencing construct. LOX2/3-deficient plants had higher mortality in monocultures, regardless of whether they also expressed TPS10 (**WT mono v. lox2/3 mono, corrected p<0.01; *TPS10 mono v. lox2/3xTPS10 mono, corrected p<0.05 in G-tests; p-values were corrected for multiple testing using the Holm-Bonferroni method). However, the mortality of plants in mixed lox2/3 + lox2/3xTPS10 populations is similar to that of the plants in mixed WT + TPS10 populations (ns, not significant). There was no significant difference in mortality among mono- and mixed cultures of WT and TPS10 plants (corrected p>0.3), or of lox2/3 and lox2/3xTPS10 plants, although there was a marginal difference between lox2/3 monocultures and lox2/3 + lox2/3xTPS10 mixed cultures (corrected p=0.091). In addition, a health index was assigned to each plant (discussed in text); this index was correlated with several plant growth and reproduction parameters (see Figure 9—figure supplement 1). Data were collected on June 29th at the end of experimental season two; in season one, all plants experienced much lower herbivory (Figure 5) and negligible mortality (0–5%).


