

Abstract
The human insula is a complex region characterized by heterogeneous cytoarchitecture, connectivity, and function. Subregional parcellation of the insula in adults has revealed an interesting anterior–posterior subdivision pattern that is highly consistent with its functional differentiation. However, the development of the insula's subregional segregation during the first 2 years of life remains unknown. The aim of this study was to test the hypothesis that similar segregation of the insula exists during this critical time period based on the resting-state functional magnetic resonance imaging study of a large cohort of infants (n = 143) with longitudinal scans. Our results confirmed a consistent anterior–posterior subdivision of the insula during the first 2 years of life with dissociable connectivity patterns associated with each cluster. Specifically, the anterior insula coupled more with frontal association areas, whereas the posterior insula integrated more with sensorimotor-related regions. More importantly, dramatic development of each subregion's functional network was observed, providing important neuronal correlates for the rapid advancement of its related functions during this time period.
Keywords: development, functional connectivity, insula, resting state
Introduction
Secluded in the depth of the Sylvian fissure and interconnected with numerous cortical areas through multiple neural pathways, the human insula represents a complex and versatile functional structure essential for a myriad of important functions (Nieuwenhuys 2012). Known as a nexus for the integration of exteroceptive and interoceptive information, the insula is the presumed neural substrate for multiple functions, including sensory perception, cognition, and emotion (Erberich et al. 2006; Craig 2009; Kurth et al. 2010; Menon and Uddin 2010). Given the insula's involvement in such a broad range of functions, it is not surprising that its dysfunction has been related to different brain disorders, including autism (Uddin and Menon 2009; Cox et al. 2012), addiction (Noel et al. 2013), schizophrenia (Palaniyappan et al. 2011), attention deficit disorder (Lopez-Larson et al. 2012; Yu 2013), and fronto-temporal dementia (Seeley 2010; Santillo et al. 2013). Therefore, a better characterizaton of the insula is of critical importance for the understanding of both normal and diseased brains.
Among the numerous efforts, the insula's subregional parcellation based on either cytoarchitecture and/or imaging measures has proven to be fruitful. Cytoarchitectonic studies in the rhesus monkey have revealed 3 different subregions of the insula along its anterior–posterior axis (Mesulam and Mufson 1982), whereas human studies using either structural (i.e., diffusion tensor imaging) or functional magnetic resonance imaging (fMRI) methods have described 2 (Nanetti et al. 2009; Cauda et al. 2011, 2012; Jakab et al. 2012; Kelly et al. 2012), 3 (Cauda et al. 2011; Deen et al. 2011; Chang et al. 2012; Kelly et al. 2012), and more refined insular subdivisions (Mutschler et al. 2009; Kurth et al. 2010; Nelson et al. 2010; Yeo et al. 2011; Kelly et al. 2012). Given the hierarchical organization of brain networks (Doucet et al. 2011; Power et al. 2011; Yeo et al. 2011) and the broad set of functions related to the insular cortex, it is not surprising to find different parcellation schemes describing different levels of specialization (Cauda et al. 2011; Cauda and Vercelli 2012; Kelly et al. 2012). However, as shown by Kelly et al. (2012), and stressed by Cauda and Vercelli (2012), the 2-cluster parcellation is one of the most consistent and stable findings across different neuroimaging modalities. Structurally, the anterior insular cortex (AIC) is mainly connected with limbic and paralimbic regions including the anterior cingulate area and anterior inferior frontal cortex, whereas the posterior insula cortex (PIC) is more densely connected with posterior temporal, parietal, and frontal areas including somatosensory, motor, and premotor cortices (Cerliani et al. 2012; Jakab et al. 2012). Consistent with this structural connectivity differentiation, meta-analysis of task-based fMRI further documented functional differences between the AIC and PIC (Mutschler et al. 2009; Kurth et al. 2010; Cauda et al. 2012; Chang et al. 2012; Kelly et al. 2012), with the AIC more related to self-awareness, salience detection, cognition, and other emotional/social behaviors, while the PIC is more linked to sensory perception (e.g., nociceptive [Brooks et al. 2005; Brooks and Tracey 2007; Starr et al. 2009] and nonnociceptive [Craig et al. 2000] stimuli) and motor-related functions (Showers and Lauer 1961; Kurth et al. 2010).
However, the developmental process of insular functional segregation is largely unexplored. Given the close relationship between the insula and developmental brain disorders with origins in early brain development (Uddin and Menon 2009; Cox et al. 2012; Dichter 2012; Kliemann et al. 2012; Lopez-Larson et al. 2012; Tomasi and Volkow 2012; von dem Hagen et al. 2013; Yu 2013), it is of great importance to delineate the normal functional specialization process of the insula during infancy. In this study, we aimed to explore the functional subdivision structure of the insula and the associated network development process during the first 2 years of life based on a large cohort of normal developing infants with longitudinal resting-state fMRI (rsfMRI) scans (n = 143, each scanned at least twice). Given documentation that the insula is the earliest structure to develop during the prenatal period (Streeter 1912; Afif et al. 2007) and plays a hub role among the whole-brain functional system in neonates (Gao et al. 2011), we would hypothesize that the anterior–posterior functional segregation of the insula is present “at birth.” However, consistent with the continuing maturation of a wide array of brain functional networks during the first 2 years of life (Gao et al. 2009; Tau and Peterson 2010; Gao et al. 2012), we further hypothesize that associated functional networks will show age-dependent development featuring the most dramatic changes during the first year.
Methods
Subjects
Participants were part of a large study characterizing brain development in normal and high-risk children (Geng et al. 2012; Gilmore et al. 2012; Short et al. 2013). We retrospectively identified 143 healthy normal subjects (77 males) scanned at least twice during the first 2 years of life: neonates (n = 112, mean age = 33 ± 19 days), 1-year olds (n = 129, mean age = 397 ± 35 days), and 2-year olds (n = 92, mean age = 762 ± 33 days). Among the participants, 65 were healthy normal singleton subjects (35 males; 50 neonate scans, mean age = 23 ± 9 days; 61 one-year scans, mean age = 380 ± 21 days; 39 two-year scans, mean age = 745 ± 27 days), while 78 were from healthy twin subjects (only one of each twin pair was included, 42 males; 62 neonate scans, mean age = 40 ± 21 days; 68 one-year scans, mean age = 412 ± 38 days; 53 two-year scans, mean age = 774 ± 31 days). The distribution of ages at which the subjects were scanned is summarized in Table 1. Inclusion criteria were birth between gestational age of 35 and 42 weeks, appropriate weight for gestational age, and the absence of major pregnancy and delivery complications, as defined in the exclusion criteria. Exclusion criteria included maternal pre-eclampsia, placental abruption, neonatal hypoxia, any neonatal illness requiring greater than a 1-day stay at a neonatal intensive care unit, mother with HIV, mother using illegal drugs/narcotics during pregnancy, and any chromosomal or major congenital abnormality. Informed written consent was obtained from the parents of all participants, and all study protocols were approved by the University of North Carolina at Chapel Hill review board. Before imaging, subjects were fed, swaddled, and fitted with ear protection. All subjects were in a natural sleep state during the imaging session. A board-certified neuroradiologist reviewed all images to verify that there were no apparent abnormalities.
Table 1.
Distribution of ages at which subjects were scanned
| Ages at scans (years) | Singletons | Twin subjects | Total |
|---|---|---|---|
| 0 and 1 | 26 (10 males) | 25 (15 males) | 51 (25 males) |
| 0 and 2 | 4 (3 males) | 10 (4 males) | 14 (7 males) |
| 1 and 2 | 15 (11 males) | 16 (10 males) | 31 (21 males) |
| 0, 1, and 2 | 20 (11 males) | 27 (13 males) | 47 (24 males) |
| Total | 65 (35 males) | 78 (42 males) | 143 (77 males) |
Imaging
All images were acquired with a 3-T MR scanner (Siemens Medical, Erlangen, Germany). rsfMRI was acquired using a T2*-weighted echo planar imaging sequence: repetition time (TR) = 2s, echo time (TE) = 32 ms, 33 slices, voxel size of 4 × 4 × 4 mm3. One hundred and fifty volumes were acquired in a 5-min scan. To provide anatomical reference, structural images were acquired using a 3D magnetization prepared rapid acquisition gradient echo sequence (TR = 1820 ms, TE = 4.38 ms, inversion time = 1100 ms), with a voxel size of 1 × 1 × 1 mm3.
Preprocessing
Functional data were preprocessed using FMRIB's Software Libraries (FSL, v 4.1.9) (Smith et al. 2004). The preprocessing steps included discarding the first 10 volumes, slice-timing correction, motion correction, and band-pass filtering (0.01–0.08 Hz). The mean signal from white matter, cerebrospinal fluid, the whole brain, and 6 motion parameters were removed using linear regression. No spatial smoothing was applied. To further reduce the effect of motion on functional connectivity measures, the global measures of signal change and frame-wise displacement were controlled to be <0.5% signal and 0.5 mm, respectively, as proposed by Power et al. (2012). For each subject and session, after an initial rigid alignment between functional data and T1-weighted, high-resolution structural images, a nonlinear transformation field was obtained from individual T1-weighted images to a longitudinal T1-template, T1-weighted images of a subject scanned at 2 weeks, 1 year, and 2 years using FSL (Smith et al. 2004). A combined transformation field was used to warp the preprocessed rsfMRI data to the template. Additionally, nonlinear transformation fields were obtained for each group template to the Montreal Neurological Institute (MNI) standard space using a 4-dimensional registration method, 4D-HAMMER (Shen and Davatzikos 2004), that significantly improves warping accuracy over a series of independent 3D warpings (Shen and Davatzikos 2004). The insula was segmented based on the adult Automated Anatomical Labeling (AAL) template (Tzourio-Mazoyer et al. 2002), warped to each age group template.
K-means Clustering
Functional segregation of the insula was achieved by K-means clustering based on the similarity of functional connectivity within the insula. Specifically, a Pearson correlation matrix characterizing the pair-wise correlation of all voxels within the insula was first constructed for each subject/hemisphere with each row representing the connectivity signature of one voxel to all other voxels of the insula. At the subject level, K-means clustering was subsequently applied to this correlation matrix with one minus the sample correlation between row vectors (i.e., connectivity signatures of different voxels) as the distance measure. Clustering solutions based on K = 2, 3, and 4 were explored. To obtain group-level representations, a consensus-clustering algorithm was applied (Bellec et al. 2010; Kelly et al. 2012). Specifically, for each subject s and each insula in either hemisphere, an adjacency matrix As was first built with aij = 1, representing voxels i and j belonging to the same cluster and aij = 0 otherwise. Next, the group-level consensus matrix was defined as the average of individual matrices:
| (1) |
where N is the number of subjects in the group. This consensus matrix quantified the stability or consistency of voxel groupings across individual subjects within a group (Bellec et al. 2010; Kelly et al. 2012). Finally, for each consensus matrix, an identical K-means clustering algorithm was applied to identify the group-level solution representing the most stable pattern of cluster assignments across subjects.
Two independent and objective criteria were applied to explore the optimal number of clusters. The first one was the objective validity indicator (VI), defined as the ratio between the intercluster distance (defined as one minus the sample correlation as mentioned above) and the intracluster distance (Chang et al. 2012). Specifically, the intercluster distance was calculated as the mean distance between the centers of clusters (defined by the K-means algorithm), whereas the intracluster distance was obtained as the mean distance between each voxel and its corresponding cluster center (Chang et al. 2012). At the subject level, the optimal solution was the one with the maximum ratio of inter- to intracluster distance based on this criterion. At the group level, the optimal solution was defined based on the group average ratio of inter- to intracluster distance. The second measure was cluster consensus (CC), which measured the cluster stability across subjects (Bellec et al. 2010; Kelly et al. 2012) at the group level. Specifically, a consensus value was calculated for each group-level solution (K = 2, 3, or 4) by averaging the within-cluster elements of the group consensus matrix A obtained using equation (1), and the solution associated with the maximum consensus value was deemed to be optimal based on this metric. The abovementioned clustering and optimal number of cluster identification procedures were first applied to the singleton and twin samples separately, and then to the whole sample after pooling together the 2 populations.
Quantitative evaluations of within- and between-cluster functional connectivity were conducted to test the functional segregation of the insula subdivisions. Specifically, for the insula in each hemisphere and each subject, a correlation matrix was calculated to quantify the connectivity among all voxels. Subsequently, the mean correlation value of all pair-wise correlations between voxels belonging to the same cluster (within-cluster) was calculated to represent within-cluster connectivity. Similarly, the mean correlation value for all correlations between voxels belonging to different clusters was calculated to represent between-cluster connectivity. At the group level, after Fisher z-transformation, paired t-tests were performed to test for differences between within- and between-cluster functional connectivity for the insula in each hemisphere and each age group (significance defined at P < 0.05 after false discovery rate (FDR) correction) (Benjamini and Yekutieli 2001).
Clustering Consistency Evaluation
To evaluate the consistency of the insula functional parcellation between singletons and twins, the parcellation maps associated with the optimal number of K were warped to the MNI space, and the proportion of voxels that were classified into the same cluster between singleton and twin solutions were calculated. To further evaluate the insula parcellation consistency, the 2 populations were pooled together and a bootstrapping strategy was applied to quantitatively characterize the consistency based on the whole sample. Specifically, for each age group, 1000 random samplings with replacement within the whole sample were acquired, and the corresponding group-level K-mean clusters were obtained as described above for each resampling. Subsequently, the voxel-wise clustering consistency was calculated as the percentage of times out of 1000 that this voxel showed consistent clustering membership. This process was repeated for the insula within each hemisphere and age group. Finally, to quantify the consistency of the insular parcellations across age groups, the proportion of voxels that were classified into the same cluster across ages were calculated for the insula in each hemisphere.
Insular Network Development Characterization
To characterize the whole-brain functional connectivity maps associated with the defined insular clusters, whole-brain partial correlation analysis was conducted for each subject. Specifically, the correlation was calculated between the average time series from the insular cluster in question and each other voxel time series of the whole brain after controlling for the average time series from the other insular clusters from the same hemisphere. One sample t-tests were performed to obtain group-level significant connectivity maps for each cluster (significance defined as P < 0.05, FDR corrected; Benjamini and Yekutieli 2001). To characterize the development of the whole-brain functional connectivity of the insular clusters, the individual connectivity maps were warped to the MNI space and after Fisher z-transformation, paired t-tests were performed to obtain group-level significant changes across time-points (only subjects with scans in both age groups being compared were included).
To further characterize the development of the quantitative network measures associated with each insular cluster, regions of interest (ROIs) were defined based on the corresponding connectivity maps and network-level measures including mean functional connectivity, and graph-theoretical local efficiency (LE)/global efficiency (GE) measures (Rubinov and Sporns 2010) were evaluated. Specifically, the local maxima of each insula subdivision functional connectivity map in 2-year olds were identified to define spherical ROIs (8 mm in radius) using the cluster algorithm implemented in FSL (FLS 4.1.9) restricting the local maxima to be 16 mm apart from each other. Given the high similarity of left and right insula subdivision maps, the defined ROIs (left and right) were pooled to form a single network for the anterior and posterior insula, respectively. During this process, ROIs that were within 16 mm in distances were merged as one centered at the mean coordinate. The defined ROIs from 2-year olds' maps were warped to the neonates and 1-year group to provide a consistent set of ROIs for quantitative delineation of growth patterns across age. Specifically, the correlation matrix among all defined ROIs of each insular network was calculated for each subject. Two-way t-tests were applied to obtain the group-level significant connectivity matrices from which the mean functional connectivity strength was calculated and compared across age groups (significance was defined as P < 0.05, FDR corrected). Moreover, graph–theory-based LE/GE measures, characterizing the ease of information transfer within the local and whole network, respectively, were also calculated for each insular network in each subject based on the weighted individual correlation matrices (thresholded at >0.1 to include only functionally relevant connections) (Rubinov and Sporns 2010). Such graph measures provide simple and quantitative evaluation of the efficiency of the network organization. Linear mixed effect regression (LMER) was used to delineate the longitudinal growth curves of efficiency measures (Pinheiro et al. 2013). For each network, both a linear model and a log-linear model were built with age/log(age) as fixed effects (plus an intercept term). Random effects were added for both the intercept and the age/log(age) term. All significant effects were defined as P < 0.05 after FDR correction, and the Akaike information criterion was used to select whether the linear or log-linear model with age was a better fit for the data.
Results
Optimal K Definition
At the group level, both the VI and CC measure consistently indicated that K = 2 was the optimal solution for the insula within both hemispheres and across the 3 age groups, which was also consistent when applied to singletons (Supplementary Fig. 1), twins (Supplementary Fig. 2), and the whole sample (Fig. 1). At the subject level, K = 2 was also consistently identified as the most frequent optimal solution based on VI for singletons, twins, and the whole sample (Supplementary Table 1). Therefore, findings associated with K = 2 were presented in the following as the main results.
Figure 1.

The selection of optimal K for the whole sample. For each insula and age group, the VI (first row) and CC (second row) were plotted against the number of clusters (K = 2, 3, and 4). The individual VI curves are in light gray lines, while the bold line represents the group average. CC was measured in the group mean consensus matrix. Error bars denote the standard error of the mean. Asterisks denote significant difference (P < 0.05 after false discovery rate correction; paired t-tests for VI; 2-sample t-tests for CC).
Functional Parcellation of Insula
The 2-cluster parcellations of the bilateral insula across the 3 age groups are presented in Figure 2. Highly consistent parcellations were observed between singletons and twins (consistency value >80%; Fig. 2 and Supplementary Table 2), so they were combined to form a whole sample and a bootstrapping procedure (1000 times resampling with replacement) was applied to further quantify the consistency of the insula parcellation (Fig. 3). High levels of consistency were observed; the majority of voxels exhibited a consistency value of >90% for both hemispheres within all 3 age groups (left insula: neonate, 93%; 1 year, 89%, 2 years, 75% and right insula: neonate, 95%; 1 year, 85%, 2 years, 74%; Fig. 3). Given this high level of consistency, we focused on the 2-cluster solution from the whole sample (Fig. 4) in the following discussion (which, as expected, also demonstrated high consistency with that of each separate sample; Supplementary Table 2).
Figure 2.

Two-cluster parcellation of the insula for singletons and twins, separately, across the first 2 years of life.
Figure 3.

Bootstrapping evaluation of clustering consistency for the whole sample (K = 2). Consistency values were visualized on 3D surfaces (left) and in histograms (right) for the insula in each hemisphere and age group. Red vertical lines in the histogram plots indicate 90% consistency level. The number shown in each plot indicates the percentage of voxels within the corresponding insula that shows a consistency level of >90%.
Figure 4.

(a) Two-cluster parcellation of the insula for the whole sample; (b) comparisons of within- and between-cluster functional connectivity. Asterisks denote significant differences (P < 0.05 after false discovery rate correction; paired t-tests).
The anterior–posterior segregation pattern of the insula's functional parcellation was immediately clear starting from neonates (Fig. 4a). Actually, the bilateral insula demonstrated highly consistent anterior–posterior segregation across the 3 ages examined (consistency over 80%, Supplementary Table 3). Moreover, the within-cluster connectivity was significantly higher than between-cluster connectivity for both hemispheres and across all 3 age groups, clearly demonstrating the functional dissociation between the anterior and posterior clusters (Fig. 4b). Although not optimal, the K = 3 and 4 solutions were also obtained, and the observed anterior–posterior segregation pattern was again evident although solutions at different age groups differed in their subtle topologies (Supplementary Fig. 3).
Functional Connectivity Networks Associated with Insula Subdivisions
The functional connectivity maps of the anterior and posterior insula clusters showed largely dissociable connectivity patterns across all 3 age groups (Fig. 5). The anterior insula connects more with anterior cingulate (ACC), medial temporal, anterior thalamus/basal ganglia, orbitofrontal (OFC), lateral and dorsolateral prefrontal (dlPFC) cortices, whereas posterior insula synchronizes more with superior temporal sulcus (STS), middle cingulate cortex (MCC), pre-/post-central (M1/S1), and supplementary motor areas (SMAs) across all 3 age groups (Fig. 5).
Figure 5.

Group mean functional connectivity maps associated with the defined insula clusters (red: the anterior insula and green: the posterior insula). Axial slices in radiological convention (left in image is the right hemisphere) covering the whole brain were visualized.
Qualitatively, the functional connectivity maps from neonates were diffusive and composed of large locally connected clusters, while both 1-year and 2-year olds demonstrated better distributed topology (Fig. 5). Quantitatively, the functional connectivity maps of the insular clusters showed more significant changes during the first year of life than the second (Figs 5 and 6, and Supplementary Table 4). Specifically, for the anterior clusters, reduced connectivity in regions proximal to the seed cluster, including prefrontal and subcortical areas, and increased connectivity with more distant regions, including the ACC, SMA, and contralateral insular cortex (Fig. 6 and Supplementary Table 4), were observed during the first year, which primarily explained the formation of the more bilateral symmetric and distributed network topology observed in Figure 5. Moderate local specializations were observed during the second year for the anterior clusters. For the posterior clusters, increased connectivity was observed within the ipsilateral and contralateral insular cortex, MCC, S1, and M1, while decreased functional connectivity was observed in the STS, putamen, M1, S1, and SMA during the first year of life (Fig. 6 and Supplementary Table 4). The second year featured decreased connectivity within bilateral sensorimotor areas.
Figure 6.
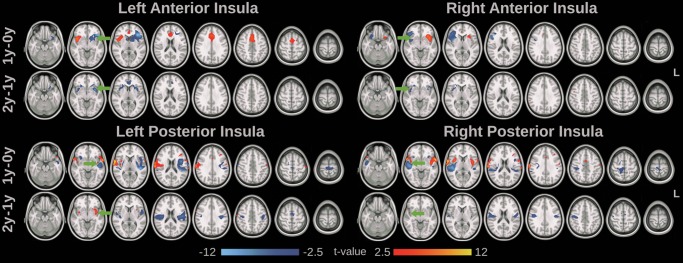
Development of the insular cluster functional connectivity maps. Significant increase (red-yellow) and decrease (blue) of functional connectivity with age (paired t-test, P < 0.05, false discovery rate corrected) were visualized. Axial slices in radiological convention (left in image is the right hemisphere) were visualized. Green arrows indicate the location of the seed cluster.
For quantitative network measures, the group mean functional connectivity of the network associated with both the anterior and posterior insula clusters showed significant increases from neonates to 1 year of age (P = 0.02 and 0.007 for anterior and posterior insula network, respectively) but not during the second year (Fig. 7). Consistently, both the GE and LE of both networks exhibited significant log-linear growth patterns for both networks (except for the GE of the posterior network, which only demonstrated a log-linear trend of growth [P > 0.05], Fig. 7).
Figure 7.

Development of network functional connectivity measures associated with each insula cluster. (a) Anterior insula network and (b) posterior insula network. Mean functional connectivity strength within each network was compared across groups and shown in the left column of (a) and (b) (asterisks denote significant difference at P < 0.05 after false discovery rate (FDR) correction; 2-sample t-tests). For LE and GE plots, light gray lines denote individual growth trajectories, while bold black lines represent the LMER fit of the growth trends (solid lines indicate significant growth at P < 0.05 after FDR correction, while dashed lines indicate not significant growth).
Discussion
In this study, we aimed to delineate the functional parcellation of the insula during the first 2 years of life. Our results support the emergence of an anterior–posterior subdivision architecture as early as the neonatal period, which was consistently observed within both hemispheres and across the 3 age groups. More importantly, the functional networks associated with each of the defined insula clusters demonstrated significant age-dependent changes with respect to the qualitative network topology, quantitative connectivity strength, and graph–theory-based efficiency measures, indicating a dramatic developmental improvement. The delineated functional parcellation pattern of the insula in a large cohort of normal developing infants could serve as a valuable reference for future studies of related brain disorders.
The Optimal K During Infancy
To determine the optimal number of clusters, 2 independent and objective criteria were applied. The first one was the VI, which was developed based on the underlying principle of the K-means algorithm through minimizing the within-cluster distances. This criterion, proposed by Chang et al. (2012) in a similar insula parcellation study in adults, defined the optimal solution (K) as the one with the maximum ratio of inter-to-intracluster distance. Similar measures have been shown to be able to correctly identify the number of color clusters in 2-dimensional synthetic images (Ray and Turi 1999). The second criterion, cluster consensus (CC), was a measure of the clustering stability by quantifying the percentage of voxels that were placed in the same cluster across subjects (Bellec et al. 2010; Kelly et al. 2012). The concept is that the optimal number of clusters represents the one with the maximal clustering stability (Jain et al. 1987; Ben-Hur et al. 2002), which has been suggested as an effective mechanism for the selection of K (Lange et al. 2004). Although there is still no standard method to define the optimal K in K-means clustering, 2 independent criteria in this study converged at the same optimal solution of K = 2 for all age groups and samples within the insula of both hemispheres (Fig. 1, and Supplementary Figs 1 and 2), supporting the reliability and stability of this finding during infancy. Interestingly, Chang et al. (2012) used the same VI in a similar rsfMRI-based insula parcellation study in adults and K = 3 was defined as the optimal solution. Their parcellation scheme showed a consistent anterior–posterior subdivision, but the anterior cluster was further divided into ventral and dorsal portions. Actually, other studies (Cauda et al. 2011; Deen et al. 2011; Kelly et al. 2012) also delineated more refined parcellations of the insula in adults using rsfMRI data, potentially representing further developmental specialization of this structure after 2 years of age, although the confound of different methods used to define the optimal K should not be ignored.
The Early Emergence of Insula Subdivision in Neonates
The emergence of an anterior–posterior segregation pattern of the insula in neonates is intriguing. Structurally, it has long been observed that the insula is the first cortex to differentiate and develop in utero beginning at 6 weeks after conception (Streeter 1912; Afif et al. 2007), providing a structural basis for its functional specialization. Actually, the insula was observed as one of the main hubs in neonates in one of our previous studies examining the development of the whole-brain functional system (Gao et al. 2011) supporting its significant functional role “at birth.” Therefore, these previous studies provide the structural and functional basis for the observed functional specialization of the insula in neonates. More importantly, given the relatively later functional maturation of other higher order brain functions, such an early functional specialization of the insula may indicate the special importance of its related functions for early survival. For example, an increased hemodynamic response in the insula, cingulate, and secondary somatosensory cortices was observed with near-infrared spectroscopy in neonates and preterm newborns as young as 25 weeks of gestational age following venipuncture or heel lance (Bartocci et al. 2006; Lagercrantz and Changeux 2010). This result is consistent with our finding of a specialized posterior insula cluster and similar functional synchronizations with sensorimotor regions (Figs 4 and 5). More interestingly, the anterior insula was reported to be active in newborns exposed to infant formula milk odors (Arichi et al. 2013), which was recognized as a trigger to orient the subject toward the mother's breast (Varendi and Porter 2001). This insula activity may underlie the classical conditioning of olfactory stimuli, which is essential for infant–mother bonding and associative learning (Arichi et al. 2013).
The 2-cluster segregation of the insula was consistently observed across the first 2 years of life (consistency level of >80%; Fig. 2 and Supplementary Table 3) in singletons, twins, and the whole sample (Figs 3 and 4), indicating high stability of this anterior–posterior segregation pattern during infancy. Even in adults, a similar 2-cluster anterior–posterior segregation of the insula has been observed (Cauda et al. 2011; Deen et al. 2011; Kelly et al. 2012) and reported as one of the most consistent and stable findings across different neuroimaging modalities (Cauda and Vercelli 2012; Kelly et al. 2012). Therefore, findings in this study support the hypothesis that the anterior–posterior segregation of the insula is developed prenatally and remains largely unchanged during infancy. As discussed above, such early emergence of an adult-like functional segregation pattern may highlight the insula as a region of particular importance for early brain functional development. Despite the relatively constant subdivision structures, significant postnatal changes in the whole-brain functional connectivity patterns associated with each insula cluster were observed and will be discussed in detail in the following section.
The Development of Functional Networks Associated With Insular Subdivisions
The functional networks associated with each of the insular clusters demonstrated significant developmental changes. Qualitatively, the functional connectivity maps from neonates were characterized by large and diffusive local blobs, while both 1- and 2-year olds demonstrated better network-like topologies characterized by more distributed regions (Fig. 5). Quantitatively, most network measures including both mean functional connectivity and GE/LE exhibited significant log-linear growth during the first 2 years of life featuring more significant changes during the first year (Fig. 7). Such a dramatic first-year improvement in network measures has been consistently observed for the default-mode network (Gao et al. 2009), the dorsal attention network (Gao et al. 2012), and the whole-brain system (Gao et al. 2011), suggesting a common synchronization theme for the brain's various functional networks during this time period. The coincidence of significant myelination and fast synaptogenesis during this period (Haynes et al. 2005; Gao et al. 2009; Tau and Peterson 2010) suggests that these 2 channels of structural development may largely contribute to the observed functional synchronization. There is also evidence for a neurotransmitter signaling shift during early postnatal life, which could also promote neuronal synchronization (Rivera et al. 1999; Buzsaki and Draguhn 2004; Steriade 2006; Vanhatalo and Kaila 2006). Therefore, myelination growth, synaptogenesis, and a shift in neurotransmitter signaling may altogether form the neurophysiological basis for the observed fast synchronization of insular networks during the first 2 years of life.
Topologically, the anterior insular clusters showed specializing connectivity within the local seed proximity but enhanced connectivity with long-range ACC, SMA, and prefrontal cortices during the first year resulting in an adult-like salience network (Seeley et al. 2007) in 1-year olds, which remained largely the same in 2-year olds. The salience network has been reported to be responsible for detecting salient events from both the internal and external environment for efficient decision making in adults (Seeley et al. 2007; Menon and Uddin 2010; Elton and Gao 2013). Consistent with the observed dramatic improvement in the anterior insula network structure, certain salience network-related functions have also been documented to experience significant improvement during the first year of life. For example, sad vocalizations presented to 3- to 7-month-old infants have been shown to modulate the activity of anterior insula and OFC (Blasi et al. 2011), indicating a growing capability for salient affective stimuli processing in developing infants. Regarding the neurophysiological basis, a specific type of neuron—Von Economo Neurons (VENs)—is possibly related to the observed synchronization between anterior insula and anterior cingulate regions. Specifically, VENs are large bipolar neurons found only in the anterior insular and ACCs in human and great apes' brains (Butti et al. 2009; Hakeem et al. 2009; Allman et al. 2011; Evrard et al. 2012). Moreover, these neurons are projection neurons whose growth may lead to better anatomical connectivity and likely tighter functional synchronization as well (Honey et al. 2009). Indeed, these neurons have been reported to experience a major increase during the first 8 months of life (Allman et al. 2011), which coincides well with the observed increased synchronization between the 2 corresponding regions during the first year. Therefore, current findings support a possible role of VEN in the early anterior insula network synchronization process, but future studies are needed to directly assess this relationship.
The posterior insula has been consistently reported to be functionally related to interoception, sensory perception, and motor control in adults (Craig 2003; Kurth et al. 2010; Chang et al. 2012; Kelly et al. 2012). Highly consistent with these functional roles, the posterior subdivision of the insula exhibited strong functional coupling with the primary and secondary sensorimotor area during the first years of life in this study (Fig. 5). As mentioned above, consistent with this early establishment of the posterior insula subdivision and associated network topology, increased hemodynamic response in the insula and secondary somatosensory cortices have been observed in neonates and preterm newborns as young as 25 weeks of gestational age following sensory stimulation (Bartocci et al. 2006; Lagercrantz and Changeux 2010). Interestingly, the posterior insula showed both increased and decreased functional connectivity with sensorimotor cortices during the first year, but predominantly decreased connectivity during the second year of life (Fig. 6 and Supplementary Table 4). The increased functional connectivity during the first year may be related to the general myelination process of long-range axonal tracts and synaptogenesis as previously mentioned (Rivera et al. 1999; Buzsaki and Draguhn 2004; Haynes et al. 2005; Steriade 2006; Vanhatalo and Kaila 2006; Gao et al. 2009; Tau and Peterson 2010). However, the decreased functional connectivity observed during the second year is intriguing. Consistent with the previous observation that synaptogenesis achieves its peak before the first year of age within sensory-related areas and subsequently experiences activity-dependent pruning (Huttenlocher 1990; Huttenlocher and Dabholkar 1997), the observed refinement in related functional connectivity likely reflects an early synaptic pruning process. Such pruning may facilitate more efficient signal processing by the elimination of redundant functional connections overproduced during early development (Tau and Peterson 2010), which is consistent with the increased efficiency exhibited by the network (Fig. 7). Behaviorally, this is also consistent with the continued improvement of posterior insula-related functions, including sensory processing and motor control, during this period of development (Lenard et al. 1977; Tau and Peterson 2010).
Limitations
One potential limitation is the control of physiological noise. Instead of using external monitoring devices (e.g., photoplethysmograph and pneumatic belt) to monitor cardiac and respiratory effects and performing post hoc removal of physiological confounds based on empirical models (Chang and Glover 2009), we opted to perform global regression in our study. The rationale behind this choice is 2-fold. First, it is difficult for our infant subjects to fall asleep after applying the photoplethysmograph and pneumatic belt. Secondly, Chang and Glover (2009) showed a strong correspondence between the global signal and the externally monitored respiratory and cardiac signals. Therefore, it is highly plausible that such physiological confounds have been substantially minimized using this regression approach. Thirdly, we did not explicitly monitor sleep stage during the rsfMRI scan, since it is highly challenging to image infants at natural sleep with additional EEG electrodes on their brain for optimal acquisition of such information. However, to minimize potential variability resulting from different sleep stages, all subjects were imaged immediately after they fell asleep. Given previous findings (Vincent et al. 2007; Horovitz et al. 2008) regarding the limited effects of light sleep on rsfMRI connectivity measures, it is likely that different sleep stages exerted minimal effects on the current study.
Conclusions
In this study, we have delineated the maturation process of the insula during the first 2 years of life based on the functional connectivity examination of a large cohort of longitudinally scanned infants. Specifically, the development of the insula features the prenatal establishment of a local anterior–posterior subdivision structure and a significant postnatal development in the associated network structures. Whether this represents a specific functional development pattern of the insula or a more general trend applicable to other brain structures is an interesting future direction. Overall, the emergence and significant development of the insula's functional segregation profile likely indicates its early functioning (Varendi and Porter 2001; Lauronen et al. 2012; Shibata et al. 2012; Arichi et al. 2013; Roche-Labarbe et al. 2013) and supports the notion that the insula might play an especially important role in the early brain functional development process.
Supplementary Material
Supplementary material can be found at: http://www.cercor.oxfordjournals.org/.
Funding
This work was supported by the National Institutes of Health (R01MH070890-09A1 to J.H.G.); Foundation of Hope for Research and Treatment of Mental Illness Award to W.G., and UNC-Chapel Hill start-up to W.G.
Supplementary Material
Notes
Conflict of Interest: None declared.
References
- Afif A, Bouvier R, Buenerd A, Trouillas J, Mertens P. 2007. Development of the human fetal insular cortex: study of the gyration from 13 to 28 gestational weeks. Brain Struct Funct. 212:335–346. [DOI] [PubMed] [Google Scholar]
- Allman JM, Tetreault NA, Hakeem AY, Manaye KF, Semendeferi K, Erwin JM, Park S, Goubert V, Hof PR. 2011. The von Economo neurons in the frontoinsular and anterior cingulate cortex. Ann N Y Acad Sci. 1225:59–71. [DOI] [PMC free article] [PubMed] [Google Scholar]
- Arichi T, Gordon-Williams R, Allievi A, Groves A, Burdet E, Edwards A. 2013. Computer-controlled stimulation for functional magnetic resonance imaging studies of the neonatal olfactory system. Acta Paediatr. 102:868–875. [DOI] [PMC free article] [PubMed] [Google Scholar]
- Bartocci M, Bergqvist LL, Lagercrantz H, Anand KJ. 2006. Pain activates cortical areas in the preterm newborn brain. Pain. 122:109–117. [DOI] [PubMed] [Google Scholar]
- Bellec P, Rosa-Neto P, Lyttelton OC, Benali H, Evans AC. 2010. Multi-level bootstrap analysis of stable clusters in resting-state fMRI. Neuroimage. 51:1126–1139. [DOI] [PubMed] [Google Scholar]
- Ben-Hur A, Elisseeff A, Guyon I. 2002. A stability based method for discovering structure in clustered data. Pacific Symposium on Biocomputing Pacific Symposium on Biocomputing, pp. 6–17. [PubMed] [Google Scholar]
- Benjamini Y, Yekutieli D. 2001. The control of the false discovery rate in multilpe testing under dependency. Ann Stat. 29:1165–1188. [Google Scholar]
- Blasi A, Mercure E, Lloyd-Fox S, Thomson A, Brammer M, Sauter D, Deeley Q, Barker GJ, Renvall V, Deoni S, et al. 2011. Early specialization for voice and emotion processing in the infant brain. Curr Biol. 21:1220–1224. [DOI] [PubMed] [Google Scholar]
- Brooks JC, Tracey I. 2007. The insula: a multidimensional integration site for pain. Pain. 128:1–2. [DOI] [PubMed] [Google Scholar]
- Brooks JC, Zambreanu L, Godinez A, Craig AD, Tracey I. 2005. Somatotopic organisation of the human insula to painful heat studied with high resolution functional imaging. Neuroimage. 27:201–209. [DOI] [PubMed] [Google Scholar]
- Butti C, Sherwood CC, Hakeem AY, Allman JM, Hof PR. 2009. Total number and volume of Von Economo neurons in the cerebral cortex of cetaceans. J Comp Neurol. 515:243–259. [DOI] [PubMed] [Google Scholar]
- Buzsaki G, Draguhn A. 2004. Neuronal oscillations in cortical networks. Science. 304:1926–1929. [DOI] [PubMed] [Google Scholar]
- Cauda F, Costa T, Torta DM, Sacco K, D'Agata F, Duca S, Geminiani G, Fox PT, Vercelli A. 2012. Meta-analytic clustering of the insular cortex: characterizing the meta-analytic connectivity of the insula when involved in active tasks. Neuroimage. 62:343–355. [DOI] [PMC free article] [PubMed] [Google Scholar]
- Cauda F, D'Agata F, Sacco K, Duca S, Geminiani G, Vercelli A. 2011. Functional connectivity of the insula in the resting brain. Neuroimage. 55:8–23. [DOI] [PubMed] [Google Scholar]
- Cauda F, Vercelli A. 2012. How many clusters in the insular cortex? Cereb Cortex. 23:2779–2780. [DOI] [PubMed] [Google Scholar]
- Cerliani L, Thomas RM, Jbabdi S, Siero JC, Nanetti L, Crippa A, Gazzola V, D'Arceuil H, Keysers C. 2012. Probabilistic tractography recovers a rostrocaudal trajectory of connectivity variability in the human insular cortex. Hum Brain Mapp. 33:2005–2034. [DOI] [PMC free article] [PubMed] [Google Scholar]
- Chang C, Glover GH. 2009. Effects of model-based physiological noise correction on default mode network anti-correlations and correlations. Neuroimage. 47:1448–1459. [DOI] [PMC free article] [PubMed] [Google Scholar]
- Chang LJ, Yarkoni T, Khaw MW, Sanfey AG. 2012. Decoding the role of the insula in human cognition: functional parcellation and large-scale reverse inference. Cereb Cortex. 23:739–749. [DOI] [PMC free article] [PubMed] [Google Scholar]
- Cox CL, Uddin LQ, Di Martino A, Castellanos FX, Milham MP, Kelly C. 2012. The balance between feeling and knowing: affective and cognitive empathy are reflected in the brain's intrinsic functional dynamics. Soc Cogn Affect Neurosci. 7:727–737. [DOI] [PMC free article] [PubMed] [Google Scholar]
- Craig AD. 2009. How do you feel—now? The anterior insula and human awareness. Nat Rev Neurosci. 10:59–70. [DOI] [PubMed] [Google Scholar]
- Craig AD. 2003. Interoception: the sense of the physiological condition of the body. Curr Opin Neurobiol. 13:500–505. [DOI] [PubMed] [Google Scholar]
- Craig AD, Chen K, Bandy D, Reiman EM. 2000. Thermosensory activation of insular cortex. Nat Neurosci. 3:184–190. [DOI] [PubMed] [Google Scholar]
- Deen B, Pitskel NB, Pelphrey KA. 2011. Three systems of insular functional connectivity identified with cluster analysis. Cereb Cortex. 21:1498–1506. [DOI] [PMC free article] [PubMed] [Google Scholar]
- Dichter GS. 2012. Functional magnetic resonance imaging of autism spectrum disorders. Dialogues Clin Neurosci. 14:319–351. [DOI] [PMC free article] [PubMed] [Google Scholar]
- Doucet G, Naveau M, Petit L, Delcroix N, Zago L, Crivello F, Jobard G, Tzourio-Mazoyer N, Mazoyer B, Mellet E, et al. 2011. Brain activity at rest: a multiscale hierarchical functional organization. J Neurophysiol. 105:2753–2763. [DOI] [PubMed] [Google Scholar]
- Elton A, Gao W. 2013. Divergent task-dependent functional connectivity of executive control and salience networks. Cortex. doi:10.1016/j.cortex.2013.10.012. [DOI] [PubMed]
- Erberich SG, Panigrahy A, Friedlich P, Seri I, Nelson MD, Gilles F. 2006. Somatosensory lateralization in the newborn brain. Neuroimage. 29:155–161. [DOI] [PubMed] [Google Scholar]
- Evrard HC, Forro T, Logothetis NK. 2012. Von Economo neurons in the anterior insula of the macaque monkey. Neuron. 74:482–489. [DOI] [PubMed] [Google Scholar]
- Gao W, Gilmore JH, Giovanello KS, Smith JK, Shen D, Zhu H, Lin W. 2011. Temporal and spatial evolution of brain network topology during the first two years of life. PLoS One. 6:e25278. [DOI] [PMC free article] [PubMed] [Google Scholar]
- Gao W, Gilmore JH, Shen D, Smith JK, Zhu H, Lin W. 2012. The synchronization within and interaction between the default and dorsal attention networks in early infancy. Cereb Cortex. 23:594–603. [DOI] [PMC free article] [PubMed] [Google Scholar]
- Gao W, Lin W, Chen Y, Gerig G, Smith JK, Jewells V, Gilmore JH. 2009. Temporal and spatial development of axonal maturation and myelination of white matter in the developing brain. AJNR Am J Neuroradiol. 30:290–296. [DOI] [PMC free article] [PubMed] [Google Scholar]
- Gao W, Zhu H, Giovanello KS, Smith JK, Shen D, Gilmore JH, Lin W. 2009. Evidence on the emergence of the brain's default network from 2-week-old to 2-year-old healthy pediatric subjects. Proc Natl Acad Sci USA. 106:6790–6795. [DOI] [PMC free article] [PubMed] [Google Scholar]
- Geng X, Prom-Wormley EC, Perez J, Kubarych T, Styner M, Lin W, Neale MC, Gilmore JH. 2012. White matter heritability using diffusion tensor imaging in neonatal brains. Twin Res. 15:336–350. [DOI] [PMC free article] [PubMed] [Google Scholar]
- Gilmore JH, Shi F, Woolson SL, Knickmeyer RC, Short SJ, Lin W, Zhu H, Hamer RM, Styner M, Shen D. 2012. Longitudinal development of cortical and subcortical gray matter from birth to 2 years. Cereb Cortex. 22:2478–2485. [DOI] [PMC free article] [PubMed] [Google Scholar]
- Hakeem AY, Sherwood CC, Bonar CJ, Butti C, Hof PR, Allman JM. 2009. Von Economo neurons in the elephant brain. Anat Rec (Hoboken). 292:242–248. [DOI] [PubMed] [Google Scholar]
- Haynes RL, Borenstein NS, Desilva TM, Folkerth RD, Liu LG, Volpe JJ, Kinney HC. 2005. Axonal development in the cerebral white matter of the human fetus and infant. J Comp Neurol. 484:156–167. [DOI] [PubMed] [Google Scholar]
- Honey CJ, Sporns O, Cammoun L, Gigandet X, Thiran JP, Meuli R, Hagmann P. 2009. Predicting human resting-state functional connectivity from structural connectivity. Proc Natl Acad Sci USA. 106:2035–2040. [DOI] [PMC free article] [PubMed] [Google Scholar]
- Horovitz SG, Fukunaga M, de Zwart JA, van Gelderen P, Fulton SC, Balkin TJ, Duyn JH. 2008. Low frequency BOLD fluctuations during resting wakefulness and light sleep: a simultaneous EEG-fMRI study. Hum Brain Mapp. 29:671–682. [DOI] [PMC free article] [PubMed] [Google Scholar]
- Huttenlocher PR. 1990. Morphometric study of human cerebral cortex development. Neuropsychologia. 28:517–527. [DOI] [PubMed] [Google Scholar]
- Huttenlocher PR, Dabholkar AS. 1997. Regional differences in synaptogenesis in human cerebral cortex. J Comp Neurol. 387:167–178. [DOI] [PubMed] [Google Scholar]
- Jain AK, Dubes RC, Chen CC. 1987. Bootstrap techniques for error estimation. IEEE Trans Pattern Anal Mach Intell. 9:628–633. [DOI] [PubMed] [Google Scholar]
- Jakab A, Molnar PP, Bogner P, Beres M, Berenyi EL. 2012. Connectivity-based parcellation reveals interhemispheric differences in the insula. Brain Topogr. 25:264–271. [DOI] [PubMed] [Google Scholar]
- Kelly C, Toro R, Di Martino A, Cox CL, Bellec P, Castellanos FX, Milham MP. 2012. A convergent functional architecture of the insula emerges across imaging modalities. Neuroimage. 61:1129–1142. [DOI] [PMC free article] [PubMed] [Google Scholar]
- Kliemann D, Dziobek I, Hatri A, Baudewig J, Heekeren HR. 2012. The role of the amygdala in atypical gaze on emotional faces in autism spectrum disorders. J Neurosci. 32:9469–9476. [DOI] [PMC free article] [PubMed] [Google Scholar]
- Kurth F, Zilles K, Fox PT, Laird AR, Eickhoff SB. 2010. A link between the systems: functional differentiation and integration within the human insula revealed by meta-analysis. Brain Struct Funct. 214:519–534. [DOI] [PMC free article] [PubMed] [Google Scholar]
- Lagercrantz H, Changeux JP. 2010. Basic consciousness of the newborn. Semin Perinatol. 34:201–206. [DOI] [PubMed] [Google Scholar]
- Lange T, Roth V, Braun ML, Buhmann JM. 2004. Stability-based validation of clustering solutions. Neural Comput. 16:1299–1323. [DOI] [PubMed] [Google Scholar]
- Lauronen L, Nevalainen P, Pihko E. 2012. Magnetoencephalography in neonatology. Neurophysiol Clin. 42:27–34. [DOI] [PubMed] [Google Scholar]
- Lenard HG, Schulte FJ, Eichhorn W, Meyer S, Busse C. 1977. Development of sensory functions in premature infants in the 1st weeks of life. Monatsschr Kinderheilkunde. 125:383–385. [PubMed] [Google Scholar]
- Lopez-Larson MP, King JB, Terry J, McGlade EC, Yurgelun-Todd D. 2012. Reduced insular volume in attention deficit hyperactivity disorder. Psychiatry Res. 204:32–39. [DOI] [PMC free article] [PubMed] [Google Scholar]
- Menon V, Uddin LQ. 2010. Saliency, switching, attention and control: a network model of insula function. Brain Struct Funct. 214:655–667. [DOI] [PMC free article] [PubMed] [Google Scholar]
- Mesulam MM, Mufson EJ. 1982. Insula of the old world monkey. I. Architectonics in the insulo-orbito-temporal component of the paralimbic brain. J Comp Neurol. 212:1–22. [DOI] [PubMed] [Google Scholar]
- Mutschler I, Wieckhorst B, Kowalevski S, Derix J, Wentlandt J, Schulze-Bonhage A, Ball T. 2009. Functional organization of the human anterior insular cortex. Neurosci Lett. 457:66–70. [DOI] [PubMed] [Google Scholar]
- Nanetti L, Cerliani L, Gazzola V, Renken R, Keysers C. 2009. Group analyses of connectivity-based cortical parcellation using repeated k-means clustering. Neuroimage. 47:1666–1677. [DOI] [PubMed] [Google Scholar]
- Nelson SM, Dosenbach NU, Cohen AL, Wheeler ME, Schlaggar BL, Petersen SE. 2010. Role of the anterior insula in task-level control and focal attention. Brain Struct Funct. 214:669–680. [DOI] [PMC free article] [PubMed] [Google Scholar]
- Nieuwenhuys R. 2012. The insular cortex: a review. Prog Brain Res. 195:123–163. [DOI] [PubMed] [Google Scholar]
- Noel X, Brevers D, Bechara A. 2013. A neurocognitive approach to understanding the neurobiology of addiction. Curr Opin Neurobiol. 23:632–638. [DOI] [PMC free article] [PubMed] [Google Scholar]
- Palaniyappan L, Mallikarjun P, Joseph V, Liddle PF. 2011. Appreciating symptoms and deficits in schizophrenia: right posterior insula and poor insight. Prog Neuropsychopharmacol Biol Psychiatry. 35:523–527. [DOI] [PubMed] [Google Scholar]
- Pinheiro J, Bates D, DebRoy S, Sarkar D, Team RDC. 2013. NLME: Linear and Nonlinear Mixed Effects Models.
- Power JD, Barnes KA, Snyder AZ, Schlaggar BL, Petersen SE. 2012. Spurious but systematic correlations in functional connectivity MRI networks arise from subject motion. Neuroimage. 59:2142–2154. [DOI] [PMC free article] [PubMed] [Google Scholar]
- Power JD, Cohen AL, Nelson SM, Wig GS, Barnes KA, Church JA, Vogel AC, Laumann TO, Miezin FM, Schlaggar BL, et al. 2011. Functional network organization of the human brain. Neuron. 72:665–678. [DOI] [PMC free article] [PubMed] [Google Scholar]
- Ray S, Turi RH. 1999. Determination of number of clusters in K-means clustering and application in colour image segmentation. In: Pal NR, De AK, Das J, editors. 4th International Conference on Advances in Pattern Recognition and Digital Techniques Calcuta, India: Narosa Publishing House p 137–143. [Google Scholar]
- Rivera C, Voipio J, Payne JA, Ruusuvuori E, Lahtinen H, Lamsa K, Pirvola U, Saarma M, Kaila K. 1999. The K+/Cl− co-transporter KCC2 renders GABA hyperpolarizing during neuronal maturation. Nature. 397:251–255. [DOI] [PubMed] [Google Scholar]
- Roche-Labarbe N, Fenoglio A, Radhakrishnan H, Kocienski-Filip M, Carp SA, Dubb J, Boas DA, Grant PE, Franceschini MA. 2013. Somatosensory evoked changes in cerebral oxygen consumption measured non-invasively in premature neonates. Neuroimage. http://dx.doi.org/10.1016/j.neuroimage.2013.01.035. [DOI] [PMC free article] [PubMed] [Google Scholar]
- Rubinov M, Sporns O. 2010. Complex network measures of brain connectivity: uses and interpretations. Neuroimage. 52:1059–1069. [DOI] [PubMed] [Google Scholar]
- Santillo AF, Nilsson C, Englund E. 2013. Von Economo neurons are selectively targeted in frontotemporal dementia. Neuropathol Appl Neurobiol. 39:572–579. [DOI] [PMC free article] [PubMed] [Google Scholar]
- Seeley WW. 2010. Anterior insula degeneration in frontotemporal dementia. Brain Struct Funct. 214:465–475. [DOI] [PMC free article] [PubMed] [Google Scholar]
- Seeley WW, Menon V, Schatzberg AF, Keller J, Glover GH, Kenna H, Reiss AL, Greicius MD. 2007. Dissociable intrinsic connectivity networks for salience processing and executive control. J Neurosci. 27:2349–2356. [DOI] [PMC free article] [PubMed] [Google Scholar]
- Shen D, Davatzikos C. 2004. Measuring temporal morphological changes robustly in brain MR images via 4-dimensional template warping. Neuroimage. 21:1508–1517. [DOI] [PubMed] [Google Scholar]
- Shibata M, Fuchino Y, Naoi N, Kohno S, Kawai M, Okanoya K, Myowa-Yamakoshi M. 2012. Broad cortical activation in response to tactile stimulation in newborns. Neuroreport. 23:373–377. [DOI] [PubMed] [Google Scholar]
- Short SJ, Elison JT, Goldman BD, Styner M, Gu H, Connelly M, Maltbie E, Woolson S, Lin W, Gerig G, et al. 2013. Associations between white matter microstructure and infants’ working memory. Neuroimage. 64:156–166. [DOI] [PMC free article] [PubMed] [Google Scholar]
- Showers MJ, Lauer EW. 1961. Somatovisceral motor patterns in the insula. J Comp Neurol. 117:107–115. [DOI] [PubMed] [Google Scholar]
- Smith SM, Jenkinson M, Woolrich MW, Beckmann CF, Behrens TE, Johansen-Berg H, Bannister PR, De Luca M, Drobnjak I, Flitney DE, et al. 2004. Advances in functional and structural MR image analysis and implementation as FSL. Neuroimage. 23(Suppl 1):S208–S219. [DOI] [PubMed] [Google Scholar]
- Starr CJ, Sawaki L, Wittenberg GF, Burdette JH, Oshiro Y, Quevedo AS, Coghill RC. 2009. Roles of the insular cortex in the modulation of pain: insights from brain lesions. J Neurosci. 29:2684–2694. [DOI] [PMC free article] [PubMed] [Google Scholar]
- Steriade M. 2006. Grouping of brain rhythms in corticothalamic systems. Neuroscience. 137:1087–1106. [DOI] [PubMed] [Google Scholar]
- Streeter GL. 1912. The development of the nervous system. Philadelphia: Lippincott. [Google Scholar]
- Tau GZ, Peterson BS. 2010. Normal development of brain circuits. Neuropsychopharmacology. 35:147–168. [DOI] [PMC free article] [PubMed] [Google Scholar]
- Tomasi D, Volkow ND. 2012. Abnormal functional connectivity in children with attention-deficit/hyperactivity disorder. Biol Psychiatry. 71:443–450. [DOI] [PMC free article] [PubMed] [Google Scholar]
- Tzourio-Mazoyer N, Landeau B, Papathanassiou D, Crivello F, Etard O, Delcroix N, Mazoyer B, Joliot M. 2002. Automated anatomical labeling of activations in SPM using a macroscopic anatomical parcellation of the MNI MRI single-subject brain. Neuroimage. 15:273–289. [DOI] [PubMed] [Google Scholar]
- Uddin LQ, Menon V. 2009. The anterior insula in autism: under-connected and under-examined. Neurosci Biobehav Rev. 33:1198–1203. [DOI] [PMC free article] [PubMed] [Google Scholar]
- Vanhatalo S, Kaila K. 2006. Development of neonatal EEG activity: from phenomenology to physiology. Semin Fetal Neonatal Med. 11:471–478. [DOI] [PubMed] [Google Scholar]
- Varendi H, Porter RH. 2001. Breast odour as the only maternal stimulus elicits crawling towards the odour source. Acta Paediatr. 90:372–375. [PubMed] [Google Scholar]
- Vincent JL, Patel GH, Fox MD, Snyder AZ, Baker JT, Van Essen DC, Zempel JM, Snyder LH, Corbetta M, Raichle ME. 2007. Intrinsic functional architecture in the anaesthetized monkey brain. Nature. 447:83–86. [DOI] [PubMed] [Google Scholar]
- von dem Hagen EA, Stoyanova RS, Baron-Cohen S, Calder AJ. 2013. Reduced functional connectivity within and between ‘social’ resting state networks in autism spectrum conditions. Soc Cogn Affect Neurosci. 8:694–701. [DOI] [PMC free article] [PubMed] [Google Scholar]
- Yeo BT, Krienen FM, Sepulcre J, Sabuncu MR, Lashkari D, Hollinshead M, Roffman JL, Smoller JW, Zollei L, Polimeni JR, et al. 2011. The organization of the human cerebral cortex estimated by intrinsic functional connectivity. J Neurophysiol. 106:1125–1165. [DOI] [PMC free article] [PubMed] [Google Scholar]
- Yu D. 2013. Additional brain functional network in adults with attention-deficit/hyperactivity disorder: a phase synchrony analysis. PLoS One. 8:e54516. [DOI] [PMC free article] [PubMed] [Google Scholar]
Associated Data
This section collects any data citations, data availability statements, or supplementary materials included in this article.