

Abstract
As auxiliary subunits of voltage-gated Ca2+ channels, the α2δ proteins modulate membrane trafficking of the channels and their localization to specific presynaptic sites. Following nerve injury, upregulation of the α2δ-1 subunit in sensory dorsal root ganglion neurons contributes to the generation of chronic pain states; however, very little is known about the underlying molecular mechanisms. Here we show that the increased expression of α2δ-1 in rat sensory neurons leads to prolonged Ca2+ responses evoked by membrane depolarization. This mechanism is coupled to CaV2.2 channel-mediated responses, as it is blocked by a ω-conotoxin GVIA application. Once initiated, the prolonged Ca2+ transients are not dependent on extracellular Ca2+ and do not require Ca2+ release from the endoplasmic reticulum. The selective inhibition of mitochondrial Ca2+ uptake demonstrates that α2δ-1-mediated prolonged Ca2+ signals are buffered by mitochondria, preferentially activated by Ca2+ influx through CaV2.2 channels. Thus, by controlling channel abundance at the plasma membrane, the α2δ-1 subunit has a major impact on the organization of depolarization-induced intracellular Ca2+ signaling in dorsal root ganglion neurons.
Introduction
Calcium-activated signaling pathways underlie multiple cellular processes operating through complex spatial structures and a wide time range (Berridge et al., 2003). A tight balance between extracellular and intracellular calcium sources contributes to calcium dynamics in neurons where voltage-gated calcium channels (VGCCs) constitute the main regulators of calcium entry in response to membrane depolarization (Berridge, 1998). VGCCs are characterized by a pore-forming α1 subunit associated with two accessory proteins, a cytosolic β subunit, and a membrane-anchored α2δ subunit (Bauer et al., 2010). α2δ subunits modulate calcium channel current kinetics and also increase trafficking of the channel to the plasma membrane (Dolphin, 2012; Cassidy et al., 2014). Recent findings indicate that α2δ proteins are crucial determinants of VGCC abundance at presynaptic terminals (Hoppa et al., 2012); thus, the overexpression of this subunit in hippocampal neurons promoted calcium channel localization at active zones, leading to an increase in vesicular release.
In sensory neurons, α2δ-1 function has been associated with mechanisms for generation and maintenance of chronic pain. Peripheral nerve injury models of neuropathic pain in rodents resulted in a significant upregulation of α2δ-1 protein levels in cell bodies and axon terminals of dorsal root ganglion (DRG) neurons, with a consequent accumulation of presynaptic α2δ-1 protein in the dorsal horn of the spinal cord (Bauer et al., 2009). Conversely, damaged DRGs displayed no change in CaV2.2 mRNA or protein, which is the main VGCC type in sensory neurons (Xiao et al., 2002; Li et al., 2006). Although still debated, it is likely that the increased expression of α2δ-1 subunit induced by nerve injury may increase VGCC trafficking toward the cell surface and presynaptic terminals. In-line with this hypothesis, experiments performed in transgenic mice overexpressing α2δ-1 showed enhanced calcium currents recorded in DRG neurons, as well as nociceptive behavior characterized by hyperalgesia (Li et al., 2006). By contrast α2δ-1 knock-out mice had reduced DRG calcium currents and lower baseline mechanical sensitivity (Patel et al., 2013).
DRG neurons exhibit diverse patterns for the regulation of intracellular calcium (Lu et al., 2006), among which the endoplasmic reticulum (ER) and mitochondria are the main contributors to activity-induced calcium increase (Fernyhough and Calcutt, 2010). The ER amplifies Ca2+ influx triggered by mild depolarization and promotes the propagation of a signal to the nucleus (Usachev and Thayer, 1997; Berridge, 1998), whereas mitochondria buffer high Ca2+ loads (Colegrove et al., 2000) particularly at synaptic terminals (Medvedeva et al., 2008). In this study, we show that the α2δ-1 subunit has a key role in regulating the handling of intracellular calcium in sensory neurons. The overexpression of α2δ-1 induces an upregulation of surface VGCCs and prolongs intracellular Ca2+ signals evoked by depolarization. Using pharmacological and genetic tools, we demonstrate that these sustained responses are mediated by augmented mitochondrial Ca2+ buffering of cytoplasmic Ca2+ increase induced by N-type channels.
Materials and Methods
DNA constructs.
The cDNAs used in this study were as follows: α2δ-1 HA (Kadurin et al., 2012) α2δ-1 MIDASAAA HA (Hoppa et al., 2012), HA CaV2.2 (Cassidy et al., 2014), and ratiometric Pericam (Nagai et al., 2001) expressed in pcDNA3.0; pEYFP, pECFP and pdsRed2-Mito (Clontech), pcDNA3.1 MCUD260N,E263Q-FLAG and MCU–FLAG (Raffaello et al., 2013), pRK5 β1b, and Kir2.1-AAA (Tinker et al., 1996).
Reagents.
Fura-2AM was purchased from Invitrogen, ω-conotoxin GVIA from Alomone. Nifedipine, cyclopiazonic acid (CPA), antimycin, and oligomycin were obtained from Sigma-Aldrich.
Neuronal culture and transfection.
DRGs were isolated from P10 Sprague-Dawley rats of either sex. DRGs were dissociated in Hank's basal salt solution containing 5 mg/ml dispase (Invitrogen), 2 mg/ml collagenase (Worthington Biochemical), and 0.1 mg/ml DNase (Invitrogen) at 37°C for 30 min in a shaking water bath. Neuronal suspension was transfected by nucleofection following the manufacturer's instructions (Program G-13, Lonza). To improve cell viability after transfection, neurons were incubated in RPMI medium (Invitrogen) supplemented with 10% FBS (fetal bovine serum) and NGF (nerve growth factor; 50 ng/ml, Invitrogen) for 8 min at 37°C. DRGs were then plated on poly-l-lysine-coated coverslips (0.25 mg/ml, Sigma-Aldrich) and cultured in DMEM-F12 (Invitrogen) containing 10% FBS and 50 ng/ml NGF. α2δ-1 HA cDNA was cotransfected with eCFP or eYFP in a 4:1 ratio (2 μg of total DNA). For the coexpression of α2δ-1 HA, MCUD260N,E263Q-FLAG, and eYFP cDNAs, the ratio used was 4:3:1. In control conditions, α2δ-1 HA cDNA was replaced with an equivalent volume of empty vector. In live labeling experiments, control neurons were transfected with a control cDNA (Kir2.1-AAA cDNA encoding a nonfunctional potassium channel).
Calcium imaging.
Calcium imaging was performed on somata of small (≤25 μm) and medium (26–35 μm) DRGs, 40 h after transfection. Neurons were loaded with Fura-2-AM or Fura-FF-AM in DMEM-F12 medium supplemented with 2% FBS for 20 min at 37°C and washed for 5 min with bathing solution containing the following (in mm: 145 NaCl, 5 KCl, 2 CaCl2, 1 MgSO4, 10 HEPES, 10 Glucose, pH 7.4) and placed in a recording chamber under continuous superfusion (flow rate of 2.5–3 ml/min). Ca2+-free experiments were performed using a solution corresponding to the normal extracellular solution modified by the omission of CaCl2, the addition of 0.1 mm EGTA and 2 mm MgCl2 (Lu et al., 2006). Fura-2 and Fura-FF-loaded neurons were visualized on 20× objective with a Zeiss Axiovert 200M inverted microscope. Data were acquired using two imaging systems: Improvision Volocity software connected to a CCD camera (ORCA-ER; Hamamatsu Photonics) or MetaFluor Fluorescence Ratio Imaging Software (Cairn Research) via an iXon Ultra 897 camera (Andor Technology). Fura-2 excitation wavelengths at 340 and 380 nm were controlled either by a filter wheel or via an Optoscan monochromator (Cairn Research). Dual excitation filter at 340 and 380 nm, 400 nm dichroic mirror, and emission at 510/80 nm were purchased from Chroma Technology. Ratio signals were sampled at 0.5–1 Hz. Fluorescence was quantified within a region-of-interest after background subtraction. After confirmation of a stable baseline, neurons were depolarized by high K+ (50 or 100 mm, 10 s) or field stimulation (10 or 100 Hz). A positive response was defined as a 50% fluorescence increase with respect to the baseline. Only one field of neurons was recorded from each coverslip. No difference in the percentage of responding neurons was detected between control (41.5 ± 6.1%, total n = 86) and α2δ-1 neurons (48.7 ± 5.8%, total n = 96; p = 0.4, t test). Peak amplitude was measured as the maximal signal observed within 20 s after depolarization, whereas the duration of a response was determined as the width at 25% of the maximal signal. For measurement of mitochondrial Ca2+, DRG neurons were transfected with ratiometric mtPericam (Nagai et al., 2001) and visualized on a 40× oil-immersion objective. The mitochondrial Ca2+ probe was excited at the pH insensitive wavelength of 380 nm using the Fura-2 excitation filter as described previously (Akimzhanov and Boehning, 2011). [Ca2+]mt was measured as −(F − F0)/F0 (Shutov et al., 2013) where F is the fluorescence at 380 nm and F0 is the baseline fluorescence acquired before stimulation. Images were acquired at 1 Hz. Positively transfected neurons were identified by eYFP or mcherry fluorescence in Fura-2 or mtPericam imaging experiments respectively.
Neuron replating.
To remove neurite outgrowths and improve control of membrane potential in voltage-clamp experiments, neurons were replated as previously described (Page et al., 2010). Briefly, cells were incubated in a collagenase solution (0.2 mg/ml in serum free DMEM-F12) at 37°C for 10 min. Neurons were then resuspended in DMEM-F12/FBS and plated on poly-l-lysine-coated coverslips. Voltage-clamp experiments were performed 2–6 h after replating.
Electrophysiology.
As for calcium imaging, whole-cell voltage-clamp experiments were performed in small (<19 pF) and medium (20–38 pF) DRG neurons. Recordings were performed with Axopatch 200A amplifier (Molecular Devices) and analyzed with pClamp 9.0 software (Molecular Devices). Whole-cell voltage-clamp recordings were sampled at 10 kHz frequency, filtered at 2 kHz and digitized at 1 kHz. 80–85% series resistance compensation was applied and all recorded currents were leak subtracted using P/4 protocol. The extracellular solution for recording Ba2+ currents contained the following (in mm): 10 BaCl2, 150 TEABr, 3 KCl, 1 NaHCO3, 1 MgCl2, 10 HEPES, 4 glucose, 0.001 TTX, pH 7.4, 320 mOsm. The patch internal solution contained the following (in mm): 140 Cs aspartate, 5 EGTA, 2 MgCl2, 0.1 CaCl2, 2 K2ATP, 10 HEPES, pH 7.2, 292 mOsm. Membrane potential was held at −90 mV. For current-clamp experiments, the following solutions were used: extracellular (in mm): 145 NaCl, 5 KCl, 2 CaCl2, 1 MgSO4, 10 HEPES, and 10 glucose, pH 7.4, 316 mOsm; internal (in mm): 130 KCl, 10 EGTA, 10 HEPES, 8 NaCl, 4 Mg-ATP, 1 MgCl2, 1 CaCl2, 0.4 Na2-GTP, pH 7.25 adjusted with 1 m KOH, 318 mOsm. Recording pipettes had access resistance of 1–4 MΩ. For recordings performed in the presence of CTX, the drug was superfused for 100 s at 1 μm concentration. Currents were measured before and after drug application at 6 ms after the start of a 15 mV test pulse.
Immunocytochemistry.
For live labeling experiments DRG cultures were incubated with a monoclonal anti-HA antibody (rat, 1:250; Roche) for 1 h at 37°C in bathing solution. This procedure, followed by cell fixation and application of a secondary antibody in nonpermeabilizing conditions, allowed the labeling of plasma membrane α2δ-1 HA subunits without contamination from intracellular proteins. Briefly, after primary antibody incubation neurons were fixed with 4% PFA in PBS for 5 min and then blocked for 30–60 min with PBS supplemented with 10% goat serum. AlexaFluor-conjugated secondary antibody (1:500, Invitrogen) was incubated for 1 h at RT. For detection of intracellular proteins following surface labeling, neurons were permeabilized with 0.1% Triton for 8 min and then incubated with a primary antibody (1 h at RT). Samples were mounted on slides using Vectashield (Vector Laboratories) to reduce photobleaching. Imaging was performed using a confocal laser-scanning microscope (Zeiss) and a 40× oil-immersion objective. Optical sections of 1 μm thickness were acquired for each channel.
The approximate transfection efficiency of the α2δ-1 HA subunit in DRG neurons was quantified by staining with an antibody against the HA epitope to be 32%, (n = 124 cells examined); this corresponded to an α2δ-1 expression increase of 160 ± 30% (n = 139) compared with control endogenous proteins labeled with α2δ-1 antibody (n = 142).
For quantitative analysis of neurite outgrowth patterns, live-labeled neurons were scored with respect to neurite length (average length of two longest neurites) and branching (average number of neuritic branch points per neurite length). The analysis was performed using NeuronJ software (Meijering et al., 2004).
Mitochondrial time lapse imaging.
Neurons were transfected with eCFP, pdsRed2-Mito, α2δ-1 HA, or α2δ-1MIDASAAA HA cDNAs in a 1:1:4 ratio. Forty hours after transfection, cultures were imaged at 37°C in bathing solution. Images were acquired every 2 s for 10 min. The percentage of moving mitochondria was analyzed in the distal part of neurites (100–150 μm from the soma). Before electrical stimulation (100 Hz, 10 s) neurons were imaged for 3 min in resting conditions. Mitochondria were defined as moving if they moved >1 μm in 1 min. Kymograph analysis was performed using ImageJ software as previously described (Macaskill et al., 2009). Kymographs were generated from live-imaging movies of 3 min before and after field stimulation. Moving mitochondria were identified using Manual Tracker plugin from ImageJ.
Western blotting.
DRG cultures transfected with eCFP (2 μg) or α2δ-1 HA (2 μg) cDNAs were harvested in buffer A (50 mm Tris, pH7.5, 50 mm NaCl, and protease inhibitors; Complete, Roche). Neuronal suspensions were centrifuged at 60,000 × g for 1 h at 4°C. Pellets were lysed for 40 min at 4°C in buffer A supplemented with 1% Igepal and then centrifuged at 14,000 × g for 30 min at 4°C. Lysates were resolved by SDS-Page (3–8% NuPage Tris/acetate gels, Invitrogen), transferred to PVDF membranes and probed with antibodies to α2δ-1 (mouse, 1:2000; Sigma-Aldrich) and β-tubulin III (rabbit, 1:2000; Sigma-Aldrich). Optical density quantification was performed with ImageJ. In every sample, the α2δ-1 signal was normalized with respect to β-tubulin III content.
Statistical analysis.
Data were analyzed with GraphPad Prism 4.0 software or Origin7 (OriginLab). All data are shown as mean ± SEM; “n” refers to number of cells, unless indicated otherwise. The statistical significance between two groups was assessed by t test or Mann–Whitney U test. One-way ANOVA was used for comparison of means between three or more groups and two-way ANOVA to analyze the effect of two variables on an experimental response.
Results
Characterization of α2δ-1 HA overexpressing neurons
α2δ-1 Protein was overexpressed by nucleofection (Karra and Dahm, 2010) in DRG cultures obtained from postnatal rats. This in vitro model preserved most neuronal properties displayed by DRGs in vivo (Wood et al., 1988). To identify the expression of exogenous α2δ-1 protein we used a construct engineered with an extracellular HA tag throughout these studies (α2δ-1 HA; Kadurin et al., 2012). Exogenous α2δ-1 HA subunits were found to be well expressed and localized at the cell surface in DRG cell bodies and neurites visualized with free eCFP (Fig. 1A). Upon transfection, the total expression of α2δ-1 protein in neuronal lysates was increased by 63 ± 27% with respect to the control, as quantified by Western blotting (Fig. 1B, right; p = 0.02, Mann–Whitney U test). Overexpressed α2δ-1 protein was also identified by an HA antibody (Fig. 1B, left). To examine whether α2δ-1 transfection might affect neuronal morphology, we analyzed neurite outgrowth in control and α2δ-1 HA overexpressing neurons (see Materials and Methods). No difference in neurite length (control: 106.4 ± 11.2 μm, n = 8; α2δ-1 HA: 108.2 ± 15.7 μm n = 6; p = 0.92, t test) or number of branch points (control: 0.013 ± 0.004 μm−1, α2δ-1 HA: 0.010 ± 0.002 μm−1; p = 0.52, t test) were measured between control and α2δ-1 overexpressing DRGs.
Figure 1.
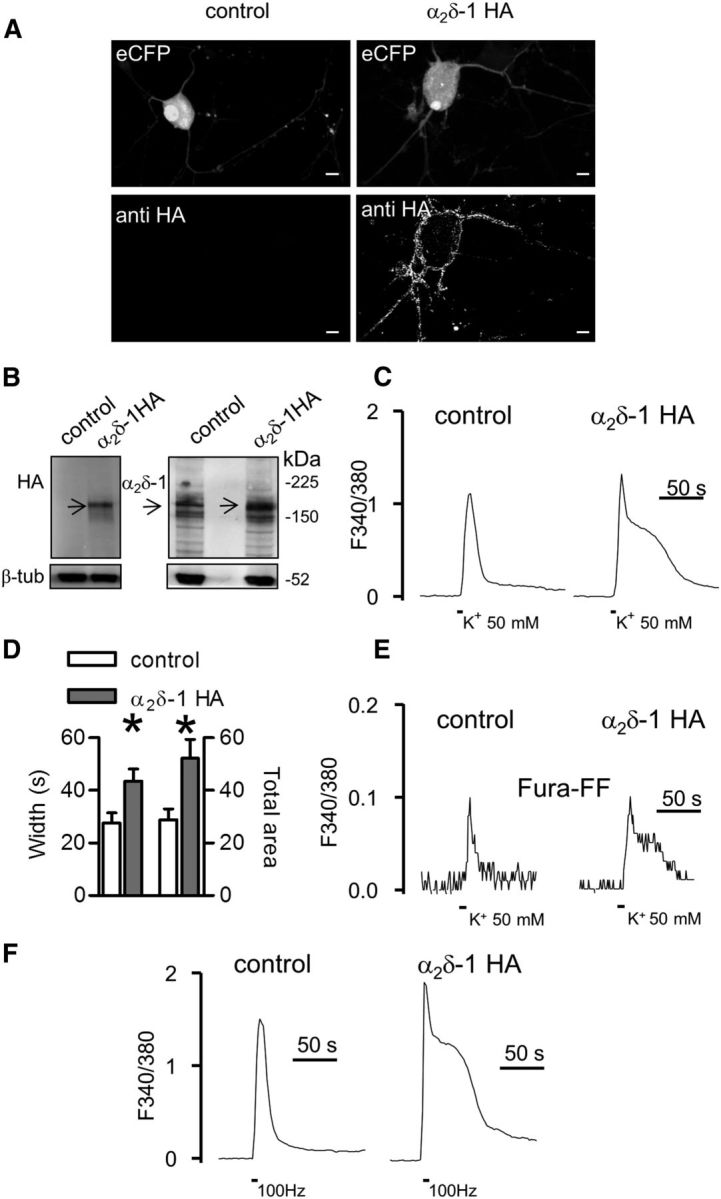
α2δ-1 HA overexpression modulates Ca2+ response duration in DRG neuron cultures. A, 3D projection from z-stacks of confocal images of a DRG neuron transfected with α2δ-1 HA and eCFP (right) or eCFP and nonfunctional Kir2.1-AAA cDNAs (left). Exogenous α2δ-1 HA proteins were detected at the cell surface by live labeling (n = 6 experiments). No staining for the HA epitope was observed in neurons expressing eCFP only. Scale bars, 10 μm. B, Western blotting of neuronal lysates of eCFP or α2δ-1 HA transfected DRGs. Lysates were loaded in duplicate and the membrane was probed for HA (left) or α2δ-1 subunit expression. The neuronal content was quantified by β tubulin III (β-tub) staining (n = 8 DRG cultures, 4 gels). C, Fura-2 imaging of high K+-evoked Ca2+ transients performed in control (left; representative of n = 19) and α2δ-1 HA overexpressing neurons (right; representative of n = 24). Traces are shown after baseline subtraction. D, Control, open bars; α2δ-1 HA, gray bars. The width and total area of transients were significantly higher in α2δ-1 HA overexpressing neurons with respect to control DRGs (*p = 0.01, t test). E, Representative Fura-FF transients imaged in control (n = 11) and α2δ-1 HA neurons (n = 7). F, Examples of Ca2+ transients induced by field stimulation (100 Hz, 10 s) of control (left) and α2δ-1 HA DRGs (right).
Next we addressed the impact of α2δ-1 HA overexpression on Ca2+ entry. DRGs are a heterogeneous population of neurons, where function correlates with cell size (Basbaum et al., 2009). For this reason we focused our functional studies on the two major classes of nociceptors corresponding to small (<25 μm) and medium (25–35 μm) diameter DRG neurons, which are known to give rise respectively to C and Aδ afferent sensory fibers (Julius and Basbaum, 2001). We performed Fura-2 imaging on DRG cultures depolarized by a 10 s application of high (50 mm) K+. Table 1 summarizes some electrophysiological properties measured in current-clamp recordings before and during high K+ application to transfected neurons. Figure 1C shows representative high K+-evoked Ca2+ transients imaged 40–48 h after transfection in control and α2δ-1 overexpressing DRG neurons. The peak of the response was unaltered by α2δ-1 HA overexpression (controlF340/380: 2.03 ± 0.12, n = 19; α2δ-1 HAF340/380: 2.37 ± 0.16, n = 24; p = 0.13), although in these neurons the Ca2+ signals displayed a slower recovery after the peak, leading to a prolonged Ca2+ rise (“Ca2+ hump”; Fig. 1C, right trace). There was a significant increase of both response width and total area (Fig. 1D) of high K+-evoked Ca2+ transients in α2δ-1 HA overexpressing DRGs compared with control neurons. As shown in Figure 1E, a slower recovery of the response in α2δ-1 HA overexpressing neurons was also observed in the presence of the lower affinity Ca2+ dye, Fura-FF.
Table 1.
Electrophysiological properties of control and α2δ-1 DRGs
| Parameters | Control |
α2δ-1 |
p |
|---|---|---|---|
| (n = 26) | (n = 31) | (t test) | |
| Vrest (mv) | −58.9 ± 0.8 | −56.7 ± 1.0 | 0.1 |
| VK+ (mv) | −18.4 ± 0.7 | −17.7 ± 0.6 | 0.4 |
| AP | 4.5 (2, 8) | 6.0 (4, 9) | 0.9 |
Vrest, Resting membrane potential; VK+, membrane potential during 50 mm K+; AP, median number of action potentials (25 and 75% percentile).
A similar modulation of Ca2+ signals was observed when cultures were field-stimulated at 100 Hz for 10 s. As illustrated in Figure 1F, intense electrical stimulation induced an extended Ca2+ rise in neurons transfected with α2δ-1 HA (55 ± 7 s, n = 10), but not in the control neurons (32 ± 8 s, n = 7; p = 0.04, t test). By contrast, no change in response width was detected when neurons were stimulated at a lower (10 Hz) frequency (control: 37.6 ± 5.8 s, n = 18; α2δ-1 HA DRGs: 41.1 ± 4.3 s, n = 18; p = 0.63, t test), indicating that the α2δ-1-mediated Ca2+ hump depended on a sustained activation of VGCCs.
Mutation of the extracellular MIDAS motif prevents α2δ-1 HA effects on Ca2+ signals
α2δ Subunits are characterized by a conserved von Willebrand A domain (VWA), which mediates the interaction with extracellular proteins through the metal-ion-dependent adhesion site motif (MIDAS). This consensus sequence is involved in the coordination of divalent cations and has been found to be essential for the ability of α2δ-1 and α2δ-2 to modulate VGCC function (Cantí et al., 2005; Hoppa et al., 2012) and trafficking (Cassidy et al., 2014). We transfected DRG neurons with an α2δ-1 construct carrying three point mutations within the MIDAS motif (α2δ-1 MIDASAAA HA; Hoppa et al., 2012) and examined the effect of the mutant subunit overexpression on Ca2+ signaling. First we monitored α2δ-1 MIDASAAA HA protein expression in DRG cultures using a combined staining of the cell surface via live labeling, followed by detection of intracellular α2δ-1 HA after cell permeabilization (Fig. 2A). Figure 2B quantifies the ratio between surface and cytosolic HA staining in α2δ-1 HA and α2δ-1 MIDASAAA HA transfected neurons. There was a marked reduction of surface expression of α2δ-1 MIDASAAA compared with wild-type α2δ-1 whereas the expression of intracellular α2δ-1 was unchanged in the examined cells (intra α2δ-1 HA: 85.4 ± 15.1 A.U., n = 9; intra α2δ-1 MIDASAAA HA: 79.8 ± 19.7 A.U., n = 5; p = 0. 82, t test).
Figure 2.

Expression of α2δ-1 MIDASAAA HA in DRG cultures. A, Confocal images of DRG neurons transfected with α2δ-1 HA or α2δ-1 MIDASAAA HA subunits. Top, Cell surface HA (Surf HA). Scale bar, 10 μm. Positively transfected neurons were identified following detection of intracellular HA-tagged proteins (intra HA, bottom). B, Quantification of surface HA fluorescence for wild-type α2δ-1 HA overexpressing neurons (gray bar; n = 9) and α2δ-1 MIDASAAA HA (checked bar; n = 5). Membrane HA signal was normalized against the intracellular HA content (*p = 0.01, Mann–Whitney test). C, Examples of families of IBa current traces for control, α2δ-1 HA and α2δ-1 MIDASAAA HA overexpressing DRG neurons. Currents were evoked from −90 mV holding potential in 5 mV steps from −40 to + 70 mV. The scale bars refer to all panels. D, Calcium channel current density-voltage relationship for control (□; n = 36), α2δ-1 HA (●; n = 32) and α2δ-1 MIDASAAA HA (▴; n = 16). In each experiment, current density (pA/pF) recorded in wild-type and mutant α2δ-1 HA overexpressing DRGs was normalized with respect to the control condition. At +10 and +15 mV, the current density of α2δ-1 HA overexpressing DRGs was significantly higher than the control condition (p = 0.02 one-way ANOVA and Dunnett's test, *p < 0.05). E, Example of high K+-evoked Ca2+ transients in control neurons (left), wild-type α2δ-1 HA (middle), and α2δ-1 MIDASAAA HA (right) overexpressing DRG neurons. F, α2δ-1 HA neurons (gray bar; n = 15) showed a prolonged response duration with respect to α2δ-1 MIDASAAA HA (checked bar; n = 15) and control (open bar; n = 15) DRGs (p = 0.006 one-way ANOVA and Bonferroni post hoc test; *p < 0.05, **p < 0.01).
In-line with previous findings (Cantí et al., 2005; Hoppa et al., 2012), patch-clamp experiments confirmed that α2δ-1 MIDASAAA was unable to potentiate Ca2+ current density, whereas the overexpression of wild-type α2δ-1 strongly increased current density (Fig. 2C,D). When we examined the impact of the MIDAS mutation on intracellular Ca2+ signals we found that overexpression of α2δ-1 MIDASAAA HA did not alter the shape of Ca2+ transients (Fig. 2E), producing responses with a duration similar to the control group and with faster recovery compared with wild-type α2δ-1 HA overexpressing neurons (Fig. 2F). These results suggest that the presence of a functional α2δ-1 subunit at the cell surface is critical for its regulatory role on neuronal Ca2+ pathways.
Role of CaV2.2 channels in α2δ-1 HA mediated prolongation of Ca2+ signals
DRG neurons express a number of different VGCC subtypes and CaV2.2 (N-type) channels represent the main contributors to membrane depolarization-induced calcium influx (Scroggs and Fox, 1992; Bell et al., 2004). To investigate the influence of the different VGCCs on Ca2+ responses shaped by α2δ-1 HA overexpression, we performed Fura-2 imaging in the presence of ω-conotoxin GVIA (CTX, 1 μm) or nifedipine (Nif, 1 μm), which are respectively N- and L-type (CaV1) channel blockers (Fig. 3A–F). As shown in Figure 3A,D, the peak amplitude of high K+-evoked Ca2+ transients of both control and α2δ-1 overexpressing neurons was reduced by 15 min pretreatment with CTX. Moreover in α2δ-1 HA overexpressing DRGs, the block of CaV2.2 channels abolished the prolongation of the Ca2+ signals (Fig. 3F). By contrast, in control neurons, CTX application had no effect on response width (Fig. 3C), suggesting that CaV2.2 channels are involved in α2δ-1 modulation of the Ca2+ increase. Also we observed that CaV1 family channels were not critical for the generation of responses evoked by 50 mm K+, because continuous superfusion of DRG cultures with nifedipine did not change the shape of the Ca2+ transient, either in control (Fig. 3B,C) or in α2δ-1 HA overexpressing neurons (Fig. 3E,F). Thus the contribution of CaV2.2 channels in response to a strong depolarization is much greater than the CaV1 channel contribution to intracellular Ca2+ signals in DRG somata, as previously described for sympathetic neurons (Wheeler et al., 2012).
Figure 3.
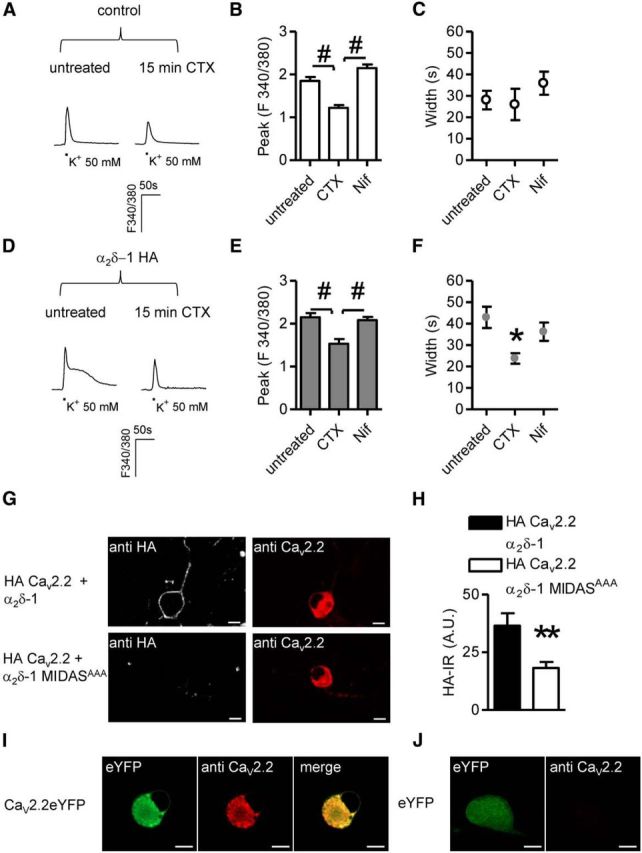
CaV2.2-mediated signaling in α2δ-1 neurons. A, Imaging of high K+-evoked Ca2+ transients in control DRG neurons pretreated for 15 min with 1 μm CTX. B, In control DRG neurons, in the absence of α2δ-1 HA overexpression CTX application (n = 7) decreased the peak amplitude of responses with respect to untreated (n = 21) and Nif (1 μm; n = 13) samples (p < 0.0001 one-way ANOVA and Bonferroni post hoc test, #p < 0.001). C, Inhibition of N- and L-type channels did not alter the width of signals imaged in control neurons (p = 0.4, one-way ANOVA). D, Examples of Ca2+ responses evoked in α2δ-1 HA overexpressing neurons in the absence (left) or presence (right) of CTX. E, CTX pretreatment (n = 12) diminished the intensity of signals in α2δ-1 HA overexpressing DRG neurons compared with responses obtained in untreated (n = 19) or Nif-treated (n = 19) DRGs (p = 0.0001 one-way ANOVA and Bonferroni post hoc test, #p < 0.001). F, Prolonged high K+-evoked Ca2+ transients were abolished following CTX pretreatment (p = 0.02 one-way ANOVA and Bonferroni post hoc test, *p < 0.05). G, Overexpression in DRG neurons of exofacially HA-tagged CaV2.2, β1B subunits and either α2δ-1 (top) or α2δ-1 MIDASAAA (bottom). Surface and intracellular detection of HA CaV2.2 proteins was performed by staining the HA epitope in nonpermeabilizing conditions and intracellular labeling with an anti CaV2.2 antibody, respectively. Scale bars, 10 μm. H, Quantification of surface HA staining in HA CaV2.2/α2δ-1/β1B (black bar; n = 32) or HA CaV2.2/α2δ-1 MIDASAAA/β1B (white bar; n = 36) transfected neurons (p = 0.02, t test). I, Labeling of overexpressed channels by CaV2.2 polyclonal antibody. DRG neurons were transfected with CaV2.2YFP and β1B cDNAs. J, CaV2.2 antibody failed to identify native subunits in eYFP overexpressing neurons indicating that the amount of protein is a limiting factor in immunocytochemistry experiments.
In agreement with these results, in whole-cell patch-clamp recordings CTX application significantly reduced Ba2+ current density of control (−64 ± 8 pA/pF, n = 10) and α2δ-1 overexpressing neurons (−103 ± 19 pA/pF, n = 11) to −31 ± 5 pA/pF and −37 ± 7 pA/pF respectively (p < 0.01, t test), indicating a greater percentage of current blocked by CTX in the presence of α2δ-1 subunit (63 ± 2%) compared with control condition (53 ± 3%; p = 0.016, t test).
Next, to address the hypothesis that α2δ-1 overexpression could indeed modulate surface N-type calcium channels, neurons were cotransfected with α2δ-1 cDNA and a CaV2.2 construct containing an HA tag in an extracellular loop (Cassidy et al., 2014). This technique was used because the lack of commercially available antibodies directed against extracellular epitopes prevented the detection of native surface-expressed CaV2.2 subunits. We compared the cell surface localization of HA-CaV2.2 when coexpressed with wild-type α2δ-1 or α2δ-1MIDASAAA (Fig. 3G). As shown in Figure 3G,H, surface expression of N-type channels was promoted by wild-type α2δ-1 relative to α2δ-1 MIDASAAA (Fig. 3H). Total expression of N-type channels was assessed by staining permeabilized neurons with a CaV2.2 antibody directed against the intracellular II–III loop (Raghib et al., 2001). In immunocytochemistry experiments this antibody enabled detection of overexpressed Cav2.2 subunits only (Fig. 3I,J).
α2δ-1 HA modulation of Ca2+ transients is insensitive to depletion of the ER Ca2+ stores
What is the mechanism underlying the depolarization-evoked extended Ca2+ rise in α2δ-1 HA overexpressing neurons? Figure 4A shows that initiation of the high K+-induced response was dependent on extracellular Ca2+, whereas the shape of the “hump” component did not change when α2δ-1 HA overexpressing DRGs were incubated in a Ca2+-free bathing solution immediately after depolarization (Fig. 4B), indicating that the prolonged signal is mediated by Ca2+ release from intracellular compartments. The mechanism of calcium-induced calcium release from the ER has been found to regulate the depolarization-induced Ca2+ increase in a subpopulation of DRG neurons (Shmigol et al., 1995; Lu et al., 2006). To investigate the role of the ER in the α2δ-1-mediated response, we depleted intracellular stores with CPA, a selective blocker of the sarcoendoplasmic reticulum Ca2+-ATPase (SERCA). Figure 4C,D shows example traces in untreated neurons, or after preincubation with CPA (5 μm, 15 min), for both control (Fig. 4C) and α2δ-1 overexpressing cells (Fig. 4D). In the absence of α2δ-1 HA overexpression, CPA induced a widening of the response, implying a role for ER stores in Ca2+ clearance after depolarization. However, in α2δ-1 HA overexpressing neurons CPA did not affect the shape of Ca2+ transients (Fig. 4E). As expected, CPA application increased baseline Ca2+ levels both in control (baseline before CPA: 0.98 ± 0.02, n = 15; baseline after CPA: 1.11 ± 0.03 n = 15; p = 0.006, paired t test) and in α2δ-1 HA overexpressing neurons (baseline before CPA: 0.92 ± 0.03 F340/380, n = 14; baseline after CPA: 1.15 ± 0.05 F340/380, n = 14; p = 0.002, paired t test), indicating a role for SERCA under resting conditions.
Figure 4.
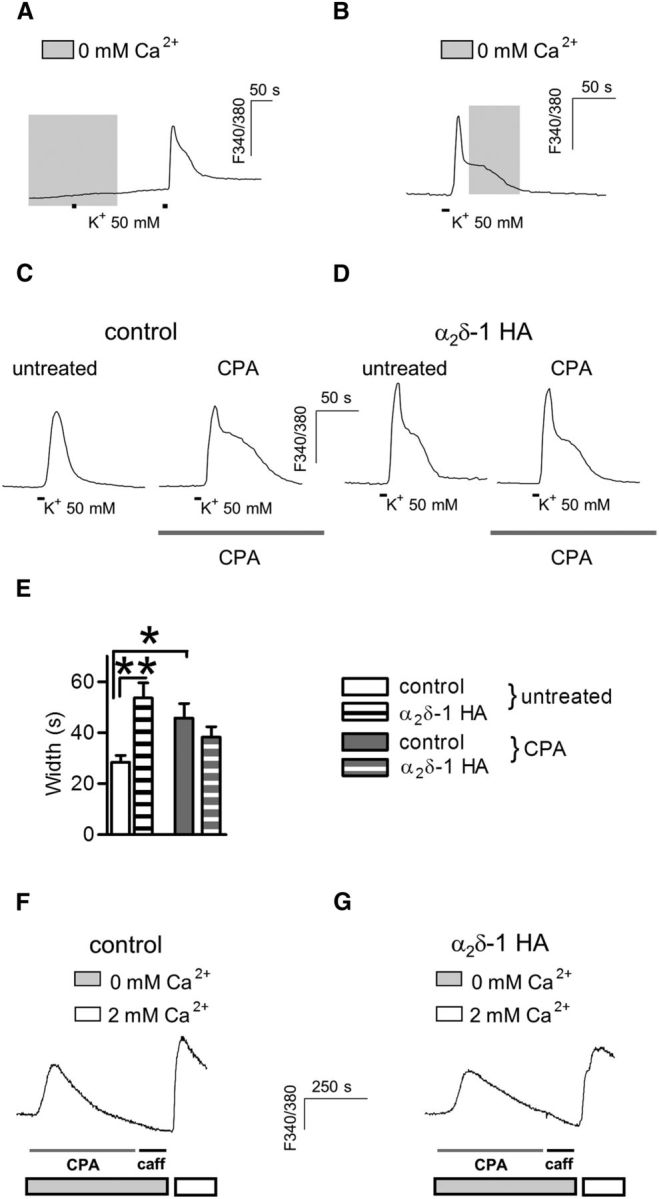
ER stores are not involved in shaping α2δ-1 HA prolonged responses. A, Preincubation of DRGs in Ca2+ free bathing solution during the period shown by the gray shading abolished high K+-induced transients. The response was recovered after a subsequent application of extracellular 2 mm Ca2+. B, The Ca2+ hump observed in high K+-evoked signal of α2δ-1 HA overexpressing neurons is not affected by perfusion with 0 mm Ca2+ after the initiation of the peak response (representative of n = 4). C, D, High K+-evoked Ca2+ transients imaged before and after store depletion by CPA pretreatment (right trace; 5 μm, 15 min) in control (C) and α2δ-1 HA overexpressing neurons (D). E, Ca2+ transients evoked in α2δ-1 HA overexpressing DRGs (striped bars) were not altered by CPA preapplication (gray bars; n = 14) when compared with neurons processed in parallel without the drug (white bars; n = 15). By contrast, in control neurons, CPA pretreatment (n = 14) resulted in responses with a slower recovery than those from untreated neurons (n = 14; interaction: p = 0.001, two-way ANOVA and Bonferroni post hoc test, *p < 0.05, **p < 0.01). F, G, Application of CPA in Ca2+-free solution (gray bar; 20 μm, 5 min). Caffeine (Caff; 5 mm) was then applied, and the lack of response indicated store depletion. Adding Ca2+ into the extracellular solution (white bar) triggered a similar store-operated calcium channel response in both control DRG neurons (F) and those overexpressing α2δ-1 HA (G).
To investigate whether overexpression of α2δ-1 HA might interfere with the correct functioning of the ER stores, we applied CPA in a Ca2+-free bathing solution and measured Ca2+ leak from the ER. Caffeine was then applied to assess the effectiveness of CPA-mediated store depletion. In addition we then monitored store-operated Ca2+ entry by reverting to 2 mm Ca2+ after store depletion (Fig. 4F,G). No difference in ER Ca2+ content was detected in α2δ-1 HA overexpressing DRGs (total area: 56.58 ± 7.36, n = 14), compared with control neurons (total area: 51.24 ± 8.07, n = 13; p = 0.6, t test). Furthermore upon CPA-mediated store depletion, the addition of extracellular Ca2+ to the bathing solution resulted in a store-operated Ca2+ channel response of equal peak amplitude between α2δ-1 overexpressing and control neurons (control: 0.83 ± 0.06 F340/380, n = 11; α2δ-1: 0.70 ± 0.04, n = 14; p = 0.1, t test).
Mitochondria buffer signals enhanced by α2δ-1 HA upregulation
Mitochondria are important regulators of Ca2+ dynamics in DRG neuron cell bodies (Werth and Thayer, 1994) and neurite terminals (Medvedeva et al., 2008). These organelles accumulate Ca2+ into their matrix through a calcium uniporter mechanism driven by the negative mitochondrial membrane potential. Ca2+ is then slowly released back into the cytoplasm via Na+/Ca2+ exchangers (Rizzuto et al., 2012), and pumped out of the cell. We first used a pharmacological approach to identify the contribution of mitochondria to the Ca2+ response in α2δ-1 HA overexpressing DRGs. Figure 5 shows representative Ca2+ signals and quantification in control (Fig. 5A,B) and α2δ-1 HA overexpressing neurons (Fig. 5C,D) with or without the application of antimycin (anti; 0.3 μm) and oligomycin (oligo; 1 μm). The combination of these drugs has been previously found to be effective in blocking Ca2+ uptake into mitochondria while preventing ATP depletion (Medvedeva et al., 2008). When Ca2+ transients were evoked in the presence of antimycin and oligomycin, there was an increase in the peak amplitude of responses from both control (Fig. 5B) and α2δ-1 HA overexpressing DRGs (Fig. 5D). However, in the latter condition the hump component was abolished giving rise to a marked reduction of response duration (Fig. 5C,E). A significant interaction (Fig. 5E; p = 0.004, two-way ANOVA) between the drug treatment and α2δ-1 overexpression underlined a synergistic action of the two factors.
Figure 5.
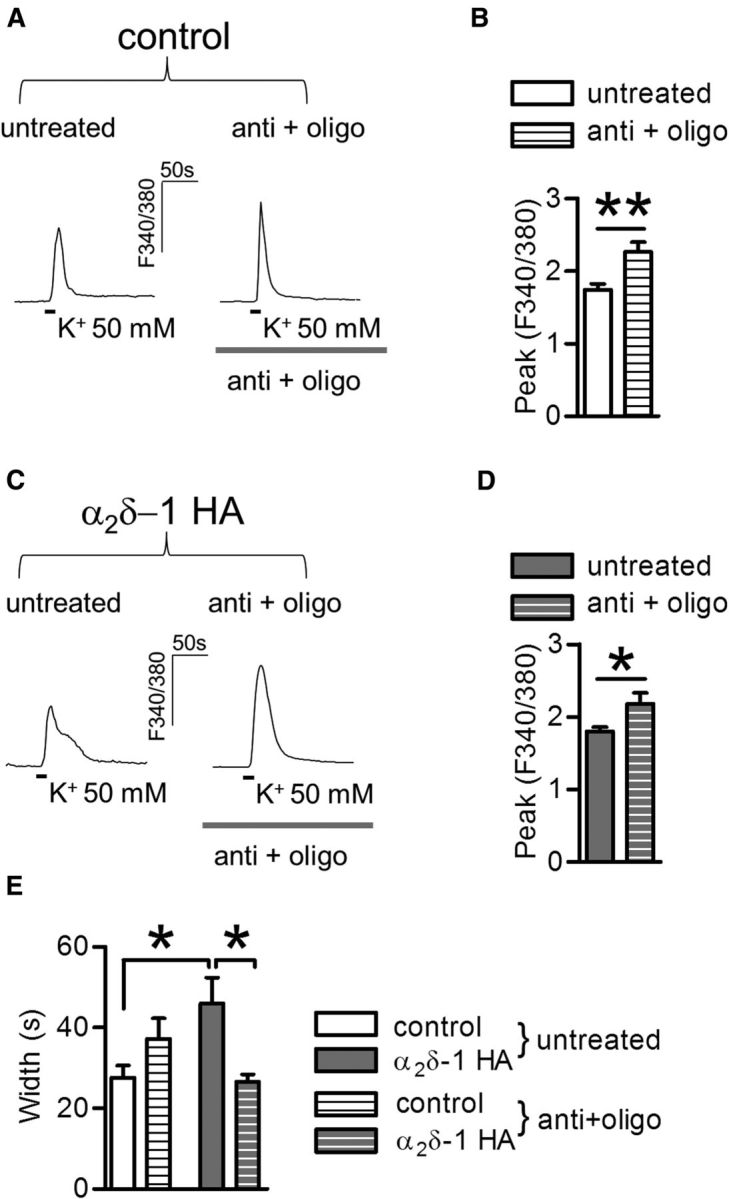
Role of mitochondria in the intracellular Ca2+ response in control and α2δ-1 HA overexpressing DRGs. A, High K+-triggered Ca2+ signals in the absence (left) or presence (right) of antimycin and oligomycin (anti + oligo; 5 min preapplication) in control DRG neurons. B, Quantification of peak response after the application of anti + oligo in control DRG neurons (striped bar;, n = 22) compared with untreated neurons (open bar; n = 19) processed in parallel. The peak amplitude of responses is increased by anti + oligo application (**p = 0.002, t test). C, Example of Ca2+ transients imaged in α2δ-1 HA overexpressing DRGs following anti + oligo pretreatment, as in A. D, Quantification of peak response after the application of anti + oligo in α2δ-1 HA overexpressing DRG neurons (gray striped bar; n = 20) compared with untreated neurons processed in parallel (gray bar; n = 27, *p = 0.03, t test). E, The increased Ca2+ transient duration mediated by α2δ-1 HA overexpression (gray bars) compared with control DRG neurons (open bars) is inhibited by anti + oligo treatment (striped bars; two-way ANOVA and Bonferroni post hoc test, *p < 0.05).
The recent identification of the channel responsible for mitochondrial Ca2+ uptake (MCU) has allowed the development of more sensitive tools to study Ca2+ entry into mitochondria (De Stefani et al., 2011). Because the uniporter machinery involves the formation of a tetramer, we were able to use a dominant-negative form of MCU protein (MCUD260N,E263Q; Raffaello et al., 2013) to knockdown mitochondrial calcium buffering in DRGs. As described previously (Raffaello et al., 2013), the overexpression of MCUD260N,E263Q carrying two point mutations in the pore-forming domain oligomerize with endogenous subunits giving rise to a substantial reduction of calcium uptake into mitochondria (∼47% decrease of [Ca2+]mt). Calcium imaging experiments shown in Figure 6A indicate that in the absence of overexpressed α2δ-1 HA subunit the overexpression of MCUD260N,E263Q (MCUNQ) did not affect the amplitude of high K+-evoked Ca2+ transients (Fig. 6B). The discrepancy between this result and the data obtained with antimycin and oligomycin treatment is likely to be due to only a partial loss of function induced by MCUD260N,E263Q, as many mitochondria retained functioning MCU machinery (Raffaello et al., 2013). Nevertheless when MCUD260N,E263Q was cotransfected together with α2δ-1, the peak response showed a consistent increase of 21 ± 9% (Fig. 6C,D; p = 0.04). In addition the overexpression of MCUD260N,E263Q exerted an effect on Ca2+ transient duration (Fig. 6E), leading to an inhibition of the prolonged Ca2+ rise in α2δ-1 HA overexpressing neurons, whereas no significant change was detected in the shape of signals in control DRGs. These findings showed that in the presence of α2δ-1 HA, increases in intracellular Ca2+ were rapidly taken up by mitochondria, and subsequently released into the cytoplasm resulting in a prolonged Ca2+ response.
Figure 6.

MCU contributes to generate the Ca2+ hump in DRGs overexpressing α2δ-1 HA. A, High K+-induced Ca2+ transients in control DRG neurons, in the absence (left; n = 31) or presence (right; n = 22) of MCUD260N,E263Q. B, No change in the peak amplitude after MCUD260N,E263Q overexpression (checked bar compared with open bar) in control DRG neurons (p = 0.4, t test). C, High K+-induced Ca2+ transients in α2δ-1 HA overexpressing (left; n = 28) and α2δ-1 HA + MCUD260N,E263Q overexpressing (right; n = 23) DRGs. D, Cotransfection of MCUD260N,E263Q and α2δ-1 HA subunit increased the peak amplitude of high K+-induced Ca2+ transients (gray checked bar compared with solid gray bar, *p < 0.05, t test). E, Following MCUD260N,E263Q overexpression, α2δ-1 HA neurons did not display prolonged Ca2+ response in response to 50 mm K+ (gray checked bar compared with solid gray bar; p = 0.01 two-way ANOVA and Bonferroni post hoc test, *p < 0.05). There was no effect of MCUD260N,E263Q on the response width in control DRG neurons (checked bar compared with open bar). F, MtPericam responses stimulated by the application of 20 and 100 APs at 10 Hz in control (n = 26; black trace) and α2δ-1 HA neurons (n = 31; top gray trace). G, Increase of 100 AP-induced mitochondrial Ca2+ uptake in the presence of α2δ-1 HA and normalized to [Ca2+]mt in control neurons (p = 0.034; Kruskal–Wallis one-way ANOVA and Dunn's multiple-comparison test, *p < 0.05).
To directly monitor changes in mitochondrial Ca2+ uptake following membrane depolarization, control and α2δ-1 HA overexpressing neurons were cotransfected with mtPericam (Nagai et al., 2001), a Ca2+ probe selectively localized within mitochondria. Stimulation of DRGs with 20 and 100 action potentials (APs) at 10 Hz induced a large increase in [Ca2+]mt (Fig. 6F), confirming the role of mitochondria in buffering depolarization-evoked Ca2+ signals (Colegrove et al., 2000). Moreover, comparison between control and α2δ-1 HA overexpressing neurons demonstrated an augmented mitochondrial Ca2+ uptake in α2δ-1 HA overexpressing DRGs stimulated with 100 APs (Fig. 6G).
Because the rate of mitochondrial Ca2+ buffering correlates with changes in cytosolic Ca2+ levels (Colegrove et al., 2000), we increased Ca2+ entry by the application of 100 mm K+ (experimental protocol shown in Fig. 7A) and assessed the contribution of MCUD260N,E263Q overexpression to Ca2+ transients evoked in control and α2δ-1 HA DRGs. This stronger depolarization protocol induced larger signals with a longer duration in both α2δ-1 HA overexpressing and control neurons (Fig. 7B), resulting in the generation of an equal duration of Ca2+ response in both conditions. As expected the inhibition of prolonged Ca2+ transients linked with MCUD260N,E263Q overexpression was strongly enhanced by 100 mm K+ application (Fig. 7C). However only when MCUD260N,E263Q was coexpressed with α2δ-1 HA, was the shortening of the response width associated with a significant rise of the peak amplitude (∼20% increase of F340/380 in α2δ-1 HA/MCUD260N,E263Q vs ∼5% increase in control/MCUD260N,E263Q; Fig. 7D). This finding indicates that that the activation of mitochondrial Ca2+ uptake depends, not only on the intensity of the response but also may be linked to a specific cellular pathway. Thus the upregulation of CaV2.2 channels in α2δ-1 HA overexpressing neurons may recruit mitochondria into a predominant role of shaping Ca2+ transients (Fig. 7E).
Figure 7.
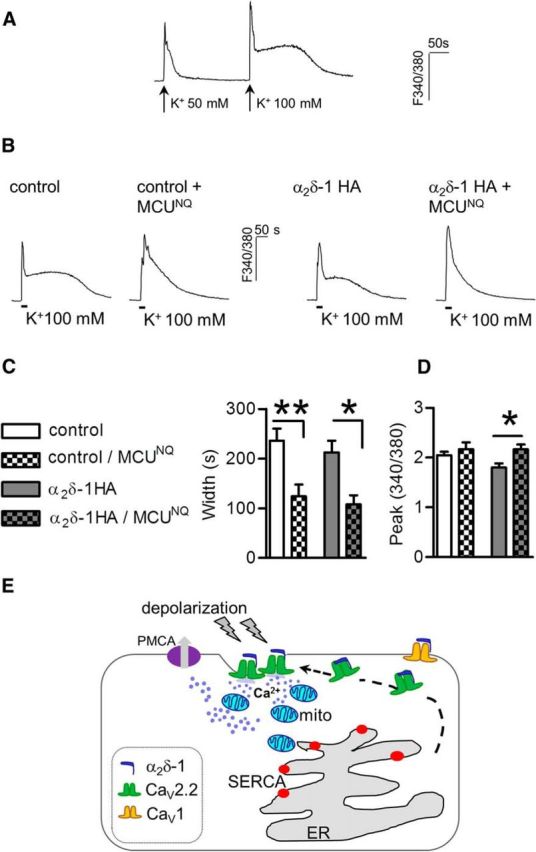
MCUD260N,E263Q effect on 100 mm K+-evoked Ca2+ response in control and α2δ-1 neurons. A, Increasing concentrations of KCl (50, 100 mm) correspond to a consequent elevation of peak and duration of Ca2+ transients imaged in control (representative of n = 22; p < 0.0001, paired t test) and α2δ-1 neurons (n = 10; p < 0.0001, p < 0.0008 for area and duration respectively, paired t test). B, Ca2+ traces triggered by the application of 100 mm K+ (10 s) in control and α2δ-1 HA DRGs with or without the expression of MCU dominant negative. C, MCUD260N,E263Q overexpression significantly reduced duration of Ca2+ transients activated by 100 mm K+ (p = 0.00002, two-way ANOVA and Bonferroni post hoc test, *p < 0.05, **p < 0.01). D, Quantification of peak amplitude of response in control (n = 20), control+ MCUD260N,E263Q (n = 13), α2δ-1 HA (n = 10), and α2δ-1 HA + MCUD260N,E263Q (n = 14) DRGs. Overexpression of mutant MCU increased peak amplitude of signals imaged in α2δ-1 HA neurons only (p = 0.02, two-way ANOVA and Bonferroni post hoc test). E, Proposed mechanism for α2δ-1 regulation of activity dependent-Ca2+ signals. Increased levels of α2δ-1 protein lead to surface CaV2.2 channel upregulation. N-type channel-mediated Ca2+ influx is primarily buffered by mitochondria which contribute together with plasma membrane Ca2+-ATPase (PMCA) to limit the amount of Ca2+ increase in the cytoplasm.
Activity-dependent reduction of mitochondrial trafficking in α2δ-1 HA overexpressing neurites
Mitochondria are dynamic organelles synthesized in the cell body and trafficked along neuronal processes at velocities ranging from 0.3 to 1 μm/s (MacAskill and Kittler, 2010). They are characterized by a bidirectional saltatory movement, which is regulated by intracellular Ca2+ levels (Wang and Schwarz, 2009). An increase in Ca2+ concentration induces the arrest of mitochondrial trafficking, leading to a rapid distribution of mitochondria in regions demanding high Ca2+ buffering. We hypothesized that by promoting VGCC trafficking, α2δ-1 HA overexpression might increase local Ca2+ influx within the neurites and exert an effect on mitochondrial axonal transport. We measured mitochondrial motility in wild-type and α2δ-1 MIDASAAA overexpressing DRGs, both in resting conditions and during field stimulation at 100 Hz. Mtdsred2 (Macaskill et al., 2009), a fluorescent protein exclusively localized in mitochondria (Fig. 8A, bottom), was used to visualize these organelles in the neurites during time lapse imaging experiments. Kymographs were generated to identify mobile and stationary mitochondria (Fig. 8B–D). The overexpression of α2δ-1 HA or α2δ-1 MIDASAAA mutant did not change the percentage of moving mitochondria in resting conditions (Fig. 8E). By contrast, intense electrical stimulation significantly reduced the fraction of moving mitochondria in α2δ-1 HA-expressing neurons compared with nonstimulated conditions (Fig. 8F). In-line with the finding that calcium channel abundance at presynaptic sites is controlled by the level of expression of wild-type α2δ-1 subunit (Hoppa et al., 2012), in the presence of α2δ-1 MIDASAAA HA we found no difference in the percentage of moving mitochondria before and after stimulation. Furthermore after α2δ-1 HA overexpressing cultures were pretreated with CTX (1 μm, 15 min; Fig. 8D), field stimulation did not cause mitochondria to stall, suggesting that the increased Ca2+ influx in response to depolarization is mainly mediated by CaV2.2 channels trafficked to the neurites by the α2δ-1 subunit.
Figure 8.

Reduction of axonal mitochondrial transport following electrical stimulation of α2δ-1 HA overexpressing DRG neurons. A, For time-lapse experiments, neurons were transfected with α2δ-1 HA and eCFP to identify neuron morphology (top image) together with pdsRed2-Mito plasmid to label mitochondria (bottom image). Scale bar, 100 μm. B–D, Kymographs showing mitochondrial motility before and during the application of field stimulation in α2δ-1 HA (B), α2δ-1 MIDASAAA HA (C), or α2δ-1 HA neurons pretreated with CTX (1 μm for 15 min; D). The first frame of the time-lapse movie is shown above each kymograph. Vertical arrows indicate a 2 min imaging period. Scale bars, 10 μm. E, No difference in the percentage of moving mitochondria between α2δ-1 HA-expressing DRGs (gray bar; n = 239 mitochondria), α2δ-1 MIDASAAA HA-expressing DRGs (black bar; n = 219 mitochondria), or α2δ-1-expressing DRGs treated with CTX (gray striped bar; n = 234 mitochondria) before field stimulation (p = 0.7, Kruskal–Wallis one-way ANOVA). F, The proportion of moving mitochondria after field stimulation was normalized with respect to the moving mitochondria in each resting condition, and was decreased in α2δ-1 HA-expressing DRGs (gray bar; p = 0.01, Kruskal–Wallis one-way ANOVA and Dunn's multiple-comparison test, **p < 0.01).
Discussion
VGCC α2δ subunits are key molecules in the regulation of sensory neuron plasticity as their upregulation per se exerts effects on nociceptive behavior (Li et al., 2006). Moreover increased α2δ-1 protein levels in damaged DRG neurons contribute to the enhanced neurotransmission and hyperexcitability observed in neuropathic pain models (Campbell and Meyer, 2006; Patel et al., 2013), although no details about the molecular mechanisms have been reported.
In this work, we describe an in vitro model to study cellular changes triggered by increased α2δ-1 protein levels. Our data show that α2δ-1 HA upregulation enhances Ca2+ signal duration in response to brief membrane depolarization. Ca2+ transients were characterized by an initial peak followed by a prolonged Ca2+ rise, which did not depend on extracellular calcium. Similar effects on evoked Ca2+ responses have been observed in vivo in DRGs subjected to inflammatory insult (Fuchs et al., 2007; Lu and Gold, 2008). Surprisingly, in our assays the generation of this Ca2+ hump was mainly associated with N-type calcium channel activity as it was blocked by CTX, but not by application of the L-type channel blocker nifedipine. Also α2δ-1 HA overexpression prolonged the duration of Ca2+ transients evoked by field stimulation at 100 Hz frequency but did not change the shape of 10 Hz-triggered responses. This result is in agreement with the finding that 100 Hz-evoked Ca2+ signals are preferentially mediated by CaV2 channels (Wheeler et al., 2012). The experiments performed with mtPericam, confirmed this phenomenon, indicating a prominent role of mitochondria in buffering intracellular Ca2+ in response to a strong depolarization in α2δ-1 overexpressing neurons, compared with the control condition.
Functional data related to the effect of the α2δ-1 HA subunit on the intracellular Ca2+ rise through a CTX-sensitive pathway were confirmed by the increased surface detection of transfected CaV2.2 channels in α2δ-1 overexpressing cultures.
The ability of the α2δ-1 subunit to promote calcium channel expression at the cell surface is dependent on the MIDAS motif located in the VWA domain of α2δ proteins, as also shown in a neuronal cell line (Cassidy et al., 2014). Mutation of this motif markedly decreased α2δ-1 HA membrane expression, leading to a consequent reduction of CaV2.2 surface localization and complete inhibition of the prolonged Ca2+ response. Furthermore, the experiments performed with α2δ-1 MIDASAAA HA showed that the modulation of Ca2+ responses is dependent on the control of VGCC trafficking by α2δ-1, yet it provokes the question of the mechanism responsible for prolonged N-type VGCC-mediated Ca2+ transients.
Recently it has been postulated that intracellular Ca2+ signals triggered by different means can follow individual pathways coupled to specific cellular responses, such as the activation of gene transcription by CaV1 channels in sympathetic neurons (Wheeler et al., 2012). In the same neuronal model, using a CaV2.1 antibody, these VGCCs were found to be distributed in high-density patches in close proximity to ER–mitochondria interaction sites and it was postulated that CaV2-mediated Ca2+ influx was preferentially sequestered by mitochondria. ER stores and mitochondria constitute the main Ca2+ buffering compartments in DRG neurons (Medvedeva et al., 2008). In our study, the inhibition of SERCA in control neurons slowed the recovery from high-K+ evoked responses. This confirmed the role of the ER in Ca2+ clearance after depolarization. However, upon α2δ-1 overexpression, ER stores failed to further prolong depolarization-induced Ca2+signals, despite contributing to resting Ca2+ levels, suggesting that the ER stores are full in this condition.
To investigate the role of mitochondria in the modulation of Ca2+ signaling by α2δ-1, we selectively knocked down the mitochondrial Ca2+ uniporter mechanism through the expression of a mutated MCU protein, MCUD260N,E263Q. Cotransfection of MCUD260N,E263Q together with the α2δ-1 HA subunit in DRGs abolished the elevation of the Ca2+ transient width and increased response peak amplitude, when compared with neurons overexpressing α2δ-1 HA protein alone. Similar results were obtained when mitochondrial Ca2+ uptake was indirectly blocked by acute disruption of the mitochondrial membrane potential with antimycin and oligomycin treatment. Also with mtPericam imaging we were able to directly measure the increase in [Ca2+]mt evoked by 100 AP stimulation of α2δ-1 HA-expressing neurons.
Altogether our genetic and pharmacological studies confirm that the activation of mitochondrial Ca2+ uptake is an essential mechanism called into play to limit the Ca2+ rise in response to Ca2+ entry (Friel, 2000), and define the α2δ-1 protein as a crucial regulator of VGCC-mediated signaling in peripheral neurons. Because mitochondria are recruited to buffer high Ca2+ loads (Werth and Thayer, 1994), it is likely that their involvement in α2δ-1-modulated signaling may be associated with an increase in the magnitude of Ca2+ response consequent on VGCC upregulation. Indeed, we found that stimulation of cultures with 100 mm K+ increased the duration of Ca2+ responses, as well as the peak amplitude. In this condition, we found that almost all responses in both α2δ-1 HA overexpressing and control neurons were characterized by a large plateau phase, which followed the initial rise of the peak. However the inhibition of mitochondrial Ca2+ uptake by MCUD260N,E263Q overexpression revealed that mitochondria contributed to blunting the Ca2+ response amplitude only in α2δ-1 overexpressing DRGs, suggesting that even in the presence of high Ca2+ entry, α2δ-1 HA overexpression displays a role in promoting mitochondrial Ca2+ buffering of N-type calcium channel-mediated responses, suggesting that they may be in proximity.
On the basis of data related to surface staining of CaV2.2 channels and lack of effect of the SERCA pump blocker in α2δ-1 HA overexpressing DRGs, we can speculate that mitochondria may preferentially buffer Ca2+ in close proximity to the channels at the plasma membrane. Conversely, in the absence of the α2δ-1-modulation of VGCC, mitochondria are more likely to be influenced by Ca2+ release from the ER. Previously it has been shown that mitochondria play an important role in the control of neurotransmission at presynaptic terminals both in capsaicin-sensitive DRGs and at central synapses (Billups and Forsythe, 2002; Medvedeva et al., 2008; Perkins et al., 2010). To regulate metabolic demand and the local intracellular Ca2+ concentration, mitochondria are rapidly trafficked through neuronal processes (Sheng and Cai, 2012). In agreement with the finding that mitochondrial stalling is Ca2+-dependent in neuronal processes (Macaskill et al., 2009), we found that mitochondrial axonal transport was selectively reduced after electrical stimulation of α2δ-1 HA overexpressing cultures. In contrast, no change was observed in mitochondrial trafficking either in α2δ-1 MIDASAAA HA-expressing DRGs or in CTX-treated α2δ-1 HA overexpressing neurons. Our findings suggest that α2δ-1 HA overexpression may contribute to the formation of domains predominantly buffered by mitochondria in the cell body, as well as the axons of DRGs.
In conclusion, this work describes the mechanism through which α2δ-1 upregulation modulates the response of DRG neurons to depolarization, suggesting that N-type VGCC-mediated activation of mitochondrial Ca2+ buffering may contribute to intracellular signaling related to the aberrant neurotransmission in pathological conditions.
Footnotes
This work was supported in part by a Newton Fellowship from the Royal Society to M. D., a Wellcome Trust senior Investigator award to A.C.D. (098360/Z/12/Z), and Medical Research Council (UK) Grants G0801756 and G0901758 to A.C.D., J.S.C. was supported by an MRC CASE PhD studentship with Pfizer. We thank Prof. Renato Rizzuto and Dr Anna Raffaello for providing wild-type and mutant MCU plasmids, Prof. Josef Kittler for mtdsred2 cDNA, and Dr Marianthi Papakosta for support in the initial development of HA-CaV2.2.
The authors declare no competing financial interests.
References
- Akimzhanov AM, Boehning D. Monitoring dynamic changes in mitochondrial calcium levels during apoptosis using A genetically encoded calcium sensor. J Vis Exp. 2011;50:2579. doi: 10.3791/2579. [DOI] [PMC free article] [PubMed] [Google Scholar]
- Basbaum AI, Bautista DM, Scherrer G, Julius D. Cellular and molecular mechanisms of pain. Cell. 2009;139:267–284. doi: 10.1016/j.cell.2009.09.028. [DOI] [PMC free article] [PubMed] [Google Scholar]
- Bauer CS, Nieto-Rostro M, Rahman W, Tran-Van-Minh A, Ferron L, Douglas L, Kadurin I, Sri Ranjan Y, Fernandez-Alacid L, Millar NS, Dickenson AH, Lujan R, Dolphin AC. The increased trafficking of the calcium channel subunit alpha2delta-1 to presynaptic terminals in neuropathic pain is inhibited by the alpha2delta ligand pregabalin. J Neurosci. 2009;29:4076–4088. doi: 10.1523/JNEUROSCI.0356-09.2009. [DOI] [PMC free article] [PubMed] [Google Scholar]
- Bauer CS, Tran-Van-Minh A, Kadurin I, Dolphin AC. A new look at calcium channel α2δ subunits. Curr Opin Neurobiol. 2010;20:563–571. doi: 10.1016/j.conb.2010.05.007. [DOI] [PubMed] [Google Scholar]
- Bell TJ, Thaler C, Castiglioni AJ, Helton TD, Lipscombe D. Cell-specific alternative splicing increases calcium channel current density in the pain pathway. Neuron. 2004;41:127–138. doi: 10.1016/S0896-6273(03)00801-8. [DOI] [PubMed] [Google Scholar]
- Berridge MJ. Neuronal calcium signaling. Neuron. 1998;21:13–26. doi: 10.1016/S0896-6273(00)80510-3. [DOI] [PubMed] [Google Scholar]
- Berridge MJ, Bootman MD, Roderick HL. Calcium signalling: dynamics, homeostasis and remodelling. Nat Rev Mol Cell Biol. 2003;4:517–529. doi: 10.1038/nrm1155. [DOI] [PubMed] [Google Scholar]
- Billups B, Forsythe ID. Presynaptic mitochondrial calcium sequestration influences transmission at mammalian central synapses. J Neurosci. 2002;22:5840–5847. doi: 10.1523/JNEUROSCI.22-14-05840.2002. [DOI] [PMC free article] [PubMed] [Google Scholar]
- Campbell JN, Meyer RA. Mechanisms of neuropathic pain. Neuron. 2006;52:77–92. doi: 10.1016/j.neuron.2006.09.021. [DOI] [PMC free article] [PubMed] [Google Scholar]
- Cantí C, Nieto-Rostro M, Foucault I, Heblich F, Wratten J, Richards MW, Hendrich J, Douglas L, Page KM, Davies A, Dolphin AC. The metal-ion-dependent adhesion site in the von Willebrand factor-A domain of alpha2delta subunits is key to trafficking voltage-gated Ca2+ channels. Proc Natl Acad Sci U S A. 2005;102:11230–11235. doi: 10.1073/pnas.0504183102. [DOI] [PMC free article] [PubMed] [Google Scholar]
- Cassidy JS, Ferron L, Kadurin I, Pratt WS, Dolphin AC. Functional exofacially tagged N-type calcium channels elucidate the interaction with auxiliary α2δ-1 subunits. Proc Natl Acad Sci U S A. 2014;111:8979–8984. doi: 10.1073/pnas.1403731111. [DOI] [PMC free article] [PubMed] [Google Scholar]
- Colegrove SL, Albrecht MA, Friel DD. Dissection of mitochondrial Ca2+ uptake and release fluxes in situ after depolarization-evoked [Ca2+](i) elevations in sympathetic neurons. J Gen Physiol. 2000;115:351–370. doi: 10.1085/jgp.115.3.351. [DOI] [PMC free article] [PubMed] [Google Scholar]
- De Stefani D, Raffaello A, Teardo E, Szabò I, Rizzuto R. A forty-kilodalton protein of the inner membrane is the mitochondrial calcium uniporter. Nature. 2011;476:336–340. doi: 10.1038/nature10230. [DOI] [PMC free article] [PubMed] [Google Scholar]
- Dolphin AC. Calcium channel auxiliary α2δ and β subunits: trafficking and one step beyond. Nat Rev Neurosci. 2012;13:542–555. doi: 10.1038/nrn3311. [DOI] [PubMed] [Google Scholar]
- Fernyhough P, Calcutt NA. Abnormal calcium homeostasis in peripheral neuropathies. Cell Calcium. 2010;47:130–139. doi: 10.1016/j.ceca.2009.11.008. [DOI] [PMC free article] [PubMed] [Google Scholar]
- Friel DD. Mitochondria as regulators of stimulus-evoked calcium signals in neurons. Cell Calcium. 2000;28:307–316. doi: 10.1054/ceca.2000.0172. [DOI] [PubMed] [Google Scholar]
- Fuchs A, Rigaud M, Hogan QH. Painful nerve injury shortens the intracellular Ca2+ signal in axotomized sensory neurons of rats. Anesthesiology. 2007;107:106–116. doi: 10.1097/01.anes.0000267538.72900.68. [DOI] [PMC free article] [PubMed] [Google Scholar]
- Hoppa MB, Lana B, Margas W, Dolphin AC, Ryan TA. α2δ Expression sets presynaptic calcium channel abundance and release probability. Nature. 2012;486:122–125. doi: 10.1038/nature11033. [DOI] [PMC free article] [PubMed] [Google Scholar]
- Julius D, Basbaum AI. Molecular mechanisms of nociception. Nature. 2001;413:203–210. doi: 10.1038/35093019. [DOI] [PubMed] [Google Scholar]
- Kadurin I, Alvarez-Laviada A, Ng SF, Walker-Gray R, D'Arco M, Fadel MG, Pratt WS, Dolphin AC. Calcium currents are enhanced by α2δ-1 lacking its membrane anchor. J Biol Chem. 2012;287:33554–33566. doi: 10.1074/jbc.M112.378554. [DOI] [PMC free article] [PubMed] [Google Scholar]
- Karra D, Dahm R. Transfection techniques for neuronal cells. J Neurosci. 2010;30:6171–6177. doi: 10.1523/JNEUROSCI.0183-10.2010. [DOI] [PMC free article] [PubMed] [Google Scholar]
- Li CY, Zhang XL, Matthews EA, Li KW, Kurwa A, Boroujerdi A, Gross J, Gold MS, Dickenson AH, Feng G, Luo ZD. Calcium channel alpha2delta1 subunit mediates spinal hyperexcitability in pain modulation. Pain. 2006;125:20–34. doi: 10.1016/j.pain.2006.04.022. [DOI] [PMC free article] [PubMed] [Google Scholar]
- Lu SG, Gold MS. Inflammation-induced increase in evoked calcium transients in subpopulations of rat dorsal root ganglion neurons. Neuroscience. 2008;153:279–288. doi: 10.1016/j.neuroscience.2008.02.006. [DOI] [PMC free article] [PubMed] [Google Scholar]
- Lu SG, Zhang X, Gold MS. Intracellular calcium regulation among subpopulations of rat dorsal root ganglion neurons. J Physiol. 2006;577:169–190. doi: 10.1113/jphysiol.2006.116418. [DOI] [PMC free article] [PubMed] [Google Scholar]
- MacAskill AF, Kittler JT. Control of mitochondrial transport and localization in neurons. Trends Cell Biol. 2010;20:102–112. doi: 10.1016/j.tcb.2009.11.002. [DOI] [PubMed] [Google Scholar]
- Macaskill AF, Rinholm JE, Twelvetrees AE, Arancibia-Carcamo IL, Muir J, Fransson A, Aspenstrom P, Attwell D, Kittler JT. Miro1 is a calcium sensor for glutamate receptor-dependent localization of mitochondria at synapses. Neuron. 2009;61:541–555. doi: 10.1016/j.neuron.2009.01.030. [DOI] [PMC free article] [PubMed] [Google Scholar]
- Medvedeva YV, Kim MS, Usachev YM. Mechanisms of prolonged presynaptic Ca2+ signaling and glutamate release induced by TRPV1 activation in rat sensory neurons. J Neurosci. 2008;28:5295–5311. doi: 10.1523/JNEUROSCI.4810-07.2008. [DOI] [PMC free article] [PubMed] [Google Scholar]
- Meijering E, Jacob M, Sarria JC, Steiner P, Hirling H, Unser M. Design and validation of a tool for neurite tracing and analysis in fluorescence microscopy images. Cytometry A. 2004;58:167–176. doi: 10.1002/cyto.a.20022. [DOI] [PubMed] [Google Scholar]
- Nagai T, Sawano A, Park ES, Miyawaki A. Circularly permuted green fluorescent proteins engineered to sense Ca2+ Proc Natl Acad Sci U S A. 2001;98:3197–3202. doi: 10.1073/pnas.051636098. [DOI] [PMC free article] [PubMed] [Google Scholar]
- Page KM, Heblich F, Margas W, Pratt WS, Nieto-Rostro M, Chaggar K, Sandhu K, Davies A, Dolphin AC. N terminus is key to the dominant negative suppression of Ca(V)2 calcium channels: implications for episodic ataxia type 2. J Biol Chem. 2010;285:835–844. doi: 10.1074/jbc.M109.065045. [DOI] [PMC free article] [PubMed] [Google Scholar]
- Patel R, Bauer CS, Nieto-Rostro M, Margas W, Ferron L, Chaggar K, Crews K, Ramirez JD, Bennett DL, Schwartz A, Dickenson AH, Dolphin AC. α2δ-1 Gene deletion affects somatosensory neuron function and delays mechanical hypersensitivity in response to peripheral nerve damage. J Neurosci. 2013;33:16412–16426. doi: 10.1523/JNEUROSCI.1026-13.2013. [DOI] [PMC free article] [PubMed] [Google Scholar]
- Perkins GA, Tjong J, Brown JM, Poquiz PH, Scott RT, Kolson DR, Ellisman MH, Spirou GA. The micro-architecture of mitochondria at active zones: electron tomography reveals novel anchoring scaffolds and cristae structured for high-rate metabolism. J Neurosci. 2010;30:1015–1026. doi: 10.1523/JNEUROSCI.1517-09.2010. [DOI] [PMC free article] [PubMed] [Google Scholar]
- Raffaello A, De Stefani D, Sabbadin D, Teardo E, Merli G, Picard A, Checchetto V, Moro S, Szabò I, Rizzuto R. The mitochondrial calcium uniporter is a multimer that can include a dominant-negative pore-forming subunit. EMBO J. 2013;32:2362–2376. doi: 10.1038/emboj.2013.157. [DOI] [PMC free article] [PubMed] [Google Scholar]
- Raghib A, Bertaso F, Davies A, Page KM, Meir A, Bogdanov Y, Dolphin AC. Dominant-negative synthesis suppression of voltage-gated calcium channel Cav2.2 induced by truncated constructs. J Neurosci. 2001;21:8495–8504. doi: 10.1523/JNEUROSCI.21-21-08495.2001. [DOI] [PMC free article] [PubMed] [Google Scholar]
- Rizzuto R, De Stefani D, Raffaello A, Mammucari C. Mitochondria as sensors and regulators of calcium signalling. Nat Rev Mol Cell Biol. 2012;13:566–578. doi: 10.1038/nrm3412. [DOI] [PubMed] [Google Scholar]
- Scroggs RS, Fox AP. Calcium current variation between acutely isolated adult rat dorsal root ganglion neurons of different size. J Physiol. 1992;445:639–658. doi: 10.1113/jphysiol.1992.sp018944. [DOI] [PMC free article] [PubMed] [Google Scholar]
- Sheng ZH, Cai Q. Mitochondrial transport in neurons: impact on synaptic homeostasis and neurodegeneration. Nat Rev Neurosci. 2012;13:77–93. doi: 10.1038/nrg3141. [DOI] [PMC free article] [PubMed] [Google Scholar]
- Shmigol A, Verkhratsky A, Isenberg G. Calcium-induced calcium release in rat sensory neurons. J Physiol. 1995;489:627–636. doi: 10.1113/jphysiol.1995.sp021078. [DOI] [PMC free article] [PubMed] [Google Scholar]
- Shutov LP, Kim MS, Houlihan PR, Medvedeva YV, Usachev YM. Mitochondria and plasma membrane Ca2+-ATPase control presynaptic Ca2+ clearance in capsaicin-sensitive rat sensory neurons. J Physiol. 2013;591:2443–2462. doi: 10.1113/jphysiol.2012.249219. [DOI] [PMC free article] [PubMed] [Google Scholar]
- Tinker A, Jan YN, Jan LY. Regions responsible for the assembly of inwardly rectifying potassium channels. Cell. 1996;87:857–868. doi: 10.1016/S0092-8674(00)81993-5. [DOI] [PubMed] [Google Scholar]
- Usachev YM, Thayer SA. All-or-none Ca2+ release from intracellular stores triggered by Ca2+ influx through voltage-gated Ca2+ channels in rat sensory neurons. J Neurosci. 1997;17:7404–7414. doi: 10.1523/JNEUROSCI.17-19-07404.1997. [DOI] [PMC free article] [PubMed] [Google Scholar]
- Wang X, Schwarz TL. The mechanism of Ca2+-dependent regulation of kinesin-mediated mitochondrial motility. Cell. 2009;136:163–174. doi: 10.1016/j.cell.2008.11.046. [DOI] [PMC free article] [PubMed] [Google Scholar]
- Werth JL, Thayer SA. Mitochondria buffer physiological calcium loads in cultured rat dorsal root ganglion neurons. J Neurosci. 1994;14:348–356. doi: 10.1523/JNEUROSCI.14-01-00348.1994. [DOI] [PMC free article] [PubMed] [Google Scholar]
- Wheeler DG, Groth RD, Ma H, Barrett CF, Owen SF, Safa P, Tsien RW. Ca(V)1 and Ca(V)2 channels engage distinct modes of Ca(2+) signaling to control CREB-dependent gene expression. Cell. 2012;149:1112–1124. doi: 10.1016/j.cell.2012.03.041. [DOI] [PMC free article] [PubMed] [Google Scholar]
- Wood JN, Winter J, James IF, Rang HP, Yeats J, Bevan S. Capsaicin-induced ion fluxes in dorsal root ganglion cells in culture. J Neurosci. 1988;8:3208–3220. doi: 10.1523/JNEUROSCI.08-09-03208.1988. [DOI] [PMC free article] [PubMed] [Google Scholar]
- Xiao HS, Huang QH, Zhang FX, Bao L, Lu YJ, Guo C, Yang L, Huang WJ, Fu G, Xu SH, Cheng XP, Yan Q, Zhu ZD, Zhang X, Chen Z, Han ZG, Zhang X. Identification of gene expression profile of dorsal root ganglion in the rat peripheral axotomy model of neuropathic pain. Proc Natl Acad Sci U S A. 2002;99:8360–8365. doi: 10.1073/pnas.122231899. [DOI] [PMC free article] [PubMed] [Google Scholar]