Abstract
Much of our understanding of the neuronal mechanisms of spatial navigation is derived from chronic recordings in rodents in which head-direction, place, and grid cells have all been described. However, despite the proposed importance of self-reference information to these internal representations of space, their congruence with vestibular signaling remains unclear. Here we have undertaken brain-wide functional mapping using both fMRI and electrophysiological methods to directly determine the spatial extent, strength, and time course of vestibular signaling across the rat forebrain. We find distributed activity throughout thalamic, limbic, and particularly primary sensory cortical areas in addition to known head-direction pathways. We also observe activation of frontal regions, including infralimbic and cingulate cortices, indicating integration of vestibular information throughout functionally diverse cortical regions. These whole-brain activity maps therefore suggest a widespread contribution of vestibular signaling to a self-centered framework for multimodal sensorimotor integration in support of movement planning, execution, spatial navigation, and autonomic responses to gravito-inertial changes.
Keywords: evoked potential, fMRI, rat, self movement, spatial navigation, vestibular cortex
Introduction
Brain-wide activity mapping is considered essential for establishing a complete understanding of the diverse functionality of the cortex. At a regional level, much of our current thinking regarding cortical function is seated on more than a century of mapping experiments that continue to refine and define the functional architecture of this structure. This approach has been particularly informative in defining motor and sensory areas in which function is topographically ordered in domains and subdomains. In contrast to other modalities, the vestibular sense has proven more elusive via traditional mapping approaches, and, as such, its contribution or representation at the level of the cortex is comparatively poorly understood.
Normal vestibular function is believed important for spatial navigation (Borel et al., 2008; Shinder and Taube, 2010; Smith and Zheng, 2013; Hitier et al., 2014) and a wide-ranging set of low- and higher-order functions, including autonomic control (Yates, 1996), establishing multiple reference frames for sensory integration (Angelaki and Cullen, 2008), planning and executing motor movements (Cullen, 2012), and cognitive impairments, including schizophrenia, personality disorder, and out-of-body experiences in humans (Smith and Darlington, 2013). Consistent with there being a direct role for vestibular processing at the level of the cortex, early studies showed evoked potentials in the suprasylvian sulcus in lightly anesthetized cats after vestibular nerve (VN) stimulation (Walzl and Mountcastle, 1949; Landgren et al., 1967). Several different cortical areas in humans and nonhuman primates have since been identified as vestibular receptive using VN stimulation, active and passive head movements, and galvanic or caloric stimulation of the peripheral vestibular apparatus (Lopez and Blanke, 2011). This interconnected network of the primate brain with the parieto-insular vestibular cortex in its center (Guldin and Grüsser, 1998), together with the known wide-ranging influence of vestibular dysfunction on cognition (Smith and Darlington, 2013), suggests the importance of vestibular signaling in the cortex.
Rodents provide an experimental model system to delineate the contribution of vestibular signaling at the cellular and microcircuit levels. Indeed, electrophysiological data from freely behaving rats and mice implicate several cortical systems in spatial navigation and include the place-encoding cells in the hippocampus, head-direction encoding cells in the thalamus, postsubiculum, and retrosplenial cortices, and the relatively recently discovered grid cells of the medial entorhinal cortex (Hartley et al., 2013). Electrophysiological investigation of vestibular input to the forebrain in rodents to date was limited to the hippocampus (Cuthbert et al., 2000; Stackman et al., 2002; Horii et al., 2004; Smith et al., 2005), but changes in glucose uptake measured via positron emission tomography were shown to be widespread after galvanic vestibular stimulation in the rat brain (Best et al., 2014).
To determine directly the extent of vestibular signaling across cortical brain areas in the rat, we have performed a brain-wide mapping study using functional magnetic resonance imaging and extracellular electrophysiology. We find that ascending vestibular signals are distributed widely and can, even in anesthetized preparations, evoke local activity in sensory, motor, limbic, and frontal cortical areas. In contrast to other sensory modalities, we suggest that there is no primary vestibular cortical area in rodents, but rather the integration of self-reference related information occurs over disparate cortical areas that mediate diverse sensorimotor and higher-order cognitive functions.
Materials and Methods
For functional magnetic resonance imaging (fMRI) and electrophysiological experiments, male Lister hooded rats (Harlan; 339 ± 7 g body weight; range, 280–395 g; n = 22) were used. For the development of the VN stimulation surgery and images in Figure 1A, adult Wistar rats of either sex were used. Animals were anesthetized with 1.1–1.6 g/kg body weight urethane (U2500; Sigma-Aldrich) injected intraperitoneally. During surgery and recording, the animal's body temperature was monitored using a rectal probe and maintained at 37°C. All procedures were approved by the local ethics committee and the U.K. Home Office under the Animals (Scientific Procedures) Act 1986.
Figure 1.
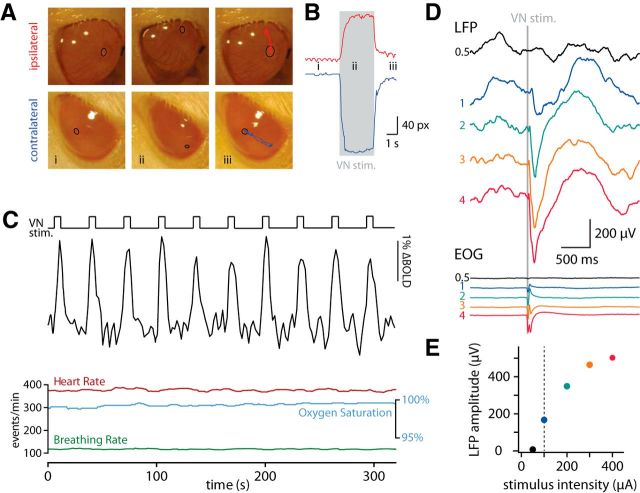
VN stimulation during fMRI and LFP recordings. A, Still images from video recordings of the ipsilateral and contralateral eye before (i), during (ii), and after (iii) VN stimulation. The pupil, marked with a black ellipse, was tracked manually (iii) in NIH ImageJ Manual Tracker. B, Distance (in pixels) of the pupil from its start location. The time of the still images is marked. C, Time course of BOLD signal of the whole recorded volume and simultaneously recorded physiological parameters during VN stimulation. The nerve was stimulated for 6 s every 32 s with 0.1 ms pulses delivered at 333 Hz. D, LFPs recorded 1300 μm deep in retrosplenial cortex after VN stimulation (gray shaded area) of different intensities. Bottom, Electrooculograms (EOG) recorded from the contralateral eye. Averages of 48–52 trials. The different colors indicate different stimulation intensities expressed in multiples of eye-movement threshold determined at the beginning of the experiment (100 μA). E, LFP amplitude plotted against stimulation intensity (data from D). The dotted line represents the eye-movement threshold.
VN stimulation.
We approached the right middle ear through the external ear canal, removing the tympanic membrane, the malleus, and the incus. After cauterizing the pterygopalatine artery located between the crura of stapes (Bovie Hit1 and H121 vasectomy tip; Bovie Medical), the stapes itself was removed to provide access to the inner ear through the oval window (Potegal et al., 1975). A Teflon-coated, chlorided silver wire (coated diameter, 0.007 inches; A-M Systems) was inserted through the oval window toward the anterior VN, whereas another chlorided silver wire was inserted under the skin on the side of the animal. For electrophysiology experiments, a twisted pair was inserted in the inner ear to minimize stimulation artifacts. The wires were connected to a battery-driven current source (A385R; World Precision Instruments). Correct location of the stimulating electrode was assessed by low current threshold (range, 30–200 μA) evoked vestibulo-ocular eye movements (Fig. 1A,B). The stimulation electrode was secured using a cyanoacrylate-based tissue adhesive. Initial experiments established 0.5 ms monophasic pulses at 333 Hz to have the lowest threshold for evoked eye movements, so this stimulus was used in all consequent experiments. We never observed auditory cortex activation or macroscopic nose, whisker, neck, or other muscle movement with the stimulation intensities used in this study, indicating that direct activation of the VN had very little or no effect on the auditory and facial nerves.
fMRI.
After VN surgery, animals were placed into a 7 T small-animal scanner (Bruker), and the functional connectivity of the VN was mapped with electric stimulation-driven fMRI (Canals et al., 2008, 2009). Physiological parameters (heart rate, oxygen saturation, and breathing rate) were constantly monitored. The VN was stimulated with 0.5 ms monophasic pulses at 333 Hz for a duration of 2 s (coronal slices) or 6 s (horizontal slices) every 32 s. fMRI was done in either seven horizontal or coronal slices using a gradient echo-echo planar imaging sequence with the following parameters: 4 × 4 cm field of view; 1 mm slice thickness; 128 × 128 matrix, giving a voxel size of 0.312 × 0.312 × 1 mm; four segments; 35° flip angle; 15 ms echo time (TE); and 500 ms repetition time (TR). T2-weighted anatomical images with the same geometry and double in-plane resolution (matrix of 256 × 256) were collected using a rapid acquisition relaxation enhanced sequence (RARE), applying the following parameters: TEeffective of 80 ms; TR of 5 s; and a RARE factor of 8. The saddle coil was used for both transmission and reception of radiofrequency signals. The MR system was controlled by a PharmaScan console (ParaVision 4; Bruker) running under the Linux operating system. fMRI data were analyzed offline using our own software developed in MATLAB (MathWorks) and including the statistical parametric mapping packages (SPM8) as detailed in previous publications (Canals et al., 2008, 2009). Briefly, all images were realigned using as reference a smoothed version (FWHM of 5 mm) of the mean functional images and interpolating with a fourth-degree B-spline. Realignment parameters were used to discard sessions with excessive head movement (half of the voxel size). Realigned images were coregistered and normalized (nonrigid registration) to a rat brain template in Paxinos and Watson stereotaxic space (Schweinhardt et al., 2003), including the digitalized atlas (Schwarz et al., 2006). After linear detrending, temporal filtering (0.015–0.2 Hz) and spatial filtering (isotropic Gaussian filter of 2 voxels radius) of voxel time series, general linear model (GLM) analysis was applied with a boxcar convolved with a gamma probability density function, to account for the hemodynamic delay in the blood oxygen level-dependent (BOLD) signal. Functional maps for individual animals were generated from voxels that have a significant component for the model (p < 0.001, uncorrected) and are clustered together in space. Group analysis in the GLM context was performed by concatenating individual design matrices and using SPM8-GLM tools. Statistical correction was performed with AFNI (Automated Functional Neuro-Imaging) AlphaSim (Biophysics Research Institute, Medical College of Wisconsin) and the familywise error implemented in SPM8 (see Notes).
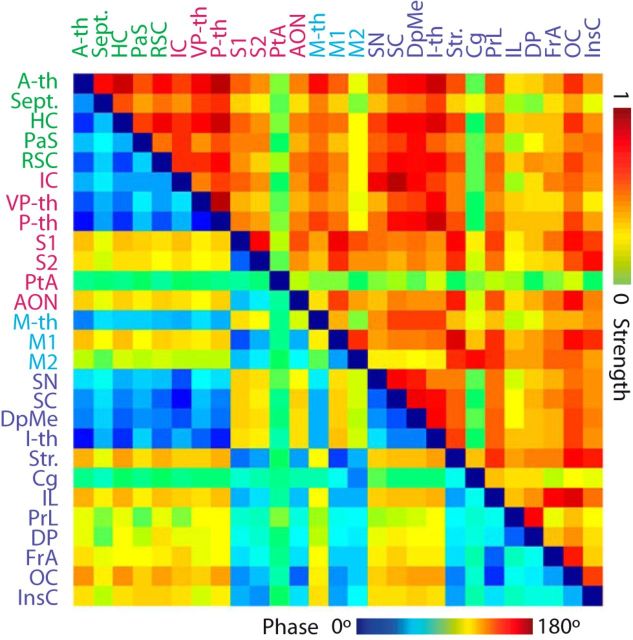
To build the connectivity matrix, we first defined regions of interest (ROIs) by coregistering the statistically significant fMRI maps with the digitalized Paxinos rat brain atlas (Schwarz et al., 2006). Average BOLD time series across all voxels in each ROI were obtained, and, finally, the correlations of the mean BOLD signals between matched pairs were calculated. The connectivity matrix shows in its upper part (above the main diagonal) the absolute values of the correlation coefficient and in the lower part (below the main diagonal) the phase shifts between mean BOLD signals calculated as the arccosine of the correlation coefficient.
Extracellular electrophysiology.
After VN surgery, animals (n = 17) were put in a stereotaxic frame (Angle Two; Leica), and single or multiple small craniotomies were drilled using a dental drill (Success 40; Osada Electric). Linear silicon probes with 16 sites spaced at 100 μm (A16-5/10 mm-100-413; NeuroNexus) were lowered into the target area. Broadband extracellular signals were sampled at 24414 Hz during VN stimulation (10 × 0.5 ms pulses at 333 Hz) of multiple intensities using a TDT RZ2 system with a PZ2-32 preamplifier (Tucker Davies Technologies). We marked the location of probes by painting their backs with DiI (Life Technologies). After the recordings, brains were fixed in 4% paraformaldehyde overnight, and 100–150 μm slices were cut on a vibrating microtome and counterstained with 4′,6-diamidino-2-phenylindole (DAPI).
Data were analyzed with a custom-written MATLAB toolbox interfaced with a FileMaker (FileMaker) database. Stimulation artifacts were removed by linear interpolation. Spontaneous changes of brain state, resembling natural sleep, are present in urethane-anesthetized rats (Clement et al., 2008). We separated brain states based on the frequency content of the local field potential (LFP; Gervasoni et al., 2004). During most of our recordings, the deactivated state dominated, and we found no significant differences between evoked LFPs recorded during deactivated and activated states; thus, we only included data recorded during deactivated state in our analyses. To obtain LFPs, raw data were low-pass filtered at 500 Hz, downsampled to 1 kHz, and averaged across trials. Negative deflections in the LFP signal were detected and classified as evoked potentials for additional analysis when bigger than three times the SD in a 250 ms window preceding the stimulus. When multiple electrode sites were present in the same brain region, we chose the largest LFP. LFP scores were calculated by norm[norm(probabilitya × amplitudea)/norm(thresholda × peak timea)], where “a” denotes area average and norm denotes division by the maximal value across all areas (for an empirical description, see Results). Ipsilateral and contralateral responses did not differ significantly and were pooled. For multiunit activity, data were bandpass filtered between 0.3 and 5 kHz, and spikes were detected using a threshold set to five times the SD of the signal. Evoked multiunit activity was deemed significant when bigger than three times the SD in a 250 ms window preceding the stimulus.
Results
We developed a surgical approach for the stimulation of the anterior branch of the VN via the oval window (see Materials and Methods). Placement of the stimulating electrode was confirmed by assessing vestibular-evoked eye movements in response to stimulation at low intensity (<200 μA; Fig. 1A,B). The simple, three-neuron arc of the vestibulo-ocular reflex (Blazquez et al., 2004) ensures faithful reporting of vestibular stimulation. After securing the electrode in place, animals were placed in either of the following: (1) inside a 7 T MRI system and BOLD signals were recorded in response to VN stimulation (Fig. 1C) or (2) in a stereotaxic frame and multisite silicon probes were positioned under stereotaxic guidance to obtain LFP and multiunit recordings (Fig. 1D,E).
fMRI
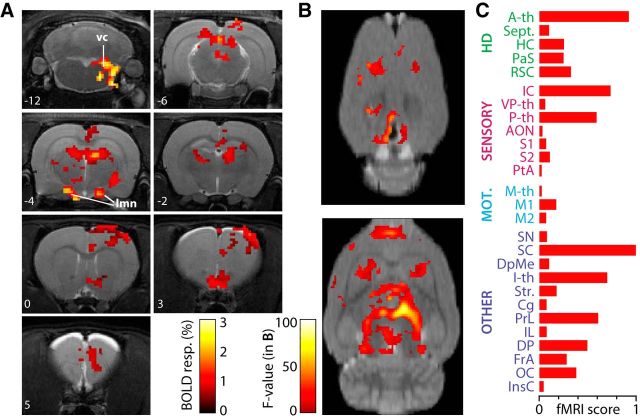
In fMRI experiments, we recorded BOLD response to VN stimulation at 1.5 times the threshold for evoking eye movements, which was found not to affect physiological parameters, including heart and breathing rates and oxygen saturation (Fig. 1C). Under these conditions, we detected large-amplitude and robust BOLD responses (Fig. 1C). Consistent with known vestibular projection pathways (Barmack, 2003; Shinder and Taube, 2010), we found VN stimulation-evoked functional activations in the brainstem vestibular complex, the lateral mammillary bodies, and the anterodorsal thalamic nucleus (Fig. 2A). In addition, widespread thalamic and cortical activation followed VN stimulation that was clearly identified at the individual (Fig. 2A) and group (n = 5; Fig. 2B) levels. A complete representation of the generated functional maps at the group level under VN stimulation is shown across brain imaging slices and statistical thresholds (see Notes). In addition to the voxelwise analysis (Fig. 2A,B), we performed a brain-wide region-based analysis using automatic coregistration of the functional images with a rat brain digital atlas (Schwarz et al., 2006) to quantify the strength and spatial distribution of vestibular activation throughout the forebrain. ROIs with activated voxels were grouped according to four general functional groups: (1) head-direction related; (2) sensory; (3) motor; and (4) a group containing mainly multifunctional structures (other). The fMRI score was calculated for every ROI by multiplying the average BOLD amplitude with the percentage of active voxels (p < 0.05, corrected) in the total ROI volume and normalized to the maximum (Fig. 3), so the fMRI score of the most activated brain region is 1. We also imposed an activation threshold of 2% of the ROI volume (Fig. 3, dotted line). This threshold may eliminate positive regions but allows for correcting coregistration misalignments between the functional images and the digital atlas, as evaluated under visual inspection. The highest fMRI scores were observed in the inferior and superior colliculi of the mesencephalon, in the anterior, posterior, and intralaminar thalamus of the diencephalon, and in prelimbic and peduncular cortices of the telencephalon (Fig. 2C).
Figure 2.
VN stimulation triggered BOLD maps. A, Example of BOLD maps from a representative animal, thresholded (p < 0.001, uncorrected) and overlaid on coronal T2-weighted (RARE) anatomical scans, showing active brain areas during VN stimulation. Numbers on the images refer to approximate distances from bregma in millimeters. vc, Brainstem vestibular complex; lmn, lateral mammillary nucleus. B, Average BOLD map (n = 5; p < 0.05, corrected) during VN stimulation. Two horizontal slices are shown at the cortical surface level (top) and 4 mm below (bottom). Brain-wide average BOLD maps across all imaging slices and several statistical thresholds are presented elsewhere (see Notes). C, Calculated fMRI scores based on ROI analysis for brain areas in four functional groups. HD, Head-direction related. Abbreviations according to Table 1.
Figure 3.
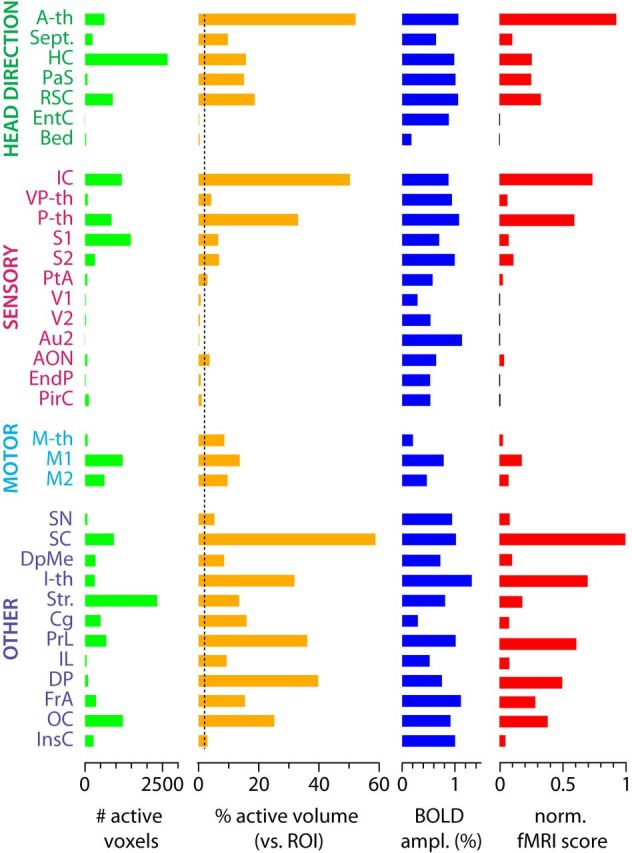
Quantitative description of the fMRI results. Number of active voxels, percentage of active volume versus whole ROI volume, BOLD amplitude, and normalized fMRI score for all brain areas containing significant VN stimulation-evoked activity (p < 0.05, corrected). The areas have been grouped according to their function. The dotted line represents the active volume threshold applied. Areas below threshold are represented by gray bars in the fMRI score graph. Abbreviations according to Table 1.
In the head direction-related system, the strongest activation was observed in the anterior thalamic nuclei, followed by the retrosplenial cortex, hippocampus, and parasubiculum, with moderate evoked activity in the septum. For the sensory group, the inferior colliculus, a multisensory mesencephalic area, was strongly activated, as was the posterior thalamic group. Moderate but significant activity was detected in the anterior olfactory nucleus, ventral posterior thalamus, primary and secondary somatosensory cortices, and parietal association cortex. In comparison, motor areas were less activated and mostly restricted to primary and secondary motor cortices.
For the multifunctional areas, the substantia nigra and deep mesencephalic nucleus showed significant activation. The superior colliculus, receiving multisensory information and sending orienting motor commands, was also strongly activated. We have found strong VN-evoked activity in the intralaminar thalamic nuclei and one of their known projection targets, the striatum. The insular cortex, involved in visceral function, was also activated. In addition, regions of the prefrontal cortex, most notably, prelimbic, dorsal peduncular, and cingulate cortices showed strong response to VN stimulation.
Several regions were not systematically acquired and thus were excluded from our analysis. They included the brainstem, cerebellum, amygdala and hypothalamus, olfactory bulb, and entorhinal cortex. Functional imaging in some of these excluded regions, such as the amygdala and the entorhinal cortex, is primarily affected by susceptibility artifacts induced by the proximity of the auditory bulla and ear canals, whereas others, such as the cerebellum, are affected by movement artifacts associated with heartbeat and respiration that affect imaging quality and reliability.
Electrophysiological assessment of evoked activity maps
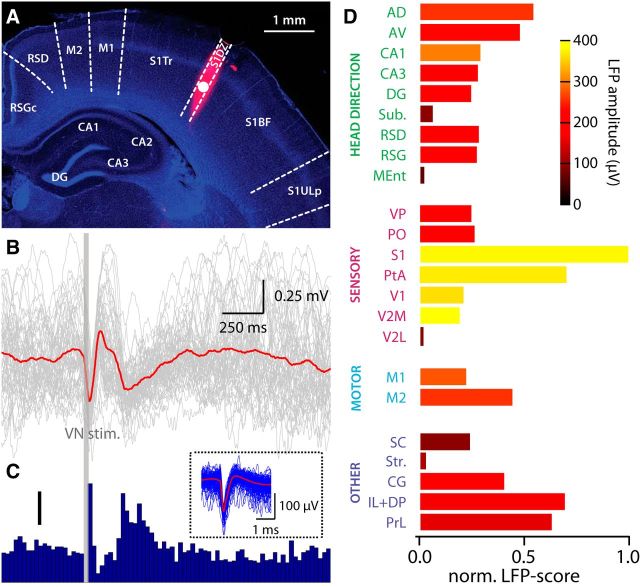
In a complimentary set of experiments, we performed extracellular recordings from many of the above listed areas (Table 1). Recording electrodes were marked with DiI to determine their location in post hoc histological analysis (Fig. 4A), and precise targeting was confirmed for all penetrations. In all extracellular recording locations in which we previously observed significant changes in BOLD signals, we also observed evoked LFPs and multiunit spiking (Fig. 4B,C). Conversely, even with three times the stimulus intensity used to evoke eye movements, no evoked LFP or spiking activity was evident in brain locations absent from the evoked fMRI activity map, such as the piriform cortex (Fig. 5).
Table 1.
List of abbreviations
| Brain area | Definition |
|---|---|
| fMRI | |
| A-th | Anterior thalamic nuclei |
| AON | Anterior olfactory nucleus |
| Au2 | Secondary auditory cortex |
| Bed | Bed nucleus of the stria terminalis |
| Cg | Cingulate cortex |
| DP | Dorsal peduncular cortex |
| DpMe | Deep mesencephalic nucleus |
| EndP | Endopiriform nucleus |
| EntC | Entorhinal cortex |
| FrA | Frontal association cortex |
| HC | Hippocampal formation |
| I-th | Interlaminar thalamic nuclei |
| IC | Inferior colliculus |
| IL | Infralimbic cortex |
| InsC | Insular cortex |
| M-th | Ventral anterior and ventrolateral thalamic nuclei |
| M1 | Primary motor cortex |
| M2 | Secondary motor cortex |
| OC | Orbital cortex |
| P-th | Posterior thalamic nuclei |
| PaS | Parasubiculum |
| PirC | Piriform cortex |
| PrL | Prelimbic cortex |
| PtA | Parietal association cortex |
| RSC | Retrosplenial cortex |
| S1 | Primary somatosensory cortex |
| S2 | Secondary somatosensory cortex |
| SC | Superior colliculus |
| Sept. | Septum |
| SN | Substantia nigra |
| Str. | Striatum |
| V1 | Primary visual cortex |
| V2 | Secondary visual cortex |
| VP-th | Ventral posterior thalamic nuclei |
| Electrophysiology | |
| AD | Anterodorsal thalamic nucleus |
| AV | Anteroventral thalamic nucleus |
| CA1 | Field CA1 of the hippocampus |
| CA2 | Field CA2 of the hippocampus |
| CA3 | Field CA3 of the hippocampus |
| Cg | Cingulate cortex |
| DG | Dentate gyrus |
| DP | Dorsal peduncular cortex |
| IL | Infralimbic cortex |
| M1 | Primary motor cortex |
| M2 | Secondary motor cortex |
| MEnt | Medial entorhinal cortex |
| Pir. | Piriform cortex |
| PO | Posterior thalamic nuclear group |
| PrL | Prelimbic cortex |
| PtA | Parietal association cortex |
| RSD | Dysgranular retrosplenial cortex |
| RSG | Granular retrosplenial cortex |
| S1 | Primary somatosensory cortex |
| S1BF | S1, barrel field |
| S1DZ | S1, dysgranular zone |
| S1Tr | S1, trunk region |
| S1ULp | S1, upper lip region |
| SC | Superior colliculus |
| Str. | Striatum |
| Sub. | Subiculum |
| V1 | Primary visual cortex |
| V2L | Lateral secondary visual cortex |
| V2M | Medial secondary visual cortex |
| VP | Ventral posterior thalamic nuclei |
Figure 4.
VN stimulation-evoked electrophysiological signals. A, Coronal brain slice 3.0 mm posterior to bregma, showing recording electrode track (DiI, red) over a DAPI (blue) background. B, Evoked LFPs (gray, individual trials; red, average) recorded from 1200 μm deep in primary somatosensory cortex (white circle in A) after VN stimulation (dark gray bar). Average of 55 trials. C, Peristimulus time histogram showing evoked multiunit activity after VN stimulation (dark gray bar). Bin size, 25 ms. Scale bar, 0.5 spikes per trial. Inset, Two hundred individual spikes (blue) and average spike waveform (red) of multiunit signals. Same recording as A and B. D, Normalized evoked LFP scores from several different brain regions. The color coding shows the amplitude of the first negative peak in the LFP. Abbreviations according to Table 1.
Figure 5.
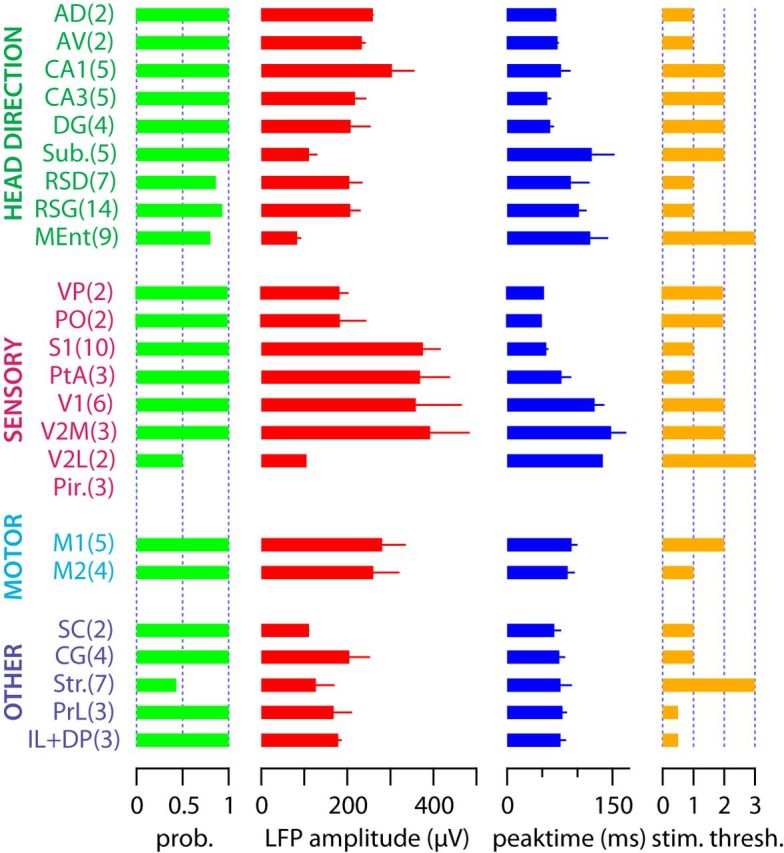
Quantification of evoked LFP responses. The first column shows the probability of evoking LFP responses at three times the eye movement threshold. The second and third columns show the amplitude and time from stimulus onset of the negative peak of the evoked LFP signal, also at three times the eye-movement threshold. The fourth column shows the normalized stimulation threshold for evoking LFP responses expressed in eye-movement threshold units. Error bars denote SEM. Recorded brain areas have been grouped according to their function; the number of observations is in parentheses. No statistical comparisons between areas were made. Abbreviations according to Table 1.
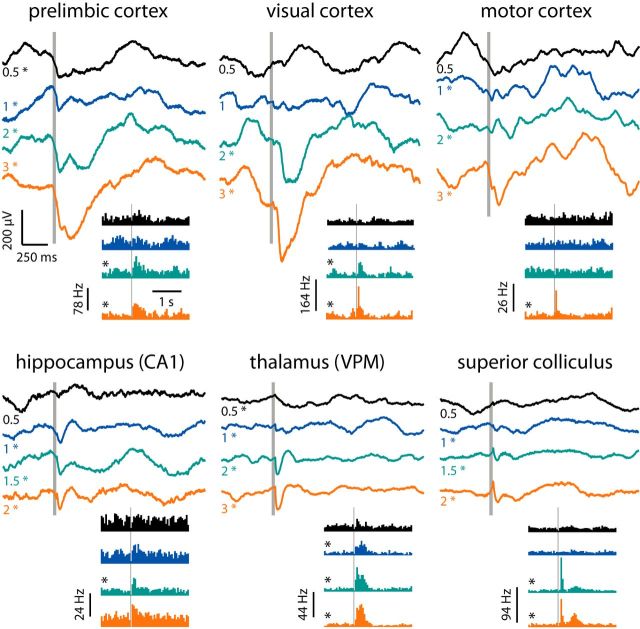
Stimulating the VN with different intensities produced intensity-dependent evoked potentials in all positive regions, characterized by a fast initial negative-going potential, typically followed by a slower positive deflection. In cortical recordings, the largest LFP was always recorded from the infragranular layers. Simultaneous recordings from both hemispheres indicated no difference between evoked LFP amplitudes recorded ipsilateral and contralateral to the stimulated nerve (n = 11 bilateral recordings, p = 0.30). In every area in which we could record evoked LFP responses, we could also detect significant changes in the firing rate of multiunit spiking activity (Fig. 6).
Figure 6.
Examples of evoked LFP and multiunit spiking responses. Average (n = 45–60 trials) evoked LFP responses after VN stimulation (gray bar) at different stimulation intensities expressed in eye-movement threshold (numbers on the left). Bottom right, Peristimulus time histograms of multiunit spiking activity. Gray bar, Stimulation time. Bin size, 50 ms. Recordings are examples from six brain areas. Asterisks denote significant evoked activity. VPM, Ventral posteromedial nucleus.
To quantify evoked responses, we calculated an LFP score from four measured parameters (Fig. 5; for a formal description, see Materials and Methods). We multiplied the probability of evoking responses with the negative peak amplitude of the LFP (both measured at three times eye movement threshold) and normalized across brain regions to obtain a measure of overall response strength (maximum strength of 1). To represent the functional distance from the VN, we multiplied the time of the negative peak of the LFP with the stimulation threshold required to evoke a significant LFP response, normalizing across brain areas (maximum distance of 1). We then divided response strength by functional distance and normalized this value to arrive to the LFP score (Fig. 4D). Thus, a brain area having an LFP score close to 1 will have fast, large-amplitude, low-threshold and high-probability evoked LFPs, whereas LFP scores closer to 0 will have the opposite.
Across all brain regions, the highest scoring areas were the primary somatosensory cortex, parietal association cortex, and areas of the medial prefrontal cortex. In the head direction-related functional group, the anterodorsal and anteroventral thalamic nuclei had the highest LFP scores, followed by the CA1 and CA3 fields of the hippocampus and the two subdivisions of retrosplenial cortex. In the subiculum and medial entorhinal cortex, we recorded modest but significant evoked LFPs. In the sensory-related functional group, the highest LFP scores were found in the primary somatosensory cortex and parietal association cortex. Significant LFPs were also recorded from the ventral posterior and posterior nuclear groups of the thalamus. In visual cortical areas, primary and medial secondary visual cortices had large but slow evoked LFPs, whereas the lateral secondary visual cortex had much more modest evoked responses. The secondary motor cortex showed larger responses than the primary motor cortex. In the multifunctional group, the striatum had variable, but significant evoked LFPs, whereas the superior colliculus, cingulate cortex, and infralimbic, dorsal peduncular, and prelimbic cortices had low-threshold, fast evoked responses, resulting in high LFP scores. Together, these results show a good topographic correspondence between the recorded electrophysiological and fMRI signals. Furthermore, we observed no correlation between peak time and amplitude of cortical vestibular activation (r = 0.03), indicating the activation of multiple ascending pathways of variable synaptic length.
In addition to providing spatial activity maps, the nature of fMRI data allows for direct comparison of the temporal evolution of responses in different brain regions. A closer look into the BOLD signal time courses revealed differences in the temporal evolution of responses to VN stimulation in different brain regions. To quantify this observation, we computed the cross-correlation between the mean BOLD signals for all identified ROIs. This resulted in a pattern of coactivation of ROIs whereby functionally related regions tended to cluster together according to the phase of the evoked BOLD signal (Fig. 7). For example, head direction-related areas were in-phase with each other, as well as thalamic and mesencephalic areas. In contrast, the phase of somatosensory, motor, and frontal cortical areas was out-of-phase with the head direction-related areas. The absolute correlation strength shows a similar pattern and as a whole suggests functional compartmentalization of vestibular-evoked activity.
Figure 7.
Functional connectivity fingerprint in response to VN stimulation. The average BOLD signal across all voxels in particular brain regions (ROIs) modulated by vestibular stimulation was first calculated and then cross-correlated between all ROIs. The strength of the functional coupling between ROIs, measured as the absolute correlation coefficient and the temporal aspects of the response, measured as phase shifts between the BOLD signals, were first calculated for each subject and the averaged across the population (n = 5). The combined strength (yellow-red scale) and phase (blue-red scale) connectivity matrix is presented. Abbreviations according to Table 1.
Discussion
We have mapped the extent of vestibular activation throughout the rat forebrain by recording BOLD, LFP, and multiunit activity evoked by the electrical stimulation of the anterior branch of the VN. The intensity thresholds and temporal properties of the stimulus used here were set to the minimum required to evoke eye movements and unlikely to mimic the dynamic complexity of natural head movements. Although the propagation of vestibular signals through polysynaptic pathways may be attenuated by anesthesia (Walzl and Mountcastle, 1949), we nevertheless find widespread activation across different functional modalities. We found no quantitative difference in bilaterally recorded LFP amplitudes. This is consistent with the strong commissural interconnectivity of the VNs and the bilateral push–pull nature of the vestibular system but is contrary to the idea of lateralization of vestibular-evoked metabolic changes in rat cortex measured with positron emission tomography (Best et al., 2014). Evoked activity was found through four functionally delineated groups of brain regions, including head direction-related, sensory, motor, and multifunctional areas. The existence and correlation of evoked responses observed within and across these groups may reflect functionally dedicated ascending vestibular pathways.
For head direction-related areas, our data highlight the hippocampus, subiculum, retrosplenial cortex and the anterior thalamic group as having the strongest vestibular activation. Head direction cell activity is known to depend on vestibular input (Muir et al., 2009) reaching the forebrain via the vestibular nucleus → lateral mamillary body → anterodorsal thalamic nucleus route (Shinder and Taube, 2010). However, vestibular effects related to spatial navigation are not limited to the head-direction system. Vestibular activity has been shown in the hippocampus of guinea pigs (Cuthbert et al., 2000) and rats (Horii et al., 2004), and inactivation of the peripheral vestibular apparatus impairs hippocampal place cell firing (Stackman et al., 2002; Russell et al., 2003) and theta oscillations (Russell et al., 2006), whereas the loss of vestibular input is associated with hippocampal atrophy in humans (Brandt et al., 2005).
The contribution of vestibular information to sensorimotor processing beyond the brainstem–cerebellar circuits mediating vestibular-evoked gaze and head-stabilizing and postural vestibulospinal reflexes (Barmack, 2003) is poorly understood. Although no muscle activity other than eye movements were detected during our stimulus paradigm, we cannot rule out that some of the central-evoked signals are related to the aforementioned reflexes, akin to an efference copy. Nevertheless, our data show substantial vestibular signaling in several primary sensory and motor cortical areas. Cross-species experimental and theoretical studies highlight the potential role for different self-centered reference frames (e.g., eye centered, head centered, body centered) for sensory integration, motor planning, and execution (Cohen and Andersen, 2002). Vestibular signaling is one proposed crucial component of such reference frames used for multimodal integration (Angelaki and Cullen, 2008; Chen et al., 2013). Our results highlight several areas in rodents that may be involved in these processes: motor cortex, somatosensory cortex, parietal association cortex, and visual cortices all receive vestibular activation with significant and widespread thalamic activation, consistent with diffuse thalamic projections from the vestibular nuclei (Shiroyama et al., 1999). Interestingly, rats seem not to have developed a hub vestibular area homologous to the parieto-insular vestibular cortex of primates (Guldin and Grüsser, 1998).
One unexpected area shown to have evoked responses was the prefrontal cortex, a multifunctional area often associated with executive function and working memory. Expression of synaptic proteins and monoamine transporters in this area, as well as the medial temporal lobe, have been shown to be significantly altered in rats after vestibular lesion (Goddard et al., 2008a,b). The prefrontal cortex is also implicated in the regulation of autonomic functions (Verberne, 2011), and vestibular–autonomic responses are known to affect blood pressure and respiratory activity during movement and postural changes (Yates and Bronstein, 2005). Thus, it is possible that the observed vestibular activation of the infralimbic and dorsal peduncular cortices is linked to autonomic function.
Our whole-brain mapping reveals that vestibular input to the rodent cortex is widespread, affecting many functionally different areas. Some of these areas are homologous with primate vestibular maps (e.g., cingulate and somatosensory cortex; for a comprehensive review, see Lopez and Blanke, 2011), whereas others seem to be specific to rodents (e.g., medial prefrontal cortex). The availability of molecular tools in rodents should permit experimental manipulation of these pathways to dissect the precise contribution of vestibular signals to various cortical functions.
Notes
Supplemental Movie 1 for this article is available at http://dx.doi.org/10.6084/m9.figshare.1320771. The movie shows functional maps of VN stimulation-evoked activity across imaging slices and statistical thresholds. This material has not been peer reviewed.
Footnotes
E.A.R. held a Sir Henry Wellcome Fellowship from the Wellcome Trust (Grant 085509/Z/08/Z). F.D. and T.W.M. were funded by the Medical Research Council (Grant MC_U1175975156). J.M. and S.C. were funded by the Spanish Ministry of Education and Science (Grant BFU 2012-39958). The Institute of Neuroscience of Alicante is a Severo Ochoa Center of Excellence.
The authors declare no competing financial interests.
References
- Angelaki DE, Cullen KE. Vestibular system: the many facets of a multimodal sense. Annu Rev Neurosci. 2008;31:125–150. doi: 10.1146/annurev.neuro.31.060407.125555. [DOI] [PubMed] [Google Scholar]
- Barmack NH. Central vestibular system: vestibular nuclei and posterior cerebellum. Brain Res Bull. 2003;60:511–541. doi: 10.1016/S0361-9230(03)00055-8. [DOI] [PubMed] [Google Scholar]
- Best C, Lange E, Buchholz HG, Schreckenberger M, Reuss S, Dieterich M. Left hemispheric dominance of vestibular processing indicates lateralization of cortical functions in rats. Brain Struct Funct. 2014;219:2141–2158. doi: 10.1007/s00429-013-0628-1. [DOI] [PubMed] [Google Scholar]
- Blazquez PM, Hirata Y, Highstein SM. The vestibulo-ocular reflex as a model system for motor learning: what is the role of the cerebellum? Cerebellum. 2004;3:188–192. doi: 10.1080/14734220410018120. [DOI] [PubMed] [Google Scholar]
- Borel L, Lopez C, Péruch P, Lacour M. Vestibular syndrome: a change in internal spatial representation. Neurophysiol Clin. 2008;38:375–389. doi: 10.1016/j.neucli.2008.09.002. [DOI] [PubMed] [Google Scholar]
- Brandt T, Schautzer F, Hamilton DA, Brüning R, Markowitsch HJ, Kalla R, Darlington C, Smith P, Strupp M. Vestibular loss causes hippocampal atrophy and impaired spatial memory in humans. Brain. 2005;128:2732–2741. doi: 10.1093/brain/awh617. [DOI] [PubMed] [Google Scholar]
- Canals S, Beyerlein M, Murayama Y, Logothetis NK. Electric stimulation fMRI of the perforant pathway to the rat hippocampus. Magn Reson Imaging. 2008;26:978–986. doi: 10.1016/j.mri.2008.02.018. [DOI] [PubMed] [Google Scholar]
- Canals S, Beyerlein M, Merkle H, Logothetis NK. Functional MRI evidence for LTP-induced neural network reorganization. Curr Biol. 2009;19:398–403. doi: 10.1016/j.cub.2009.01.037. [DOI] [PubMed] [Google Scholar]
- Chen X, Deangelis GC, Angelaki DE. Diverse spatial reference frames of vestibular signals in parietal cortex. Neuron. 2013;80:1310–1321. doi: 10.1016/j.neuron.2013.09.006. [DOI] [PMC free article] [PubMed] [Google Scholar]
- Clement EA, Richard A, Thwaites M, Ailon J, Peters S, Dickson CT. Cyclic and sleep-like spontaneous alternations of brain state under urethane anaesthesia. PLoS One. 2008;3:e2004. doi: 10.1371/journal.pone.0002004. [DOI] [PMC free article] [PubMed] [Google Scholar]
- Cohen YE, Andersen RA. A common reference frame for movement plans in the posterior parietal cortex. Nat Rev Neurosci. 2002;3:553–562. doi: 10.1038/nrn873. [DOI] [PubMed] [Google Scholar]
- Cullen KE. The vestibular system: multimodal integration and encoding of self-motion for motor control. Trends Neurosci. 2012;35:185–196. doi: 10.1016/j.tins.2011.12.001. [DOI] [PMC free article] [PubMed] [Google Scholar]
- Cuthbert PC, Gilchrist DP, Hicks SL, MacDougall HG, Curthoys IS. Electrophysiological evidence for vestibular activation of the guinea pig hippocampus. Neuroreport. 2000;11:1443–1447. doi: 10.1097/00001756-200005150-00018. [DOI] [PubMed] [Google Scholar]
- Gervasoni D, Lin SC, Ribeiro S, Soares ES, Pantoja J, Nicolelis MAL. Global forebrain dynamics predict rat behavioral states and their transitions. J Neurosci. 2004;24:11137–11147. doi: 10.1523/JNEUROSCI.3524-04.2004. [DOI] [PMC free article] [PubMed] [Google Scholar]
- Goddard M, Zheng Y, Darlington CL, Smith PF. Synaptic protein expression in the medial temporal lobe and frontal cortex following chronic bilateral vestibular loss. Hippocampus. 2008a;18:440–444. doi: 10.1002/hipo.20416. [DOI] [PubMed] [Google Scholar]
- Goddard M, Zheng Y, Darlington CL, Smith PF. Monoamine transporter and enzyme expression in the medial temporal lobe and frontal cortex following chronic bilateral vestibular loss. Neurosci Lett. 2008b;437:107–110. doi: 10.1016/j.neulet.2008.03.073. [DOI] [PubMed] [Google Scholar]
- Guldin WO, Grüsser OJ. Is there a vestibular cortex? Trends Neurosci. 1998;21:254–259. doi: 10.1016/S0166-2236(97)01211-3. [DOI] [PubMed] [Google Scholar]
- Hartley T, Lever C, Burgess N, O'Keefe J. Space in the brain: how the hippocampal formation supports spatial cognition. Philos Trans R Soc B Biol Sci. 2013;369:20120510. doi: 10.1098/rstb.2012.0510. [DOI] [PMC free article] [PubMed] [Google Scholar]
- Hitier M, Besnard S, Smith PF. Vestibular pathways involved in cognition. Front Integr Neurosci. 2014;8:59. doi: 10.3389/fnint.2014.00059. [DOI] [PMC free article] [PubMed] [Google Scholar]
- Horii A, Russell NA, Smith PF, Darlington CL, Bilkey DK. Vestibular influences on CA1 neurons in the rat hippocampus: an electrophysiological study in vivo. Exp Brain Res. 2004;155:245–250. doi: 10.1007/s00221-003-1725-9. [DOI] [PubMed] [Google Scholar]
- Landgren S, Silfvenius H, Wolsk D. Vestibular, cochlear and trigeminal projections to the cortex in the anterior suprasylvian sulcus of the cat. J Physiol. 1967;191:561–573. doi: 10.1113/jphysiol.1967.sp008268. [DOI] [PMC free article] [PubMed] [Google Scholar]
- Lopez C, Blanke O. The thalamocortical vestibular system in animals and humans. Brain Res Rev. 2011;67:119–146. doi: 10.1016/j.brainresrev.2010.12.002. [DOI] [PubMed] [Google Scholar]
- Muir GM, Brown JE, Carey JP, Hirvonen TP, Della Santina CC, Minor LB, Taube JS. Disruption of the head direction cell signal after occlusion of the semicircular canals in the freely moving chinchilla. J Neurosci. 2009;29:14521–14533. doi: 10.1523/JNEUROSCI.3450-09.2009. [DOI] [PMC free article] [PubMed] [Google Scholar]
- Potegal M, Abraham L, Gilman S, Copack P. Technique for vestibular neurotomy in the rat. Physiol Behav. 1975;14:217–221. doi: 10.1016/0031-9384(75)90169-9. [DOI] [PubMed] [Google Scholar]
- Russell NA, Horii A, Smith PF, Darlington CL, Bilkey DK. Long-term effects of permanent vestibular lesions on hippocampal spatial firing. J Neurosci. 2003;23:6490–6498. doi: 10.1523/JNEUROSCI.23-16-06490.2003. [DOI] [PMC free article] [PubMed] [Google Scholar]
- Russell NA, Horii A, Smith PF, Darlington CL, Bilkey DK. Lesions of the vestibular system disrupt hippocampal theta rhythm in the rat. J Neurophysiol. 2006;96:4–14. doi: 10.1152/jn.00953.2005. [DOI] [PubMed] [Google Scholar]
- Schwarz AJ, Danckaert A, Reese T, Gozzi A, Paxinos G, Watson C, Merlo-Pich EV, Bifone A. A stereotaxic MRI template set for the rat brain with tissue class distribution maps and co-registered anatomical atlas: application to pharmacological MRI. Neuroimage. 2006;32:538–550. doi: 10.1016/j.neuroimage.2006.04.214. [DOI] [PubMed] [Google Scholar]
- Schweinhardt P, Fransson P, Olson L, Spenger C, Andersson JLR. A template for spatial normalisation of MR images of the rat brain. J Neurosci Methods. 2003;129:105–113. doi: 10.1016/S0165-0270(03)00192-4. [DOI] [PubMed] [Google Scholar]
- Shinder ME, Taube JS. Differentiating ascending vestibular pathways to the cortex involved in spatial cognition. J Vestib Res. 2010;20:3–23. doi: 10.3233/VES-2010-0344. [DOI] [PubMed] [Google Scholar]
- Shiroyama T, Kayahara T, Yasui Y, Nomura J, Nakano K. Projections of the vestibular nuclei to the thalamus in the rat: a Phaseolus vulgaris leucoagglutinin study. J Comp Neurol. 1999;407:318–332. doi: 10.1002/(SICI)1096-9861(19990510)407:3<318::AID-CNE2>3.0.CO%3B2-H. [DOI] [PubMed] [Google Scholar]
- Smith PF, Darlington CL. Personality changes in patients with vestibular dysfunction. Front Hum Neurosci. 2013;7:678. doi: 10.3389/fnhum.2013.00678. [DOI] [PMC free article] [PubMed] [Google Scholar]
- Smith PF, Zheng Y. From ear to uncertainty: vestibular contributions to cognitive function. Front Integr Neurosci. 2013;7:84. doi: 10.3389/fnint.2013.00084. [DOI] [PMC free article] [PubMed] [Google Scholar]
- Smith PF, Horii A, Russell N, Bilkey DK, Zheng Y, Liu P, Kerr DS, Darlington CL. The effects of vestibular lesions on hippocampal function in rats. Prog Neurobiol. 2005;75:391–405. doi: 10.1016/j.pneurobio.2005.04.004. [DOI] [PubMed] [Google Scholar]
- Stackman RW, Clark AS, Taube JS. Hippocampal spatial representations require vestibular input. Hippocampus. 2002;12:291–303. doi: 10.1002/hipo.1112. [DOI] [PMC free article] [PubMed] [Google Scholar]
- Verberne AJM. Modulation of autonomic function by the cerebral cortex. In: Llewellyn-Smith IJ, Verberne AJM, editors. Central regulation of autonomic functions. Ed 2. New York: Oxford UP; 2011. pp. 202–219. [Google Scholar]
- Walzl EM, Mountcastle VB. Projection of vestibular nerve to cerebral cortex of the cat. Am J Physiol. 1949;159:595. [Google Scholar]
- Yates BJ. Vestibular influences on the autonomic nervous system. Ann N Y Acad Sci. 1996;781:458–473. doi: 10.1111/j.1749-6632.1996.tb15720.x. [DOI] [PubMed] [Google Scholar]
- Yates BJ, Bronstein AM. The effects of vestibular system lesions on autonomic regulation: observations, mechanisms, and clinical implications. J Vestib Res. 2005;15:119–129. [PubMed] [Google Scholar]


