

Abstract
Several neural precursor populations contemporaneously generate neurons in the developing neocortex. Specifically, radial glial stem cells of the dorsal telencephalon divide asymmetrically to produce excitatory neurons, but also indirectly to produce neurons via three types of intermediate progenitor cells. Why so many precursor types are needed to produce neurons has not been established; whether different intermediate progenitor cells merely expand the output of radial glia or instead generate distinct types of neurons is unknown. Here we use a novel genetic fate mapping technique to simultaneously track multiple precursor streams in the developing mouse brain and show that layer 2 and 3 pyramidal neurons exhibit distinctive electrophysiological and structural properties depending upon their precursor cell type of origin. These data indicate that individual precursor subclasses synchronously produce functionally different neurons, even within the same lamina, and identify a primary mechanism leading to cortical neuronal diversity.
Keywords: electrophysiology, intermediate progenitor, layer 2/3, morphology, neurogenesis, radial glia
Introduction
Diverse networks of neocortical glutamatergic neurons and GABAergic interneurons encode the advanced computational power of the mammalian brain. Although it is unclear how the appropriate numbers and types of neurons are produced for this complex circuitry, recent work has shown that the neuronal progenitors that form the neocortex are more numerous and varied than previously thought. For example, excitatory neurons, which constitute ∼80% of neocortical neurons (Peters and Sethares, 1991; DeFelipe and Fariñas, 1992), are born from an assorted group of neural stem and progenitor cells. In particular, radial glial cells (RGCs), now recognized as the stem cells of the neocortex, undergo self-renewing cell divisions to generate neurons (a process termed direct neurogenesis) (Noctor et al., 2001, 2002), or give rise to at least three unique groups of intermediate progenitors (IPCs), which expand the neuronal output of RGCs. Specifically, RGCs divide to produce IPCs in the ventricular zone (VZ) termed apical IPCs (aIPCs, previously SNPs) (Gal et al., 2006; Mizutani et al., 2007; Stancik et al., 2010; Tyler and Haydar, 2013), basal IPCs (bIPCs), which form the subventricular zone (SVZ) and divide away from the ventricle (Englund et al., 2005; Kowalczyk et al., 2009; Elsen et al., 2013; Nelson et al., 2013), and basal radial glia (bRG) (Fietz et al., 2010; Hansen et al., 2010; Shitamukai et al., 2011; Wang et al., 2011). Recent studies indicate that the numbers of bIPCs and bRGs are markedly increased in mammals with large and complex neocortex compared with that of the rodent (Fietz et al., 2010; Hansen et al., 2010; Reillo et al., 2011; Shitamukai et al., 2011; Reillo and Borrell, 2012). As such, an emerging theory proposes that the number and relative proportions of IPC subtypes are responsible for the extensive growth of the neocortex in humans (LaMonica et al., 2013; Florio and Huttner, 2014; Lewitus et al., 2014), an evolutionary step that underlies our unique cognitive abilities. However, the primate neocortex has expanded primarily laterally, due to the symmetric divisions of ventricular zone founder cells before the onset of IPC production (Caviness et al., 1995; Rakic, 1995). In addition, because every known class of IPCs has been identified in rodent neocortex, IPCs may not solely function to increase brain size but may offer alternative contributions to neocortical development.
Although it is well appreciated that RGCs are progressively tuned to generate molecularly and morphologically distinct sets of excitatory neurons between the six neocortical layers (Rakic, 1972, 1974, 1975; Frantz and McConnell, 1996), whether IPCs merely expand neuronal production or instead make distinct types of neurons is unknown. As such, how subsets of pyramidal neurons are produced within individual cortical laminae is an open and fundamental question. Here we show for the first time that basic biophysical and morphological properties of pyramidal neurons are intrinsically specified at the precursor stage and that divergent routes of neurogenesis generate pyramidal neuron diversity. These data indicate that the multiple precursor cell types in the prenatal neocortex play a previously unrecognized foundational role in providing the different types of excitatory neurons necessary for circuit development.
Materials and Methods
T-box brain protein 2 (Tbr2)-Cre plasmid construction
A 2.5 kb fragment of DNA upstream of the TBR2 translation initiation site was amplified by PCR from mouse genomic DNA with Phusion high fidelity DNA polymerase (New England Biolabs). Restriction enzyme sites (KpnI and XhoI) were added to the sense and antisense primers to enable cloning into a Cre expression plasmid (sense: TTTACTGAGGTGGGGTTCCAG; antisense: GCTTTAGCGAATCGCAGACG). Amplified DNA was first purified with a QIAquick PCR purification kit (QIAGEN), digested with the appropriate restriction enzmyes, and gel purified along with the recipient Cre expression plasmid using the Qiaquick gel extraction kit. The Tbr2 promoter fragment was ligated into the Cre plasmid backbone using the Mighty Mix DNA ligation kit (Takara) and transformed into chemically competent DH5a cells (Invitrogen) for selection by growth on LB Amp agar plates. Cloning was confirmed by DNA sequencing.
In utero electroporation (IUE)
IUE was performed, as described previously (Gal et al., 2006), on timed pregnant CD-1 dams purchased from Charles River Laboratories at e14.5. Briefly, dams were anesthetized via intraperitoneal injection of a ketamine/xylazine mixture, and the uterine horns were exposed by midline laparotomy. One to two microliters of plasmid DNA mixed with 0.1% fast green dye (Sigma-Aldrich) was injected intracerebrally, through the uterine wall and amniotic sac, via a pulled glass micropipette. Cre and reporter plasmid DNA was mixed at a 1:1 ratio by copy number, and the final concentration of each plasmid was between 2 and 3 μg/μl. The anode of a Tweezertrode (Harvard Apparatus) was placed over the dorsal telencephalon above the uterine muscle, and four 35 V pulses (50 ms duration separated by a 950 ms interval) were applied with a BTX ECM830 pulse generator (Harvard Apparatus). Following electroporation, the uterine horns were returned to the abdomen and the cavity was filled with a warm 0.9% saline solution. The incisions were closed with silk or absorbable sutures depending on the duration of the experiment. Dams were then placed in a clean cage and monitored closely during recovery. These procedures were reviewed and approved by the Institutional Animal Care and Use Committee at the Boston University School of Medicine.
Immunohistochemistry and cell counting
For embryonic studies, the heads of electroporated embryos were harvested 24 h after IUE, fixed overnight in 4% PFA, and cryoprotected in 30% sucrose for 24–48 h. P21 brains were fixed by transcardiac perfusion with 4% PFA and then cryoprotected in 30% sucrose. The tissue was then frozen in OCT compound in tissue molds with an ethanol/dry ice bath. Frozen tissue was cut into 18 μm sections using a HM 560 Cryostar cryostat and mounted and dried on to superfrost slides.
Before immunostaining, antigen retrieval was performed by microwaving the cryosections in sodium citrate buffer (10 mm, pH 6) at 800 W for 1 min followed by 80 W for 10 min. Free-floating sections were then blocked in diluent (5% goat serum, 0.3% Triton X-100, 1 × PBS) for 1 h at room temperature. Incubation with primary antibodies, anti-Tbr2 (1:500, Abcam), anti-Brn1 (1:300, Santa Cruz Biotechnology), or anti-Satb2 (1:250, Abcam) was performed overnight at 4°C. Following three 5 min washes in PBS, sections were incubated for 2 h at room temperature in diluent containing the appropriate Alexa-633-conjugated secondary antibodies (1:250 for all). Sections were washed an additional 3 times for 5 min and mounted with Vectashield mounting medium containing DAPI. The 40× Z-stack images (14 μm) were acquired using an upright Zeiss LSM 710 microscope, and positive cells from n = 4 brains were identified and counted using LSM image browser software. For laminar distribution analysis, electroporated P21 brains were fixed (as above) and cut into 60 μm sections with a Leica VT1000S vibrating microtome. Tiled 40× Z-stack images (20 μm) of ZsGreen- and mCherry-expressing neurons, displaying the entire section from the pia matter to the white matter, were acquired using an upright Zeiss LSM 710 microscope equipped with a motorized stage and the MultiTime macro. ZsGreen+ and mCherry+ cells were manually scored and counted using the LSM image browser software. In our counting procedure, we classified cells as “ZsGreen+” if they expressed ZsGreen but contained no signal for mCherry. Correspondingly, cells were classified “mCherry+” if they contained mCherry signal, whether or not they were also ZsGreen+ due to perdurance of the fluorescent protein, to remaining copies of unrecombined reporter plasmid, or due to the presence of a subpopulation of precursors transitioning from an apical to a basal fate (Englund et al., 2005; Tyler and Haydar, 2013). The percentage of Tbr2 and non-Tbr2 lineage neurons and the location of their somata in representative sections from P21 brains (n = 4) were quantified and measured using LSM image browser, ImageJ, and Volocity.
Electrophysiology
Mice were sedated with isofluorane, killed by decapitation, and their brains rapidly removed and submerged in oxygenated (95% O2/5% CO2) ice-cold Ringer's solution, concentrations (in mm) as follows: 25 NaHCO3, 124 NaCl, 1 KCl, 2 KH2PO4, 10 glucose, 2.5 CaCl2, 1.3 MgCl2, pH 7.4 (Sigma-Aldrich). The frontal cortical hemispheres were dissected free and cut into 300-μm-thick acute coronal slices with a vibrating microtome. Slices were equilibrated for 1 h at room temperature in oxygenated Ringer's solution. Individual slices were positioned in submersion type recording chambers (Harvard Apparatus) on the stages of Nikon E600 IR-DIC microscopes (Micro Video Instruments) and continuously perfused with room temperature oxygenated Ringer's solution (2–2.5 ml/min). Slices were prepared from a total of 20 male mice over the course of 20 recording sessions.
Layer 2 and layer 3 pyramidal cells in the dorsal frontal cortex were visualized under IR-DIC optics and Tbr2 lineage (mCherry+), and non-Tbr2 lineage (ZsGreen+) neurons were identified under epifluorescence. Lineage identity was confirmed by confocal imaging of biocytin filled neurons. For assessment of electrophysiological properties and cell filling, whole-cell patch-clamp recordings were conducted as previously described (Rocher et al., 2010; Crimins et al., 2012). Electrodes were fabricated on a Flaming and Brown horizontal pipette puller (model P87, Sutter Instrument) and filled with potassium gluconate (KGlu) internal solution, concentrations (in mm) as follows: 122 KGlu, 2 MgCl2, 5 EGTA, 10 NaHEPES, 2 MgATP, 0.3 NaGTP, 1% biocytin, pH 7.4 (Sigma-Aldrich). In Ringer's solution, pipettes had a resistance of between 4 and 6 mΩ. Data were acquired with PatchMaster software (HEKA Elektronik) and EPC-9 and EPC-10 amplifiers (HEKA Elektronik). Signals were low-pass filtered at 10 kHz.
A series of hyperpolarizing and depolarizing current steps (200 ms or 2 s in duration) were applied to each cell to assess passive membrane, single action potential, and repetitive action potential firing rates as described previously (Rocher et al., 2010; Crimins et al., 2012). Thirty electrophysiological variables were assessed in this study and quantified as follows.
Passive properties.
The resting membrane potential (Vr) was defined as the stable membrane potential in the absence of current input, the input resistance (Rn) was calculated as the slope of the best-fit line the voltage-current plot, and the time constant (t) was determined by fitting a single exponential curve to a small hyperpolarizing current step.
Action potential properties.
Rheobase (Io), the minimum current needed to evoke an action potential, was measured as the amount of current injected at the first spike elicited by a slow depolarizing current ramp. Threshold was defined as the point at which the change in voltage at the onset of a spike was >10 mV/ms. Amplitude was quantified as the difference between the peak of the action potential and the threshold voltage. The hyperpolarizing sag was measured as the difference between the most negative membrane potential and steady state during a −170 hyperpolarizing current step, whereas the rebound depolarization (RD) was measured as the maximal positive voltage change above resting membrane potential following the current step. The “hump” amplitude was measured as the maximal membrane potential compared with the resting membrane potential during a depolarizing current step that failed to elicit an action potential. The amplitudes of fast and medium afterhyperpolarization (fAHP and mAHP) were determined as the difference between the action potential threshold and the negative deflection peak of the hyperpolarizing potential directly after the action potential, for the former, or at the medium component where the voltage drop slows to a rate <5 mV/ms, for the latter. The depolarizing after potential (DAP) was measured as the amplitude of the depolarizing voltage seen after the fAHP. Finally, the tAHP was measured as the time course from the onset to the offset of the mAHP.
Action potential firing pattern properties.
Interspike intervals (ISIs) between action potentials (ISI1, ISI2, ISI3 being the time between the first and second, second and third, and third and fourth action potentials, respectively) were assessed at minimal suprathreshold current. Frequency at steady state was calculated as the reciprocal of the average of the 4–9 ISIs, measured within the last 250 ms of the response to depolarizing current pulses where firing frequency remained relatively stable. Initial firing frequency adaptation, the percentage of decrease in frequency, was measured as the reciprocal of first and second ISIs. Late frequency adaptation is the percentage of decrease in the frequency from onset (reciprocal to the first ISI) to steady-state frequency.
Spontaneous excitatory postsynaptic currents (sEPSCs) were recorded for 2–5 min from a holding potential of −80 mV. Synaptic current data were analyzed using MiniAnalysis (Synaptosoft), with the detection threshold set at the maximum of the RMS noise level (5 pA). For each cell, the following characteristics of synaptic events were determined: frequency, amplitude, rise time constant, decay time constant, and area (integral). The rise time constant and the decay time constant were determined by fitting averaged traces to a single exponential function.
Single-cell morphometry
During the recording period, cells were filled with 1% biocytin. Following recordings, slices were sandwiched between filter paper disks and fixed in 4% PFA in 0.1 m PBS solution, pH 7.4, for 2 d. Following fixation, slices were rinsed in PBS (3 × 10 min) and then placed in 1% Triton X-100/PBS for 2 h at room temperature. Slices were then incubated in streptavidin-Alexa-405 (Invitrogen; 1:500) at 4°C for 2 d. Finally, slices were mounted on slides using Prolong Gold mounting medium (Invitrogen) and coverslipped.
Biocytin-filled cells were imaged using a Zeiss LSM-710 confocal laser-scanning microscope. Fluorescence emitted by Alexa-405 (405 nm diode laser excitation) was collected using a 410–499 nm bandpass filter. Lineage identity was confirmed by imaging and detection of mCherry and ZsGreen. Well-filled, brightly stained cells (15 non-Tbr2 and 19 Tbr2 lineage) were reconstructed in their entirety for morphometric analysis, whereas partially filled or weakly stained cells (9 non-Tbr2 and 7 Tbr2 lineage) were excluded from the analysis. For assessment of somata and dendritic arbors, filled cells were imaged in their entirety at a resolution of 0.2 × 0.2 × 1 μm per voxel with a 210 μm working-distance Plan-Apochromat 20×/0.8 NA objective lens and 3× digital zoom. For each neuron, multiple tiles of image stacks were acquired using multitime macro and then stitched using Zen software (Carl Zeiss). For 3D reconstruction, the stitched volumetric dataset was imported into the 64 bit version of NeuronStudio [30]. The entire dendritic structure of each cell was then manually traced in NeuronStudio using a Rayburst-based analysis routine, and the resulting reconstruction was exported as a .swc file. Sholl analyses were performed on cell reconstructions using NeuronStudio, exported to Excel, and graphed using SigmaPlot 12.0.
Results
Multiple neuronal precursor groups generate comingled neurons
We first sought to confirm that multiple individual precursor classes simultaneously generate neurons for the same cortical layer, which would indicate temporal and spatial overlap between neuronal lineages. To do this, we exploited the fact that progenitor groups can be distinguished at the molecular level by differential transcription factor expression; bIPCs alone express Tbr2, whereas RGCs, aIPCs, and bRGs express Paired box 6 (Pax6) but not Tbr2 (Englund et al., 2005; Sessa et al., 2008; Tyler and Haydar, 2013). Therefore, we separately identified Tbr2-expressing bIPCs and their progeny while simultaneously labeling non-Tbr2 lineage (RGCs, aIPCs, and bRG) cells and their progeny using genetic fate mapping by IUE (Fig. 1A). Specifically, we paired a Cre driver plasmid containing 2.5 kb of the Tbr2 regulatory sequence with a dual fluorescent report plasmid (Cag-Stoplight, CAG-SL) to drive the expression of ZsGreen in non-Tbr2 lineage cells and mCherry in Tbr2 lineage cells following Cre-dependent recombination (Fig. 1A). We used IUE for these studies because this technique introduces episomal plasmids into the targeted cells, which are diluted over the course of several divisions; with this method, the fate-mapped population forms a sharp temporal cohort, thus allowing the analysis of neurons produced over a short developmental timeframe (Stancik et al., 2010). Because Tbr2 is transiently expressed by bIPCs in the SVZ, our labeling paradigm enabled us to highlight neurons born via this major indirect stream of neurogenesis against a background of neurons derived contemporaneously via alternative routes (Fig. 1B). We chose to initiate our fate mapping at e14.5 since the progenitor pool at this time point exhibits a high degree of heterogeneity, with RGCs, aIPCs, and bRGs actively dividing alongside a large group of Tbr2+ bIPCs (Englund et al., 2005; Tyler and Haydar, 2013).
Figure 1.

In utero fate mapping labels two lineages of cogenerated neocortical neurons. A, The 2.5 kb of 5′ genomic sequence upstream of the Tbr2 translational start site (red box) was subcloned to generate the pTbr2-Cre plasmid, which fate maps Tbr2 lineage cells with mCherry and non-Tbr2 lineage cells with ZsGreen when cotransfected with the CAG-stoplight reporter plasmid. B, The four major classes of neocortical precursors include the stem cell RGCs and the three major IPC classes: aIPCs (SNPs), bIPCs, and bRGs. C, IUE at E14.5 marks Tbr2 lineage precursors and their offspring with mCherry and the non-Tbr2 lineage with ZsGreen. The majority of mCherry-expressing precursors are immunopositive for Tbr2 protein and are found concentrated away from the ventricular surface (bright red bar with plus symbol, D; bright red line, E). The mCherry+/Tbr2-immunonegative precursors (dark red bar with minus symbol, D; dark red line, E) are primarily found near the ventricle and likely represent cells that have begun Tbr2 gene expression but have not yet made measurable protein. The ZsGreen+/Tbr2-immunonegative precursors (bright green bar with minus symbol, D; bright green line, E) are found primarily within the 60 μm closest to the ventricle. F, Confocal image from E15.5 pial surface, 24 h after IUE. Nearly all of the pial-contacting basal fibers emanate from the non-Tbr2 apical precursor lineage, whereas virtually no basal fibers were derived from the Tbr2 lineage mCherry+ precursor population. Asterisks indicate autofluorescent red blood cells. G, H, Confocal image in P21 neocortex, following IUE at E14.5, demonstrates that all mCherry(+) and ZsGreen(+) neurons reside within layers 2 and 3. I, J, Electroporated neurons express the layer 2/3 markers Brn1 and Satb2. *p < 0.0005. **p < 0.0001.
To validate this fate mapping paradigm, we first performed short-term analysis of cells coelectroporated with Tbr2-Cre and CAG-SL plasmids. Specifically, the numbers and distribution of mCherry+ and ZsGreen+ cells in the VZ/SVZ were quantified at e15.5, 24 h after IUE at E14.5 (Fig. 1C). At this time point, 63% of the electroporated population expressed mCherry, whereas 37% expressed ZsGreen alone. Importantly, the majority of cells expressing mCherry stained positively for Tbr2 protein. These bIPCs were the largest percentage of IUE+ cells (50.3%) and were concentrated away from the ventricle (Fig. 1D,E). In addition, we noted that 12.8% of the IUE-labeled cells expressed mCherry but were negative for Tbr2 protein expression. In agreement with previous work (Vasistha et al., 2014), these cells, the majority of which were located close to the ventricular surface (Fig. 1D,E, dark red), likely represent newly generated bIPCs in which the Tbr2 promoter is active but a detectable amount of Tbr2 protein has not yet accumulated. The very few (∼1.25%) mCherry+/Tbr2− cells located at a distance from the ventricle were likely newly born neurons generated via bIPC division during the after IUE interval. In contrast, we observed 30.3% of the electroporated population expressed ZsGreen alone and accordingly was negative for Tbr2 protein expression (Fig. 1D,E; bright green). The density of these non-Tbr2 lineage progenitors (RGCs and aIPCs) was markedly increased in the VZ, with the bulk of the cells positioned within 40 μm of the ventricular surface. Importantly, only a small percentage of cells (6.6%), which were randomly distributed across the electroporated field, expressed ZsGreen alone but also stained positively for Tbr2 protein (Fig. 1D,E; dark green). Additional examination of pial contacting basal end foot processes revealed that virtually all of the RGCs expressed ZsGreen, but not mCherry, as expected (Fig. 1F). These results demonstrate a high degree of recombination efficiency driven by the Tbr2-Cre plasmid which faithfully represents the endogenous expression of the Tbr2 transcript in vivo, enabling us to identify the progeny of bIPCs versus neurons born directly from RGCs and aIPCs.
Next, we quantified the percentage and laminar distribution of fate mapped Tbr2 and non-Tbr2 lineage neurons on postnatal day 21 (p21) (Fig. 1G). Our results show that 55% of the neurons in the temporal cohort labeled by electroporation at e14.5 were of the mCherry+ Tbr2 lineage, whereas 45% were non-Tbr2 lineage neurons and expressed ZsGreen alone. This result demonstrates the cogeneration of layers 2 and 3 neurons from multiple lineages and independently confirms estimates of bIPC contribution to supragranular layer formation observed in Tbr2-Cre/Ai9 mice (Vasistha et al., 2014). Neurons of both lineages did not appear to have a distinct settling pattern but were instead intermingled and concentrated within the boundaries of layers 2 and 3. Indeed, we observed many examples of mCherry+ neurons directly adjacent to ZsGreen+ neighbors, indicating that they were generated on the same embryonic day and migrated to the neocortex within the same time frame. Indeed, 72 h post-IUE tracking studies confirmed that neurons from both lineages arrived to the cortical plate simultaneously (data not shown). To quantify the laminar distribution of both lineages, we calculated the somal position for each cell as a percentage of the depth from the pia mater to the white matter. This standardized our measurements and corrected for any artifact introduced during tissue processing. Both populations were distributed across layers 2 and 3, with Tbr2 lineage and non-Tbr2 lineage neurons exhibiting mean relative cortical depths of 27.1% and 25.4%, respectively (Fig. 1H). Finally, we performed immunohistochemistry for Satb2 and Brn1, markers of superficial layer neurons, which showed that all of the fate-mapped neurons were positive for both markers (Fig. 1I,J). Together, these results demonstrate that separately fate mapped neural precursors simultaneously generate pyramidal neuron descendants that comingle within the supragranular neocortical laminae.
bIPCs generate neurons with distinctive electrophysiological properties
As the previous experiments show, neurons born at e14.5 are destined to become pyramidal neurons within layers 2 and 3 of the mature neocortex (often referred to as “layer 2/3” due to the lack of architectonic boundaries and to similarities in the structure and function of neurons in these superficial layers). In contrast to pyramidal neurons within layers 5 and 6, those within layers 2 and 3 have long been considered largely homogeneous with respect to their basic electrophysiological properties. However, recent studies have classified layers 2 and 3 pyramidal neurons in the primate and rat frontal cortex into several different types based on their passive and active physiological properties and dendritic architecture (Zaitsev et al., 2012; van Aerde and Feldmeyer, 2015). In addition, transcriptional profiling studies have suggested that molecularly distinct subpopulations of neurons may comprise layers 2 and 3 (Molyneaux et al., 2009). Therefore, we reasoned that this developmental window presents a unique opportunity to directly test whether individual types of pyramidal neurons within layers 2 and 3 of the cortex can be identified and traced to the progenitor type from which they arise.
To determine whether these comingled neurons of distinct lineages express different functional electrophysiological profiles, we performed whole-cell patch-clamp recordings of identified Tbr2 and non-Tbr2 lineage neurons in in vitro slices of frontal cortex to directly compare their passive membrane, action potential firing, and spontaneous excitatory synaptic response properties. We recorded from 24 non-Tbr2 and 26 Tbr2 lineage neurons positioned across the depth of layers 2 and 3 (Fig. 2A,B). Neurons were filled with biocytin during recordings to enable subsequent high-resolution morphometric analyses using confocal microscopy. The sample population was distributed across the mediolateral extent of the electroporated hemisphere throughout layers 2 and 3 and was located, on average, within the superficial 23.4% (non-Tbr2) versus 22.9% (Tbr2) of the cortical wall depth from the pia to the white matter (Fig. 2B). High-resolution imaging demonstrates the close apposition of both lineages of neurons within layers 2 and 3 in the electroporated slices (Fig. 2C). Neurons positioned deeper than 35% within the cortical wall were excluded from analyses as they were outside the lower limit of layer 3 (Fig. 2A, dotted black lines).
Figure 2.
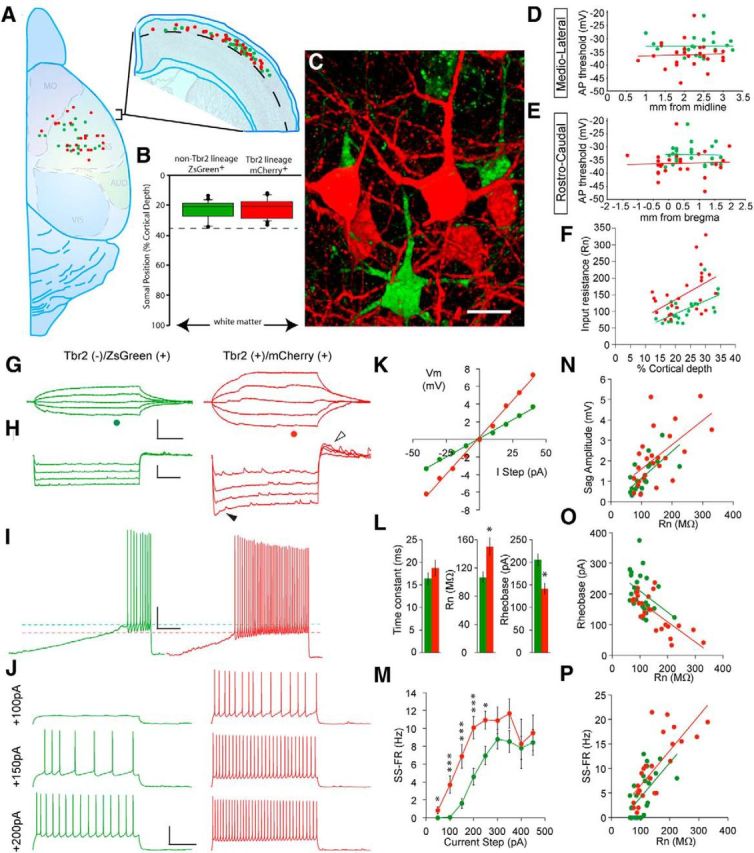
Non-Tbr2 and Tbr2 lineage neurons exhibit distinct electrophysiological properties. A, Positions of recorded cells within the rostrocaudal and mediolateral extent of the brain (left) and their depth within the cortex (right). B, Quantification of the depths of recorded cells indicates that all cells were colocalized by depth and contained within layers 2 and 3. C, Confocal 3D reconstruction of a field of Tbr2 (red) and non-Tbr2 (green) lineage neurons demonstrates that fate-mapped cells of the two lineages were closely neighboring. Scale bar, 10 μm. D, E, No significant correlations were found between action potential threshold and either mediolateral (D) or rostrocaudal position (E) of the recorded cells. F, Input resistance shows a positive correlation with cortical depth (R2 values, Tbr2 lineage = 0.256, non-Tbr2 lineage = 0.383; intercept coefficients, Tbr2 lineage = 33.5, non-Tbr2 lineage = 14.8; p < 0.02 and 0.01, respectively). G, Voltage responses of non-Tbr2 and Tbr2 lineage neurons to a series of subthreshold current steps demonstrating the significantly greater input resistance of the Tbr2 lineage neuron. H, The voltage sag (closed arrowhead) and rebound depolarization (open arrowhead) evoked by identical hyperpolarizing current steps is greater in the Tbr2 lineage neuron. I, Voltage responses to slow depolarizing current ramps demonstrate that the Tbr2 lineage neuron has a lower rheobase (dashed red line) than the non-Tbr2 lineage neuron (dashed green line). J, The Tbr2 lineage neuron exhibits higher rates of evoked action potential firing at each depolarizing current step, as shown in the representative voltage responses. Calibrations: G, 5 mV, 50 ms; H, 20 mV, 2 s; I, 5 mV, 500 ms; J, 40 mV, 500 ms. K, Voltage-current plot of non-Tbr2 (green) and Tbr2 (red) lineage neurons voltage responses to subthreshold current steps (at time points indicated by green and red dots below the current traces in G). L, Bar graphs demonstrating significant differences in input resistance and rheobase, but not membrane time constant, in neurons from the two lineages. *p < 0.05. M, Mean f-I plot depicting higher rates of evoked action potential firing in Tb2 lineage neurons. The first five data points are significantly different: 50 pA, *p < 0.05; steps 100–200 pA, ***p < 0.001; step 250 pA, **p < 0.008. N–P, Scatter plots demonstrating significant linear relationships (p < 0.05 for all) between Rn and depolarizing sag potential (R2 values, Tbr2 lineage = 0.343, non-Tbr2 lineage = 0.447), Rn and rheobase (R2 values, Tbr2 lineage = 0.559, non-Tbr2 lineage = 0.158), and Rn and steady-state firing rate evoked by a 200 pA step (R2 values, Tbr2 lineage = 0.570, non-Tbr2 lineage = 0.338).
To ascertain whether these electrophysiological parameters may be affected by the position of each cell within layers 2 and 3, we performed correlation analyses. First, we examined the relationship between the data for each cell and its position along the mediolateral and rostrocaudal axes. We found no correlation between cell position and any physiological parameter (e.g., action potential threshold, Fig. 2D,E; Rn, rheobase, or sag amplitude; data not shown). Therefore, neurons were grouped by lineage for further comparison.
Analysis of these populations revealed important electrophysiological distinctions (Table 1). On average, Tbr2 lineage neurons exhibited a different current/voltage relationship (Fig. 2G,K), higher Rn (Fig. 2G,L), lower rheobase (Fig. 2L), more depolarized resting membrane potential (Vr), and higher amplitude depolarizing sag potential (Fig. 2H) than their non-Tbr2 counterparts, whereas their membrane time constant (tau) (Fig. 2G,L) and single action potential amplitude did not differ. These differences in membrane properties were associated with functionally important distinctions in the action potential firing properties of neurons from the two lineages. All of the neurons within this sample exhibited a slowly adapting, regular spiking, repetitive firing pattern that did not differ with regard to firing rate adaptation (Fig. 2J; Table 1). However, Tbr2 lineage neurons responded to depolarizing current steps with significantly higher action potential firing rates than non-Tbr2 lineage neurons (Figs. 2J,M). Because cells with high Rn respond to a given current step with a larger voltage deflection than do those with a low Rn, there was, as expected, a significant positive relationship between Rn and sag (Fig. 2N), rheobase (Fig. 2O), and action potential firing rate (Fig. 2P). This indicates that the higher Rn underlies the significantly higher excitability of Tbr2 lineage neurons. Interestingly, we observed a positive correlation for both Tbr2 and non-Tbr2 lineage neurons between cortical depth and Rn, with deeper neurons exhibiting higher input resistance values (Fig. 2F; R2 values, Tbr2 lineage = 0.256, non-Tbr2 lineage = 0.383; intercept coefficients, Tbr2 lineage = 33.5, non-Tbr2 lineage = 14.8). Despite this general relationship with cortical depth, Tbr2 lineage neurons exhibited significantly higher Rn values than non-Tbr2 lineage neurons across the entire thickness of layers 2 and 3 (Fig. 2F).
Table 1.
Electrophysiological characteristics of fate-mapped neocortical neurons
| Mean non-Tbr2 | SD | SEM | Mean Tbr2 | SD | SEM | p value | |
|---|---|---|---|---|---|---|---|
| Vr (mV) | −69.5 | 5.3 | 1.1 | −66.2 | 5.8 | 1.2 | 0.049* |
| Rn (MOhm) | 106.6 | 36.7 | 7.6 | 150.2 | 65.1 | 13.0 | 0.006* |
| Tau (ms) | 16.4 | 6.2 | 1.3 | 18.7 | 8.6 | 1.7 | 0.292 |
| Rheobase (pA) | 205.0 | 63.9 | 13.3 | 141.2 | 58.2 | 11.9 | 0.0008* |
| Threshold (mV) | −32.9 | 3.7 | 0.8 | −36.1 | 4.7 | 0.9 | 0.012* |
| Amp (pA) | 81.3 | 8.0 | 1.7 | 82.4 | 9.1 | 1.8 | 0.667 |
| Duration at 1/2 (ms) | 2.2 | 0.7 | 0.1 | 2.1 | 0.5 | 0.1 | 0.676 |
| Sag (mV) | 1.2 | 0.8 | 0.2 | 2.5 | 2.2 | 0.4 | 0.007* |
| RD (mV) | 1.2 | 0.8 | 0.2 | 2.2 | 1.7 | 0.3 | 0.009* |
| Hump (mV) | 2.1 | 1.3 | 0.3 | 2.2 | 2.2 | 0.4 | 0.803 |
| AHP (mV) | −12.7 | 2.5 | 0.5 | −11.5 | 4.4 | 0.9 | 0.231 |
| fAHP (mV) | −4.8 | 2.5 | 0.5 | −5.3 | 2.6 | 0.5 | 0.517 |
| DAP (mV) | 0.4 | 1.0 | 0.2 | 0.5 | 0.9 | 0.2 | 0.602 |
| mAHP (mV) | −7.8 | 1.9 | 0.4 | −6.7 | 2.1 | 0.4 | 0.054* |
| tAHP (ms) | 42.5 | 10.6 | 2.2 | 41.4 | 11.2 | 2.2 | 0.707 |
| Frequency @ steady state near rheobase | 6.94 | 4.9 | 1.0 | 6.88 | 6.6 | 1.3 | 0.975 |
| Frequency @ steady state 200pA step | 4.6 | 4.4 | 0.9 | 10.1 | 6.3 | 1.3 | 0.0012* |
| Increase in FF per 50 pA current step | 0.05 | 0.02 | 0.01 | 0.08 | 0.03 | 0.01 | 0.002* |
| TFS (time to 1st spike, ms) | 46.8 | 31.9 | 7.5 | 43 | 29 | 6.2 | 0.689 |
| ISI 1 (ms) | 82.4 | 54.6 | 12.8 | 78.4 | 51.2 | 10.9 | 0.810 |
| ISI 2 (ms) | 108.4 | 60.6 | 14.3 | 99.7 | 52.9 | 11.3 | 0.627 |
| ISI 3 (ms) | 115 | 71.9 | 16.9 | 103.3 | 51.9 | 11.1 | 0.544 |
| FFA initial (%) | 27.8 | 20.6 | 4.9 | 26.2 | 21.7 | 4.6 | 0.812 |
| FFA late (%) | 40.7 | 18.1 | 4.5 | 38.8 | 20.1 | 4.3 | 0.763 |
| SEPSC | |||||||
| Freq (Hz) | 6.7 | 2.4 | 0.5 | 6.4 | 2.5 | 0.6 | 0.696 |
| Amp (pA) | 16.6 | 4.0 | 0.9 | 20.5 | 7.2 | 1.7 | 0.044* |
| Rise (ms) | 1.8 | 0.4 | 0.1 | 1.6 | 0.3 | 0.1 | 0.185 |
| Half-width (ms) | 8.5 | 0.8 | 0.2 | 9.3 | 1.2 | 0.3 | 0.015* |
| Decay (ms) | 5.9 | 0.6 | 0.1 | 7.1 | 1.2 | 0.3 | 0.001* |
| Area (pAms) | −174.2 | 48.8 | 10.9 | −255.9 | 114.4 | 26.2 | 0.008* |
*Denotes statistical significance.
In addition to these fundamentally different basic membrane and action potential firing properties, neurons from each lineage also differed with regard to spontaneous AMPAR-mediated EPSC (sEPSC) properties. sEPSCs occurred at similar frequencies but had higher mean amplitude, decay time, and area in Tbr2- compared with non-Tbr2 lineage neurons (Fig. 3A–C). There were no relationships between Rn and sEPSC amplitude (Fig. 3D) or area (Fig. 3E), indicating that, although Rn plays a key role in the differences in action potential excitability, it is not associated with sEPSC characteristics in neurons from the two lineages. Thus, pyramidal neurons in layers 2 and 3 of the mouse neocortex exhibit distinctive electrophysiological response characteristics depending on their parental neural precursor identity.
Figure 3.

EPSC properties differ between pyramidal cell lineages. A, AMPA-R mediated sEPSCs recorded from representative non-Tbr2 (green) and Tbr2 (red) lineage neurons demonstrating similar frequencies of events in the two groups. B, Averaged waveforms of several hundred sEPSCs from typical non-Tbr2 and Tbr2 lineage neurons. The waveform obtained from the non-Tbr2 lineage neuron was overlaid on that from the Tbr2 lineage neurons (overlay) and then normalized to demonstrate that the difference in decay time and area is linked to the difference in amplitude. C, Bar graphs demonstrating significant differences in the amplitude, decay time, and area, but not frequency, of sEPSCs in neurons from the two lineages. *p < 0.05. D, E, Scatter plots demonstrating no significant relationship between Rn and sEPSC amplitude (R2 values, Tbr2 lineage = 0.000028, non-Tbr2 lineage = 0.166) or area (R2 values, Tbr2 lineage = 0.001, non-Tbr2 lineage = 0.000044). Calibration: A, 20 pA/50 ms; B, 4 pA/5 ms.
Neuronal morphology is specified by precursor lineage
To determine whether structural changes might be associated with the electrophysiological differences, we next compared cellular morphology between the two lineages of fate mapped neurons. For morphometric analyses, 15 Tbr2 and 19 non-Tbr2 lineage neurons filled with biocytin during electrophysiological characterization were scanned by confocal microscopy and fully reconstructed in NeuronStudio (Fig. 4A–C). These three-dimensionally reconstructed cells were within the neocortical depth range described for the patch-clamp study and were therefore positioned within layers 2 and 3. Although no differences in the volume (data not shown) or surface area of the somata were found (mean ± SEM, non-Tbr2 lineage = 1589 ± 123 μm2; Tbr2 lineage = 1410 ± 132 μm2, p = 0.33), substantial differences in apical dendrite morphology were noted; subsequent Sholl analysis confirmed greater branching and morphological complexity in the apical dendrites of the non-Tbr2 lineage (Fig. 4D,F) as well as significantly greater apical dendritic length (Fig. 4G). Differences in dendritic complexity were specific to the apical arbor; no significant differences in branch number or dendritic length were found in the basal arbor between the two lineages (Fig. 4E–G). Furthermore, volumetric computations of convex hull and arbor density (Fig. 4H–J) identified decreased apical complexity of Tbr2 lineage neurons but no other volumetric changes. These data demonstrate significant and specific morphological differences between the apical dendrites of Tbr2 and non-Tbr2 lineage neurons. Together, these data show that, as with fundamentally different electrophysiological properties, the detailed morphological properties of adult supragranular neocortical neurons appear to be dictated in part by their lineage.
Figure 4.

Precursor lineages generate pyramidal neurons with different morphology. A, Representative confocal images showing that Tbr2 (mCherry) and non-Tbr2 (ZsGreen) neurons can be distinguished following biocytin staining (blue). Biocytin-filled fate mapped neurons were scanned at high resolution using confocal microscopy, and their entire dendritic arbor was reconstructed. B, C, Representative neuron reconstructions from each lineage arranged based on depth within layers 2 and 3 demonstrating greater dendritic complexity in the non-Tbr2 lineage. D, Sholl analysis demonstrates increased apical dendrite complexity in non-Tbr2 lineage neurons compared with the Tbr2 lineage, whereas no significant differences were found in the basal dendrites (E). *p < 0.05. F, G, The number of apical branches and total dendrite length were increased in non-Tbr2 lineage neurons. **p < 0.01. H–J, Convex hull analyses demonstrate no difference in the volumes of the apical or basal compartments (I) or in dendrite length per unit volume (J).
To determine whether there was a relationship between the structural and functional properties of the neurons, we performed correlation analyses on electrophysiological and morphological variables that differed between the two groups (Fig. 5). Interestingly, there was a significant negative relationship between apical branch number and Rn (Fig. 5A), in particular within the third of the apical dendrite proximal to the soma (Fig. 5D), indicating that the less complex dendritic arbor of neurons in the Tbr2 lineage is related to their functionally important higher Rn.
Figure 5.

Input resistance is related to the complexity of the apical arbor. Correlations between apical branch number and Rn shown for the total (A), distal (B), middle (C), and proximal (D) portions of recorded and reconstructed cells. There was a strong negative correlation between total apical branch number and Rn (A), and this was due primarily to the strong effect of branch numbers in the first third of the apical dendrite closest to the soma (D). These data indicate that increased branch density of this proximal region in non-Tbr2 lineage neurons (also seen in Fig. 4D) is likely related to Rn differences between the two examined lineages. Correlations: Entire apical dendrite (A); R2 = 0.194, intercept = 168, p = 0.0092; distal third (B); R2 = 0.007, intercept = 106, p = 0.632; middle third (C); R2 = 0.158, intercept = 143, p = 0.02; proximal third (D); R2 = 0.22, intercept = 165, p = 0.0052.
Discussion
Although it has long been recognized that RGCs are progressively tuned to generate neurons of the six layers of the neocortex in an inside-out fashion (Rakic, 1975), here we demonstrate for the first time that multiple lineages of neural precursors in the fetal dorsal telencephalon simultaneously produce pyramidal neurons with significantly different structural and functional properties, even when they are destined to reside within the same neocortical layer. Indeed, we have shown that the morphological complexity as well as the basic membrane and action potential firing properties of layers 2 and 3 neurons, integral to their function within neocortical circuits, are in part specified at birth by their progenitor class of origin.
In particular, we have demonstrated a lower apical dendritic branching complexity and higher input resistance in Tbr2 versus non-Tbr2 lineage neurons. Previous empirical and modeling studies have shown that dendritic morphology plays a critical role in determining passive membrane properties, including input resistance, and related neuronal firing rates (Mainen and Sejnowski, 1996; Euler and Denk, 2001; Vetter et al., 2001; Bekkers and Häusser, 2007; Weaver and Wearne, 2008; Amatrudo et al., 2012; Ferrante et al., 2013). Indeed, correlation analysis in our study suggests that there is a significant negative relationship between proximal (and total) apical dendritic branching complexity and input resistance in both Tbr2 and non-Tbr2 lineage neurons. Both macroscopic branching topology and microscopic surface irregularities, including dendritic varicosities (Surkis et al., 1998; Bekkers and Häusser, 2007) and spine density, shape, and distribution (Wilson, 1988; Holmes, 1989; Baer and Rinzel, 1991; Medalla and Luebke, 2015) contribute to the excitable properties of neurons. Further, the interaction of morphology with intrinsic ionic and synaptic conductances can alter dendritic cable properties (Bernander et al., 1991; Segev and London, 2000; Spruston, 2008). Whether these variables are also different in Tbr2 and nonTbr2 lineage neurons will be assessed in future studies.
The lineage-specific differences in action potential firing and postsynaptic current properties we have measured ostensibly influence circuit composition and activity in the maturing neocortical layers. Accordingly, variations in the numbers and proportions of progenitor types between individuals, across different regions of the developing cortex, or due to molecular or environmental challenges likely have dramatic, as yet unappreciated, effects on the composition and function of neocortical circuits in the mature brain. Empirical evidence from mouse models of fragile X syndrome, which exhibit a significant expansion in bIPCs (Tervonen et al., 2009), and Down syndrome, which show a specific deficit in aIPC production (Tyler and Haydar, 2013), support this hypothesis.
These data show that instructive cues for neuronal identity and function are propagated from the germinal zone and therefore strongly support the protomap theory of neocortical development (Rakic, 1988). The fate potential of neocortical neural precursors is programmed by patterns of gene expression over the course of development, controlling dorsal versus ventral fate and the production of the individual cortical lamina (Zhong et al., 1997; Gaiano et al., 2000; Schuurmans et al., 2004; Chen et al., 2005a, b; Molyneaux et al., 2005; Breunig et al., 2007; Chen et al., 2008; Han et al., 2011; Kwan et al., 2012a). These dynamic changes in gene expression are thought to influence the local specification of cells and enable the sharply defined architectonic boundaries between cortical areas (Rakic, 1988; Lukaszewicz et al., 2005). In addition, previous transcription factor expression studies have suggested that cortical projection neuron subtypes populate human neocortical layers in minicolumns, with unrelated cells intermixed between these columns, highlighting cell heterogeneity within neocortical laminae (Kwan et al., 2012b). The results from our study extend these findings in two important ways. First, we show that there are classes of neurons in the mouse supragranular neocortical laminae (i.e., layers 2 and 3) that exhibit highly distinctive functional and morphological properties. Second, we show for the first time that these characteristics are specified by individual classes of precursors. It is now known that RGCs and IPCs express unique gene expression signatures (Kawaguchi et al., 2008; Pollen et al., 2014). Our study illustrates that one of the purposes of this variegated gene expression is to generate functional diversity in the excitatory neuron population during development rather than merely expand the output of the germinal zone.
Our findings also show that a large proportion of layers 2 and 3 pyramidal neurons are not generated from Tbr2+ bIPCs. Instead, many superficial neurons are born directly from asymmetric divisions of RGCs and/or additional non-Tbr2 progenitors (aIPCs, bRGs), and this varied source of neuronal production directly leads to diversity. Use of our fate mapping methodology before e14.5 will inform on the precise contribution of different progenitor classes to deeper cortical layers and establish whether the principles we have uncovered extend to layers 4, 5, and/or 6. In addition, although we have established substantive functional differences between some Tbr2 lineage neurons and those produced from the other contemporaneous precursor groups, we cannot exclude the possibility that heterogeneity exists within the pool of bIPCs itself. Furthermore, the full spectrum of neuronal subtypes may be revealed by refining our ability to trace and characterize the progeny of all of the independent classes of neuronal progenitors (bRGs/aIPCs, etc.). This next step will be particularly important for understanding human brain development, where a dramatic expansion in the size and variety of the neural precursor populations likely underlies the increase in human neuronal diversity, circuit complexity and ultimately, cognitive ability.
Footnotes
This work was supported by National Institutes of Health Grant NS051582 to T.F.H. and W.A.T., Grant NS089340 to T.F.H., W.A.T., and J.I.L., and Grant MH101234 to M.M., T.G.-V. was supported by the Rafael del Pino Foundation. We thank members of the T.F.H. and J.I.L. laboratories for constructive discussions and critical reading of the manuscript; and Josh Gilman for help with the morphometrics.
The authors declare no competing financial interests.
References
- Amatrudo JM, Weaver CM, Crimins JL, Hof PR, Rosene DL, Luebke JI. Influence of highly distinctive structural properties on the excitability of pyramidal neurons in monkey visual and prefrontal cortices. J Neurosci. 2012;32:13644–13660. doi: 10.1523/JNEUROSCI.2581-12.2012. [DOI] [PMC free article] [PubMed] [Google Scholar]
- Baer SM, Rinzel J. Propagation of dendritic spikes mediated by excitable spines: a continuum theory. J Neurophysiol. 1991;65:874–890. doi: 10.1152/jn.1991.65.4.874. [DOI] [PubMed] [Google Scholar]
- Bekkers JM, Häusser M. Targeted dendrotomy reveals active and passive contributions of the dendritic tree to synaptic integration and neuronal output. Proc Natl Acad Sci U S A. 2007;104:11447–11452. doi: 10.1073/pnas.0701586104. [DOI] [PMC free article] [PubMed] [Google Scholar]
- Bernander O, Douglas RJ, Martin KA, Koch C. Synaptic background activity influences spatiotemporal integration in single pyramidal cells. Proc Natl Acad Sci U S A. 1991;88:11569–11573. doi: 10.1073/pnas.88.24.11569. [DOI] [PMC free article] [PubMed] [Google Scholar]
- Breunig JJ, Silbereis J, Vaccarino FM, Sestan N, Rakic P. Notch regulates cell fate and dendrite morphology of newborn neurons in the postnatal dentate gyrus. Proc Natl Acad Sci U S A. 2007;104:20558–20563. doi: 10.1073/pnas.0710156104. [DOI] [PMC free article] [PubMed] [Google Scholar]
- Caviness VS, Jr, Takahashi T, Nowakowski RS. Numbers, time and neocortical neuronogenesis: a general developmental and evolutionary model. Trends Neurosci. 1995;18:379–383. doi: 10.1016/0166-2236(95)93933-O. [DOI] [PubMed] [Google Scholar]
- Chen B, Schaevitz LR, McConnell SK. Fezl regulates the differentiation and axon targeting of layer 5 subcortical projection neurons in cerebral cortex. Proc Natl Acad Sci U S A. 2005a;102:17184–17189. doi: 10.1073/pnas.0508732102. [DOI] [PMC free article] [PubMed] [Google Scholar]
- Chen B, Wang SS, Hattox AM, Rayburn H, Nelson SB, McConnell SK. The Fezf2-Ctip2 genetic pathway regulates the fate choice of subcortical projection neurons in the developing cerebral cortex. Proc Natl Acad Sci U S A. 2008;105:11382–11387. doi: 10.1073/pnas.0804918105. [DOI] [PMC free article] [PubMed] [Google Scholar]
- Chen JG, Rasin MR, Kwan KY, Sestan N. Zfp312 is required for subcortical axonal projections and dendritic morphology of deep-layer pyramidal neurons of the cerebral cortex. Proc Natl Acad Sci U S A. 2005b;102:17792–17797. doi: 10.1073/pnas.0509032102. [DOI] [PMC free article] [PubMed] [Google Scholar]
- Crimins JL, Rocher AB, Luebke JI. Electrophysiological changes precede morphological changes to frontal cortical pyramidal neurons in the rTg4510 mouse model of progressive tauopathy. Acta Neuropathol. 2012;124:777–795. doi: 10.1007/s00401-012-1038-9. [DOI] [PMC free article] [PubMed] [Google Scholar]
- DeFelipe J, Fariñas I. The pyramidal neuron of the cerebral cortex: morphological and chemical characteristics of the synaptic inputs. Prog Neurobiol. 1992;39:563–607. doi: 10.1016/0301-0082(92)90015-7. [DOI] [PubMed] [Google Scholar]
- Elsen GE, Hodge RD, Bedogni F, Daza RA, Nelson BR, Shiba N, Reiner SL, Hevner RF. The protomap is propagated to cortical plate neurons through an Eomes-dependent intermediate map. Proc Natl Acad Sci U S A. 2013;110:4081–4086. doi: 10.1073/pnas.1209076110. [DOI] [PMC free article] [PubMed] [Google Scholar]
- Englund C, Fink A, Lau C, Pham D, Daza RA, Bulfone A, Kowalczyk T, Hevner RF. Pax6, Tbr2, and Tbr1 are expressed sequentially by radial glia, intermediate progenitor cells, and postmitotic neurons in developing neocortex. J Neurosci. 2005;25:247–251. doi: 10.1523/JNEUROSCI.2899-04.2005. [DOI] [PMC free article] [PubMed] [Google Scholar]
- Euler T, Denk W. Dendritic processing. Curr Opin Neurobiol. 2001;11:415–422. doi: 10.1016/S0959-4388(00)00228-2. [DOI] [PubMed] [Google Scholar]
- Ferrante M, Migliore M, Ascoli GA. Functional impact of dendritic branch-point morphology. J Neurosci. 2013;33:2156–2165. doi: 10.1523/JNEUROSCI.3495-12.2013. [DOI] [PMC free article] [PubMed] [Google Scholar]
- Fietz SA, Kelava I, Vogt J, Wilsch-Bräuninger M, Stenzel D, Fish JL, Corbeil D, Riehn A, Distler W, Nitsch R, Huttner WB. OSVZ progenitors of human and ferret neocortex are epithelial-like and expand by integrin signaling. Nat Neurosci. 2010;13:690–699. doi: 10.1038/nn.2553. [DOI] [PubMed] [Google Scholar]
- Florio M, Huttner WB. Neural progenitors, neurogenesis and the evolution of the neocortex. Development. 2014;141:2182–2194. doi: 10.1242/dev.090571. [DOI] [PubMed] [Google Scholar]
- Frantz GD, McConnell SK. Restriction of late cerebral cortical progenitors to an upper-layer fate. Neuron. 1996;17:55–61. doi: 10.1016/S0896-6273(00)80280-9. [DOI] [PubMed] [Google Scholar]
- Gaiano N, Nye JS, Fishell G. Radial glial identity is promoted by Notch1 signaling in the murine forebrain. Neuron. 2000;26:395–404. doi: 10.1016/S0896-6273(00)81172-1. [DOI] [PubMed] [Google Scholar]
- Gal JS, Morozov YM, Ayoub AE, Chatterjee M, Rakic P, Haydar TF. Molecular and morphological heterogeneity of neural precursors in the mouse neocortical proliferative zones. J Neurosci. 2006;26:1045–1056. doi: 10.1523/JNEUROSCI.4499-05.2006. [DOI] [PMC free article] [PubMed] [Google Scholar]
- Han W, Kwan KY, Shim S, Lam MM, Shin Y, Xu X, Zhu Y, Li M, Sestan N. TBR1 directly represses Fezf2 to control the laminar origin and development of the corticospinal tract. Proc Natl Acad Sci U S A. 2011;108:3041–3046. doi: 10.1073/pnas.1016723108. [DOI] [PMC free article] [PubMed] [Google Scholar]
- Hansen DV, Lui JH, Parker PR, Kriegstein AR. Neurogenic radial glia in the outer subventricular zone of human neocortex. Nature. 2010;464:554–561. doi: 10.1038/nature08845. [DOI] [PubMed] [Google Scholar]
- Holmes WR. The role of dendritic diameters in maximizing the effectiveness of synaptic inputs. Brain Res. 1989;478:127–137. doi: 10.1016/0006-8993(89)91484-4. [DOI] [PubMed] [Google Scholar]
- Kawaguchi A, Ikawa T, Kasukawa T, Ueda HR, Kurimoto K, Saitou M, Matsuzaki F. Single-cell gene profiling defines differential progenitor subclasses in mammalian neurogenesis. Development. 2008;135:3113–3124. doi: 10.1242/dev.022616. [DOI] [PubMed] [Google Scholar]
- Kowalczyk T, Pontious A, Englund C, Daza RA, Bedogni F, Hodge R, Attardo A, Bell C, Huttner WB, Hevner RF. Intermediate neuronal progenitors (basal progenitors) produce pyramidal-projection neurons for all layers of cerebral cortex. Cereb Cortex. 2009;19:2439–2450. doi: 10.1093/cercor/bhn260. [DOI] [PMC free article] [PubMed] [Google Scholar]
- Kwan KY, Sestan N, Anton ES. Transcriptional co-regulation of neuronal migration and laminar identity in the neocortex. Development. 2012a;139:1535–1546. doi: 10.1242/dev.069963. [DOI] [PMC free article] [PubMed] [Google Scholar]
- Kwan KY, Lam MM, Johnson MB, Dube U, Shim S, Rašin MR, Sousa AM, Fertuzinhos S, Chen JG, Arellano JI, Chan DW, Pletikos M, Vasung L, Rowitch DH, Huang EJ, Schwartz ML, Willemsen R, Oostra BA, Rakic P, Heffer M, et al. Species-dependent posttranscriptional regulation of NOS1 by FMRP in the developing cerebral cortex. Cell. 2012b;149:899–911. doi: 10.1016/j.cell.2012.02.060. [DOI] [PMC free article] [PubMed] [Google Scholar]
- LaMonica BE, Lui JH, Hansen DV, Kriegstein AR. Mitotic spindle orientation predicts outer radial glial cell generation in human neocortex. Nat Commun. 2013;4:1665. doi: 10.1038/ncomms2647. [DOI] [PMC free article] [PubMed] [Google Scholar]
- Lewitus E, Kelava I, Kalinka AT, Tomancak P, Huttner WB. An adaptive threshold in mammalian neocortical evolution. PLoS Biol. 2014;12:e1002000. doi: 10.1371/journal.pbio.1002000. [DOI] [PMC free article] [PubMed] [Google Scholar]
- Lukaszewicz A, Savatier P, Cortay V, Giroud P, Huissoud C, Berland M, Kennedy H, Dehay C. G1 phase regulation, area-specific cell cycle control, and cytoarchitectonics in the primate cortex. Neuron. 2005;47:353–364. doi: 10.1016/j.neuron.2005.06.032. [DOI] [PMC free article] [PubMed] [Google Scholar]
- Mainen ZF, Sejnowski TJ. Influence of dendritic structure on firing pattern in model neocortical neurons. Nature. 1996;382:363–366. doi: 10.1038/382363a0. [DOI] [PubMed] [Google Scholar]
- Medalla M, Luebke JI. Diversity of glutamatergic synaptic strength in lateral prefrontal versus primary visual cortices in the rhesus monkey. J Neurosci. 2015;35:112–127. doi: 10.1523/JNEUROSCI.3426-14.2015. [DOI] [PMC free article] [PubMed] [Google Scholar]
- Mizutani K, Yoon K, Dang L, Tokunaga A, Gaiano N. Differential Notch signalling distinguishes neural stem cells from intermediate progenitors. Nature. 2007;449:351–355. doi: 10.1038/nature06090. [DOI] [PubMed] [Google Scholar]
- Molyneaux BJ, Arlotta P, Hirata T, Hibi M, Macklis JD. Fezl is required for the birth and specification of corticospinal motor neurons. Neuron. 2005;47:817–831. doi: 10.1016/j.neuron.2005.08.030. [DOI] [PubMed] [Google Scholar]
- Molyneaux BJ, Arlotta P, Fame RM, MacDonald JL, MacQuarrie KL, Macklis JD. Novel subtype-specific genes identify distinct subpopulations of callosal projection neurons. J Neurosci. 2009;29:12343–12354. doi: 10.1523/JNEUROSCI.6108-08.2009. [DOI] [PMC free article] [PubMed] [Google Scholar]
- Nelson BR, Hodge RD, Bedogni F, Hevner RF. Dynamic interactions between intermediate neurogenic progenitors and radial glia in embryonic mouse neocortex: potential role in Dll1-notch signaling. J Neurosci. 2013;33:9122–9139. doi: 10.1523/JNEUROSCI.0791-13.2013. [DOI] [PMC free article] [PubMed] [Google Scholar]
- Noctor SC, Flint AC, Weissman TA, Dammerman RS, Kriegstein AR. Neurons derived from radial glial cells establish radial units in neocortex. Nature. 2001;409:714–720. doi: 10.1038/35055553. [DOI] [PubMed] [Google Scholar]
- Noctor SC, Flint AC, Weissman TA, Wong WS, Clinton BK, Kriegstein AR. Dividing precursor cells of the embryonic cortical ventricular zone have morphological and molecular characteristics of radial glia. J Neurosci. 2002;22:3161–3173. doi: 10.1523/JNEUROSCI.22-08-03161.2002. [DOI] [PMC free article] [PubMed] [Google Scholar]
- Peters A, Sethares C. Organization of pyramidal neurons in area 17 of monkey visual cortex. J Comp Neurol. 1991;306:1–23. doi: 10.1002/cne.903060102. [DOI] [PubMed] [Google Scholar]
- Pollen AA, Nowakowski TJ, Shuga J, Wang X, Leyrat AA, Lui JH, Li N, Szpankowski L, Fowler B, Chen P, Ramalingam N, Sun G, Thu M, Norris M, Lebofsky R, Toppani D, Kemp DW, 2nd, Wong M, Clerkson B, Jones BN, et al. Low-coverage single-cell mRNA sequencing reveals cellular heterogeneity and activated signaling pathways in developing cerebral cortex. Nat Biotechnol. 2014;32:1053–1058. doi: 10.1038/nbt.2967. [DOI] [PMC free article] [PubMed] [Google Scholar]
- Rakic P. Mode of cell migration to the superficial layers of fetal monkey neocortex. J Comp Neurol. 1972;145:61–83. doi: 10.1002/cne.901450105. [DOI] [PubMed] [Google Scholar]
- Rakic P. Neurons in rhesus monkey visual cortex: systematic relation between time of origin and eventual disposition. Science. 1974;183:425–427. doi: 10.1126/science.183.4123.425. [DOI] [PubMed] [Google Scholar]
- Rakic P. Timing of major ontogenetic events in the visual cortex of the rhesus monkey. UCLA Forum Med Sci. 1975;18:3–40. doi: 10.1016/b978-0-12-139050-1.50008-2. [DOI] [PubMed] [Google Scholar]
- Rakic P. Specification of cerebral cortical areas. Science. 1988;241:170–176. doi: 10.1126/science.3291116. [DOI] [PubMed] [Google Scholar]
- Rakic P. A small step for the cell, a giant leap for mankind: a hypothesis of neocortical expansion during evolution. Trends Neurosci. 1995;18:383–388. doi: 10.1016/0166-2236(95)93934-P. [DOI] [PubMed] [Google Scholar]
- Reillo I, Borrell V. Germinal zones in the developing cerebral cortex of ferret: ontogeny, cell cycle kinetics, and diversity of progenitors. Cereb Cortex. 2012;22:2039–2054. doi: 10.1093/cercor/bhr284. [DOI] [PubMed] [Google Scholar]
- Reillo I, de Juan Romero C, García-Cabezas MÁ, Borrell V. A role for intermediate radial glia in the tangential expansion of the mammalian cerebral cortex. Cereb Cortex. 2011;21:1674–1694. doi: 10.1093/cercor/bhq238. [DOI] [PubMed] [Google Scholar]
- Rocher AB, Crimins JL, Amatrudo JM, Kinson MS, Todd-Brown MA, Lewis J, Luebke JI. Structural and functional changes in tau mutant mice neurons are not linked to the presence of NFTs. Exp Neurol. 2010;223:385–393. doi: 10.1016/j.expneurol.2009.07.029. [DOI] [PMC free article] [PubMed] [Google Scholar]
- Schuurmans C, Armant O, Nieto M, Stenman JM, Britz O, Klenin N, Brown C, Langevin LM, Seibt J, Tang H, Cunningham JM, Dyck R, Walsh C, Campbell K, Polleux F, Guillemot F. Sequential phases of cortical specification involve Neurogenin-dependent and -independent pathways. EMBO J. 2004;23:2892–2902. doi: 10.1038/sj.emboj.7600278. [DOI] [PMC free article] [PubMed] [Google Scholar]
- Segev I, London M. Untangling dendrites with quantitative models. Science. 2000;290:744–750. doi: 10.1126/science.290.5492.744. [DOI] [PubMed] [Google Scholar]
- Sessa A, Mao CA, Hadjantonakis AK, Klein WH, Broccoli V. Tbr2 directs conversion of radial glia into basal precursors and guides neuronal amplification by indirect neurogenesis in the developing neocortex. Neuron. 2008;60:56–69. doi: 10.1016/j.neuron.2008.09.028. [DOI] [PMC free article] [PubMed] [Google Scholar]
- Shitamukai A, Konno D, Matsuzaki F. Oblique radial glial divisions in the developing mouse neocortex induce self-renewing progenitors outside the germinal zone that resemble primate outer subventricular zone progenitors. J Neurosci. 2011;31:3683–3695. doi: 10.1523/JNEUROSCI.4773-10.2011. [DOI] [PMC free article] [PubMed] [Google Scholar]
- Spruston N. Pyramidal neurons: dendritic structure and synaptic integration. Nat Rev Neurosci. 2008;9:206–221. doi: 10.1038/nrn2286. [DOI] [PubMed] [Google Scholar]
- Stancik EK, Navarro-Quiroga I, Sellke R, Haydar TF. Heterogeneity in ventricular zone neural precursors contributes to neuronal fate diversity in the postnatal neocortex. J Neurosci. 2010;30:7028–7036. doi: 10.1523/JNEUROSCI.6131-09.2010. [DOI] [PMC free article] [PubMed] [Google Scholar]
- Surkis A, Peskin CS, Tranchina D, Leonard CS. Recovery of cable properties through active and passive modeling of subthreshold membrane responses from laterodorsal tegmental neurons. J Neurophysiol. 1998;80:2593–2607. doi: 10.1152/jn.1998.80.5.2593. [DOI] [PubMed] [Google Scholar]
- Tervonen TA, Louhivuori V, Sun X, Hokkanen ME, Kratochwil CF, Zebryk P, Castrén E, Castrén ML. Aberrant differentiation of glutamatergic cells in neocortex of mouse model for fragile X syndrome. Neurobiol Dis. 2009;33:250–259. doi: 10.1016/j.nbd.2008.10.010. [DOI] [PubMed] [Google Scholar]
- Tyler WA, Haydar TF. Multiplex genetic fate mapping reveals a novel route of neocortical neurogenesis, which is altered in the Ts65Dn mouse model of Down syndrome. J Neurosci. 2013;33:5106–5119. doi: 10.1523/JNEUROSCI.5380-12.2013. [DOI] [PMC free article] [PubMed] [Google Scholar]
- van Aerde KI, Feldmeyer D. Morphological and physiological characterization of pyramidal neuron subtypes in rat medial prefrontal cortex. Cereb Cortex. 2015;25:788–805. doi: 10.1093/cercor/bht278. [DOI] [PubMed] [Google Scholar]
- Vasistha NA, Garcia-Moreno F, Arora S, Cheung AF, Arnold SJ, Robertson EJ, Molnar Z. Cortical and clonal contribution of Tbr2 expressing progenitors in the developing mouse brain. Cereb Cortex. 2014 doi: 10.1093/cercor/bhu125. doi: 10.1093/cercor/bhu125. Advance online publication. Retrieved Jun 13, 2014. [DOI] [PMC free article] [PubMed] [Google Scholar]
- Vetter P, Roth A, Häusser M. Propagation of action potentials in dendrites depends on dendritic morphology. J Neurophysiol. 2001;85:926–937. doi: 10.1152/jn.2001.85.2.926. [DOI] [PubMed] [Google Scholar]
- Wang X, Tsai JW, LaMonica B, Kriegstein AR. A new subtype of progenitor cell in the mouse embryonic neocortex. Nat Neurosci. 2011;14:555–561. doi: 10.1038/nn.2807. [DOI] [PMC free article] [PubMed] [Google Scholar]
- Weaver CM, Wearne SL. Neuronal firing sensitivity to morphologic and active membrane parameters. PLoS Comput Biol. 2008;4:e11. doi: 10.1371/journal.pcbi.0040011. [DOI] [PMC free article] [PubMed] [Google Scholar]
- Wilson CJ. Cellular mechanisms controlling the strength of synapses. J Electron Microsc Tech. 1988;10:293–313. doi: 10.1002/jemt.1060100307. [DOI] [PubMed] [Google Scholar]
- Zaitsev AV, Povysheva NV, Gonzalez-Burgos G, Lewis DA. Electrophysiological classes of layer 2/3 pyramidal cells in monkey prefrontal cortex. J Neurophysiol. 2012;108:595–609. doi: 10.1152/jn.00859.2011. [DOI] [PMC free article] [PubMed] [Google Scholar]
- Zhong W, Jiang MM, Weinmaster G, Jan LY, Jan YN. Differential expression of mammalian Numb, Numblike and Notch1 suggests distinct roles during mouse cortical neurogenesis. Development. 1997;124:1887–1897. doi: 10.1242/dev.124.10.1887. [DOI] [PubMed] [Google Scholar]