Abstract
We use a stochastic simulation model to explore the effect of reactive intervention strategies during the 2002 dengue outbreak in the small population of Easter Island, Chile. We quantified the effect of interventions on the transmission dynamics and epidemic size as a function of the simulated control intensity levels and the timing of initiation of control interventions. Because no dengue outbreaks had been reported prior to 2002 in Easter Island, the 2002 epidemic provided a unique opportunity to estimate the basic reproduction number ℛ0 during the initial epidemic phase, prior to the start of control interventions. We estimated ℛ0 at 27.2 (95%CI: 14.8, 49.3). We found that the final epidemic size is highly sensitive to the timing of start of interventions. However, even when the control interventions start several weeks after the epidemic onset, reactive intervention efforts can have a significant impact on the final epidemic size. Our results indicate that the rapid implementation of control interventions can have a significant effect in reducing the epidemic size of dengue epidemics.
Key words and phrases: Dengue, dengue hemorrhagic fever, epidemic, easter island, chile, 2002 outbreak, mathematical model, reproduction number
1. Introduction
Dengue is a mosquito-borne viral infectious disease that causes significant epidemic outbreaks, particularly in tropical and subtropical areas. The World Health Organization estimates 50 million new cases of dengue per year globally [39]. The spectrum of dengue disease includes asymptomatic [37] infection, clinically non-specific flu-like symptoms, dengue fever (DF), dengue hemorrhagic fever (DHF), and dengue shock syndrome (DSS). Dengue hemorrhagic fever and dengue shock syndrome are the most severe forms of dengue infection. Seasonal variations in temperature and rainfall have been associated with levels of dengue infection, where the number of dengue cases increases with higher rainfall and temperature [22, 33, 7]. The local risk of dengue infection has been shown to be affected by geographic factors and human movement patterns [24, 35, 4].
Aedes aegypti is the main vector transmitter of the dengue virus. The ability of Aedes aegypti mosquitoes to become viable transmitters of dengue is tightly connected to local weather conditions. Specifically, temperature has been shown to affect the development, maturation and survival of Aedes aegypti as well as the biting frequency and extrinsic incubation period which is defined as the time period from exposure of the vector to the time the vector becomes infectious [15].
The spatial distribution of the dengue virus in the Americas has increased since 1970 when the efforts to eradicate the main vector, Aedes aegypti, declined particularly in Central America and the Amazon region. After the mosquito eradication efforts decreased, dengue incidence resurged and the four dengue serotypes started to circulate. Cases of dengue hemorrhagic fever also increased probably due to multiple re-infections with different dengue serotypes [15]. In the Americas, Chile is one the few countries that had not reported dengue outbreaks prior to the 2002 outbreak in Easter Island.
The basic reproduction number (ℛ0) is defined as the number of infected people generated by a single infectious person in an entirely susceptible population [2, 8, 36, 3]. Typically, if ℛ0 > 1 an epidemic occurs while if ℛ0 < 1 no outbreak is likely. For mosquito-borne diseases, like dengue, the infection is transmited through an intermediate vector, the infected mosquitoes. Estimates of the reproduction number for dengue have varied widely [22, 26, 27, 10, 17]) which suggests highly heterogeneous levels of population immunity, vector density coupled with weather conditions, and differences in the intensity of dengue control efforts. These control interventions target vector breeding sites, adult mosquitoes, and reducing the contact rate, between adult mosquitoes and hosts [5]. We note that the estimation of the actual basic reproduction number ℛ0 in endemic dengue areas is complicated by the lack of data on the immunological history of the population shaped by prior exposure to different dengue serotypes.
In Chile, the presence of the Aedes aegypti mosquito has been reported in the northern areas where climatic conditions favor the vector population growth. However, Aeges aegypti mosquitoes had not been detected from entomological surveillance data from 1945 to early 2000 after a mosquito eradication campaign. The presence of the vector was confirmed in Easter Island, Chile by the end of 2000, when the mosquito was estimated to be in approximately 70% of the households [1]. As a result, an epidemiological surveillance system to keep track of febrile cases was implemented by the Department of Epidemiology of the Ministry of Health of Chile in October 2000 to help identify autochthonous dengue fever transmission in the Island. A vector control program helped reduce the vector infestation index in households to 5% [1].
The 2002 dengue epidemic in the small population of Easter Island is an exceptional opportunity to analyze the transmissibility of dengue (ℛ0) in a fully susceptible population, as no other dengue outbreaks had been previously reported in this region [1]. The reactive control interventions started about 30 days following the epidemic onset and provides data to validate epidemic modeling for exploring the effect of reactive control interventions during a dengue outbreak. For this purpose we used a stochastic dengue transmission model that incorporates vector and host interactions to study this epidemic. We quantified the basic reproduction number ℛ0 during the initial epidemic phase, and assessed the effect of different levels of control intervention intensities on the epidemic dynamics and the distribution of final outbreak sizes.
2. Materials and methods
2.1. Demographic, epidemic, weather, and travel data
Easter Island is located in the South Pacific about 3800 km from the Chilean continental coast with an annual average temperature of 21.1°C. In 2002, it had a population of about 3820 people living in the urban area, Hanga Roa. The great majority of the Island population belongs to the ethnic Rapa Nui. Their main occupations are fishing and tourism. A total of 13, 251 people traveled to the Island in January 2002. Of those, approximately 45% of visitors came from Brazil, 9% from Argentina and 5% from Oceania and other Islands of the South Pacific [1].
On March 13th, 2002, the first autochthonous dengue case was diagnosed on Easter Island by Elisa IgM antibody testing and subsequently confirmed by the Instituto de Salud Publica de Chile (ISP) through serological testing. DEN-1 was identified as the serotype responsible for this 2002 epidemic [31]. The index case corresponded to a 21-year old female patient that presented with high fever (39°C), myalgias, arthralgias, headache, and rash for seven days. Of note, only a few sporadic dengue importations were detected in Continental Chile in 2000 and 2001 that resulted from travel to dengue affected areas in the Americas before the 2002 outbreak in Easter Island. Hence, the 2002 dengue outbreak was the first major outbreak in Insular Chile.
Following the confirmation of dengue in Easter Island, an emergency control team of the Chilean Ministry of Health traveled to Easter Island to start control interventions on March 16th, 2002 with the following goals: (i) analyze the status of the outbreak, (ii) optimize diagnosis of clinical cases including the identification of serotypes and basic demographic data, (iii) enhance vector control interventions, and (iv) optimize the management of dengue cases. Standard vector control efforts included educational campaigns, reduction of breeding sites and insecticide spraying during 6 weeks to eliminate adult mosquitoes in areas of high mosquito infestation. About 5% of sampled houses were found infested with Aedes Aegypti [1].
The acute dengue cases were detected though an active surveillance system. A dataset comprising dengue notifications was reconstructed retrospectively by reviewing medical records of individuals admitted to the emergency department of the Hanga Roa Hospital, including the two previous months to the detection of the index case. According to the World Health Organization case definition [40], a suspected dengue case was any person presenting high fever with a maximum duration of 7 days with two or more of the following clinical symptoms: headache, retro-orbital pain, myalgias, arthralgias, rash, hemorrhagic manifestations (epistaxis, conjunctivitis, and positive torniquete test) and leucopenia. A fraction of suspected dengue cases were confirmed by laboratory testing through Elisa antibody IgM tests or PCR (polymerase chain reaction). For cases with clinical evolution of at least 6 days from symptoms onset, laboratory testing was conducted via IgM antibody tests while cases with up to 3 days of clinical evolution were tested by PCR.
A total of 550 dengue cases were reported to the Chilean Ministry of Health from January 1st 2002 to June 31st, 2002, of which 160 (29.1%) cases were laboratory-confirmed by the Instituto Nacional de Salud Pública de Chile (ISP). For each dengue case, we obtained the date of symptoms onset, age, and whether the case was confirmed by laboratory means. We also obtained estimates of population size of Easter Island for 2002 from the Instituto Nacional de Estadísticas (INE) [19].
Different epidemiological aspects of dengue transmission via the mosquito A. aegypti are known to depend on the weather conditions [21, 23, 28, 34]. Notably, the extrinsic incubation period has been shown to depend on ambient temperature [28, 12] whereby the extrinsic incubation period decreases as ambient temperature increases. To account for this temperature dependence on vector behavior, we obtained time series of daily meteorological station mean, minimum and maximum temperature from the Dirección Meteorológica de Chile [9]. The mean temperature during the initial epidemic phase was used to estimate the extrinsic incubation period using the thermodynamic relationship given in Focks et al. [12].
We obtained data on the monthly number of international passengers arriving to Easter Island in 2002 from Junta de Aeronáutica Civil. We used 2008 data as a control for the potential impact of incoming travelers on the dengue epidemic.
2.1.1. Estimating ℛ0 from the intrinsic growth rate
We estimated the basic reproduction number prior to the initiation of mitigative interventions and when the effects of susceptible depletion are negligible. The approach that we employ here assumes that the initial disease incidence is exponential and tracks the actual incidence curve of dengue [10]. That is, it is assumed that the reporting rate does not change significantly during the initial epidemic growth phase and that the underlying mechanisms transmitting the disease do not change during the early epidemic.
The estimate for ℛ0 depends on the initial growth rate of the epidemic (r), the incubation (τi) and infectious period of the host (γh), and the extrinsic incubation period (τe) and the mortality rate of the vector (μυ).
| (1) |
In the above formula, the host and vector incubation periods are assumed to be fixed while the host infectious period and the mosquito life expectancy (1/μυ) are assumed to be exponentially distributed. We estimated the initial exponential growth rate r through a generalized Poisson linear model. The assumed initial exponential phase of the epidemic corresponds to the “free course” state of the epidemic in the absence of control interventions, behavioral changes, and other saturation effects.
2.2. Dengue transmission model
Dengue transmission models are typically based on the simplifying assumption that the key epidemiological parameters are fixed (zero variance) or follow an exponential distribution [2, 10, 32, 25, 26, 27, 24, 10]. Hence, we use the more elaborate dengue transmission model [5] that incorporates more realistic distributions of key epidemiological quantities in dengue transmission. According to this approach, the intrinsic and extrinsic incubation periods and host infectious period are modeled using stage-progression compartmental modeling or the well-known linear chain trick (e.g., [20, 18, 38]). That is, the incubation and infectious periods are modeled as the progression in eh incubation substates in humans (Eh1, Eh2, …, Eheh), eυ incubation substates in mosquitoes (Eυ1, Eυ2, …, Eυeυ) and ih infectious substates in humans (Ih1, Ih2, …, Ihih). Under this formulation, the resulting incubation and infectious periods follow a gamma distribution with integer parameters eh, eυ and ih, respectively. When the rates of progression between substates are given by ehkh, eυkυ for the incubation periods and ihγh for the infectious period in humans, the resulting gamma distribution has means 1/kυ, 1/kh and 1/γh for the incubation and infectious periods, respectively, and the corresponding variances are given by and and , respectively.
Furthermore, susceptible and recovered hosts are denoted by Sh and Rh, respectively, and susceptible mosquitoes are denoted by Sυ. The total numbers of susceptible humans and adult susceptible mosquitoes are given by Nh and Nυ, respectively. The disease-induced mortality rate on humans is assumed negligible while the birth and natural death rates of mosquitoes are assumed to have a common value μυ to model a constant mosquito population size. A susceptible human may be infected with dengue from the bite of an infectious mosquito during probing and feeding. The rate of susceptible host infection is where m is the number of female mosquitoes per person, C is the mean rate of mosquito bites per mosquito, βhυ is a constant transmission probability per bite from an infectious mosquito, and is the probability that a mosquito bite is made by an infectious mosquito. Susceptible mosquitoes become infected from an infectious human during probing and feeding at the rate where βυh is a constant transmission probability per bite from an infectious human to a susceptible mosquito, and is the probability that a random mosquito bite is made to an infectious human at time t.
The system of differential equations that describes the transmission dynamics of dengue described above is given by the nonlinear system of differential equations:
| (2) |
where C(t) keeps track of the cumulative number of symptomatic dengue cases.
The basic reproduction number for this model (2) is given by the formula [5]:
| (3) |
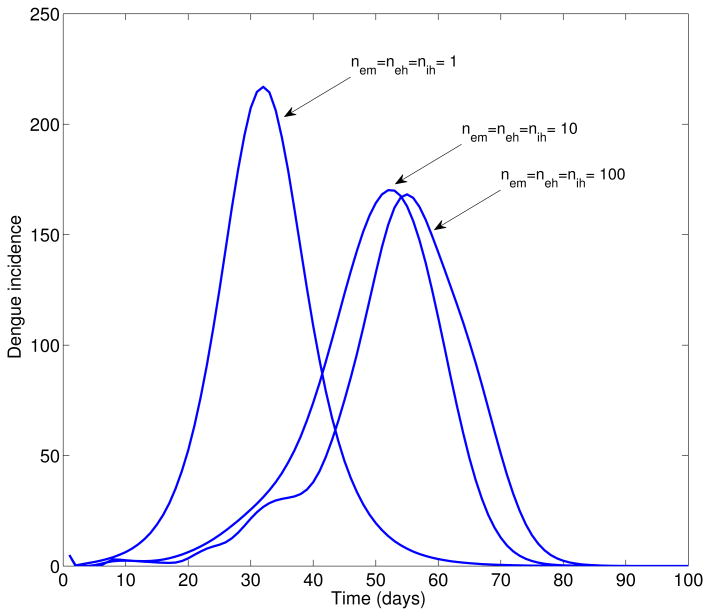
The effect of the shape of the incubation period distributions on the shape of the epidemic growth phase is illustrated in Figure 1. Overall the time from epidemic onset to peak increases with decreasing variance in the distribution of epidemiological parameters. When eυ = eh = ih = 1 the extrinsic incubation period, the intrinsic incubation period, and the infectious period are exponentially distributed (largest variance) while eυ = eh = ih = ∞ model fixed distributions (zero variance) of these epidemiological parameters [5].
Figure 1.
Simulated deterministic dengue epidemics according to the epidemiology of dengue (Table 1, basic reproduction number, ℛ0 = 24), the population size of Easter Island, a baseline average of 3 mosquitoes per person, and changing variance of the distribution of the extrinsic incubation period, the intrinsic incubation period, and the infectious period in humans. Overall the time from epidemic onset to peak increases with decreasing variance in the distribution of epidemiological parameters. Nem = neh = nih = 1 corresponds to exponentially distributed (largest variance) extrinsic incubation period, the intrinsic incubation period, and the infectious period and the Nem = neh = nih = 100 model fixed distributions (zero variance) of these epidemiological parameters. Notice that as the variance decreases, the epidemic is delayed and the peak incidence decreases.
In small populations, such as on Easter Island, the random (stochastic) effects can be more than in large populations. To quantify the uncertainty created by the stochastic events in a small population, we generated multiple stochastic epidemic realizations of dengue transmission and control. We explored the outbreak size distribution for our model (2) as a function of the timing and intensity of reactive control interventions using a stochastic poisson simulation approach [14].
To compare the impact of different control intervention scenarios, we focused on quantifying the effect of reducing the vector population and reducing the transmission rate between hosts and vectors. We modeled reductions in vector density by reducing the steady state of the vector population Nυ and vector density parameter m. We assume that vector density is immediately diminished by a reduction factor x following the start of vector control interventions.
There are few reliable estimates for the mean ratio of female mosquitoes per host (m) required to fully define the parameters in the model equations. We fixed m = 3 and performed a sensitivity analysis on parameter m. The mean mosquito mortality rate (μυ), the mean extrinsic and intrinsic incubation periods (1/kυ and 1/kh, respectively), and the mean host infectious period (1/γh) were taken from published literature and are given in Table 1. The extrinsic incubation period was estimated using the local mean temperature during the initial epidemic growth phase based on the thermodynamic relation from Focks et al. [12] to fix the temperature dependence on the mosquito.
Table 1. Model parameter definitions and their corresponding baseline values.
| Parameter | Definition | Mean estimate | Source |
|---|---|---|---|
| ℛ0 | Basic reproduction number | 27.2 (95% CI: 14.8, 49.3) | Estimated |
| 1/μυ | Mean adult mosquito lifespan (days) | 10.5 (95% CI: 6,15) | [29] |
| 1/kυ | Mean extrinsic incubation period (days) | 12.1 (95% CI: 11.6, 12.7) | [12] |
| m | Ratio of mosquitos per host | 3 (range:1-10) | [5] |
| Nυ | Mosquito population size | mNh | [5] |
| Cβhυ | Mean transmission rate from vectors | 0.7 | [5] |
| Cβυh | Mean transmission rate from hosts | 0.7 | [5] |
| N | Easter Island population size | 3978 | [19] |
| 1/kh | Mean host intrinsic incubation period (days) | 5.5 (95% CI: 4,7) days | [13] |
| 1/γh | Mean host infectious period (days) | 5.0 (95% CI: 3,7) days | [13] |
The variability in the incubation and infectiousness in the mosquitoes and humans is accounted for by adding additional compartments to the time-progression for the infection. The number of stages can be estimated based on the approximate mean and variance of the distributions of the intrinsic (1/kh = 5.5 days, ) and extrinsic (1/kυ = 12.1 days, ) (for the entire state) incubation periods and the infectious period in humans (1/γh = 5.0 days, ). Our estimates, again based on the approximate mean and variance of these distributions, are subcompartments for the intrinsic incubation period and for the extrinsic incubation period. We also estimate subcompartments are needed to model a realistic variance of the infectious period in humans.
The extrinsic incubation period was adjusted according to local mean temperature during the initial epidemic phase according to the thermodynamic relation from Focks et al. [12] as in previous studies [5, 6]to fix the temperature dependence on the mosquito incubation time [12]. The mosquito mortality rate was assumed to be independent of ambient temperature as in other studies [30, 5, 6]. Parameter definitions and baseline values are summarized in Table 1.
Because of the population of Easter Island had not been affected by dengue prior to 2002 [1], we model a completely susceptible population before the start of the dengue epidemic. Dengue epidemics were initialized with 5 dengue symptomatic cases. The initial extrinsic incubation period is directly a function of mean temperature in Easter Island during the early epidemic phase according to the thermodynamic relation given in Focks et al. [12].
3. Results
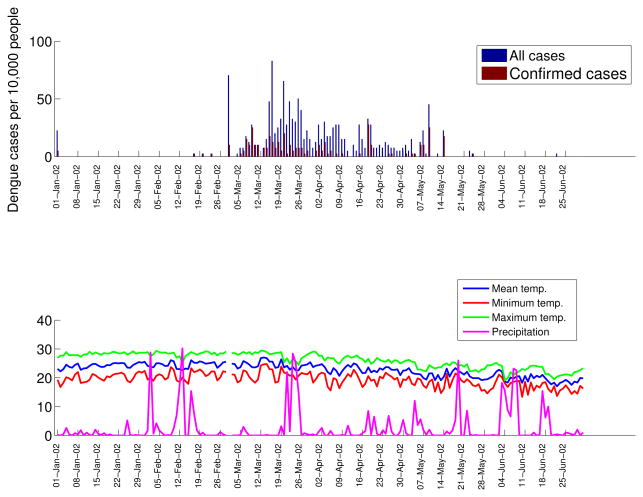
All age groups were affected during the dengue epidemic (Figure 2) with the highest incidence rates occurring among individuals aged 15-29 years (18.3%) and lowest incidence rates reported among infants < 5 years (7.3%). The time series of total dengue cases and laboratory-confirmed dengue cases are shown in Figure 3 (top), and the time series of daily minimum, mean, and maximum temperature and precipitation are shown in Figure 3 (bottom). The average attack rate for the entire population was 13.8%.
Figure 2.
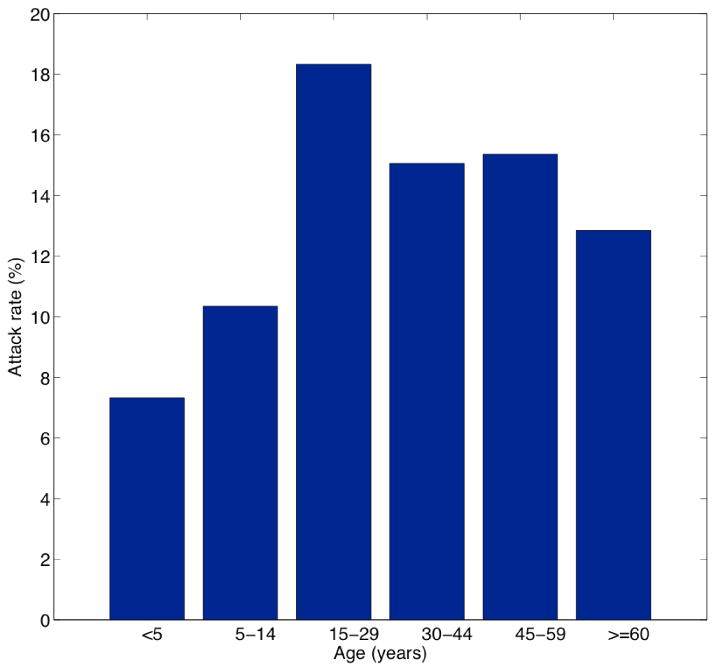
Age-specific dengue attack rates in Easter Island Chile during the 2002 outbreak, 01 January to June 31st, 2002. Note that the attack rate for young children is less than half of the attack rate for residents between 15 – 29 years old.
Figure 3.
Daily time series of all cases and laboratory-confirmed dengue cases by date of symptoms onset (top) and daily time series of temperature (mean, minimum and maximum) and total precipitation (bottom).
During the early phase of the epidemic the mean temperature (24.6°C) resulted in an associated extrinsic incubation of 12.1 days. We estimated that only 31.5% of infected mosquitoes survived the extrinsic incubation period and became infectious using the survival approximation .
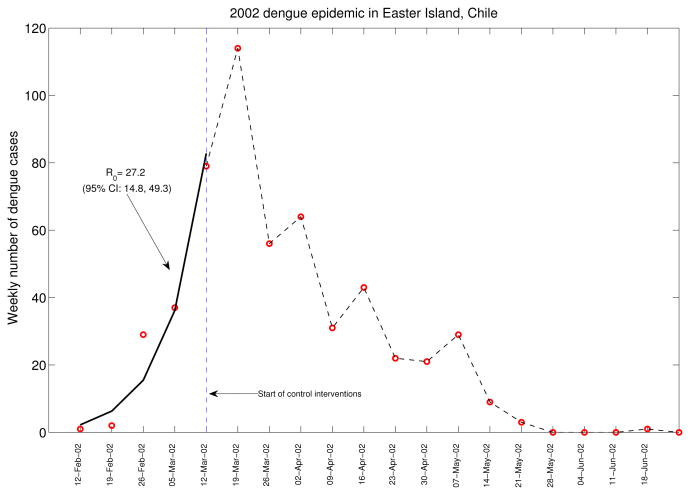
Figure 4 displays the growth of the epidemic and the timing of control interventions. Our estimate of the basic reproduction number, ℛ0, at 27.2 (95%CI: 14.8, 49.3) is based on the early phase of the epidemic, before control interventions started. The significant uncertainty in ℛ0 is partially due to the small population size of the Island and the few weekly dengue counts used to estimate the initial epidemic growth rate as shown in Figure 4. The high mean estimate of ℛ0 reflects the fact that no other dengue outbreaks had been reported in the island and the absence of control interventions during the early epidemic phase.
Figure 4.
Estimated exponential growth phase during the first 5 weeks of the 2002 dengue outbreak in Easter Island, Chile (solid line). Red circles are weekly dengue case counts during the entire dengue outbreak. The date of start of interventions (dashed line) is shown as a reference. The basic reproduction number was estimated at 27.2 (95% CI: 14.8, 49.3) based on the disease incidence before the interventions started.
A review of the literature indicates that estimates of the reproduction number for dengue have varied widely. Our estimate of ℛ0 for the 2002 epidemic in Easter Island falls within the upper range of estimates of the reproduction number for dengue [22, 26, 27, 10, 17, 16, 6]). This may be due to the population being fully susceptible, since no dengue outbreaks had been reported in Easter Island prior to the 2002 epidemic. Koopman et al. [22] estimated the reproduction number using the relationship between the basic reproduction number and the final epidemic size from a national serosurvey comprising 3408 households in 70 localities in Mexico from March to October, 1986. Their mean estimate of the reproduction number is 1.3 (maximum of 2.4) significantly lower than the mean estimate reported here. Ferguson et al. [11] report estimates for dengue ranging from 4 to 6 for DEN-2 from cross-sectional serological data collected in Thailand using mathematical modeling and statistical methods. The reproduction number for dengue has also been estimated in the state of São Paulo, Brazil [26, 27] and a number of Brazilian regions covering different tropical climates [10]. Marques et al. [26] estimated reproduction numbers in the range [1.6, 2.5] in 12 cities of the state of São Paulo, Brazil during a 1991 epidemic. During the 2000 epidemic in 12 cities of the state of São Paulo, Brazil, Massad et al. [27] estimated reproduction numbers in the range [3.6, 12.9]. More recently, Chowell et al. [6] reported estimates of the reproduction number of dengue epidemics at the province level in Peru during 1994-2006 in the range of 0.1 to 113 with an overall median reproduction number of 1.8. This study also found higher heterogeneity in dengue attack rates in coastal areas followed by mountain range areas and jungle areas. Favier et al. [10] estimated a reproduction number that ranged widely from 2.0 to 103 for dengue epidemics occurring during the years 1996-2003 in 9 Brazilian regions. More recent studies have estimated the reproduction number at 2.2 for the 2005 dengue epidemic in Singapore [17] and 3.9-4.7 for the dengue epidemics of 2007 in Taiwan [16]. Overall, high variability in estimates of the reproduction number may be due to a combination of factors that include background susceptibility and cross-reactivity to circulating dengue strain, population density, spatial heterogeneity in vector density, differences in climatological conditions influencing the survival and transmission potential of vectors, and differences in estimation methods.
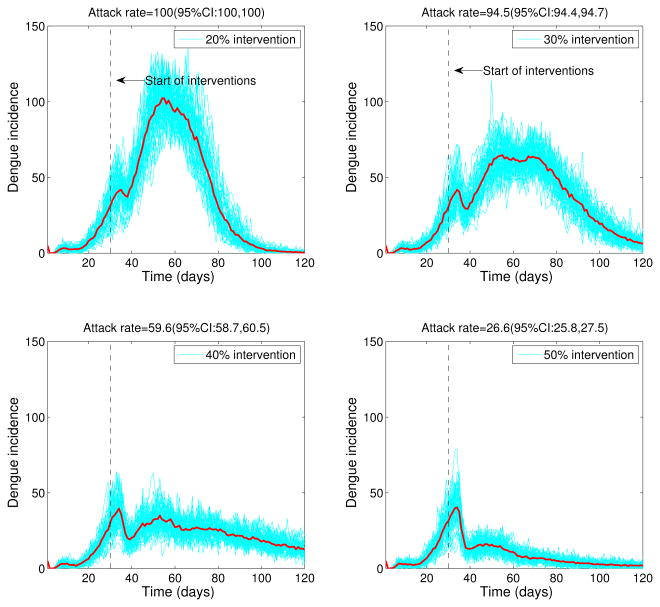
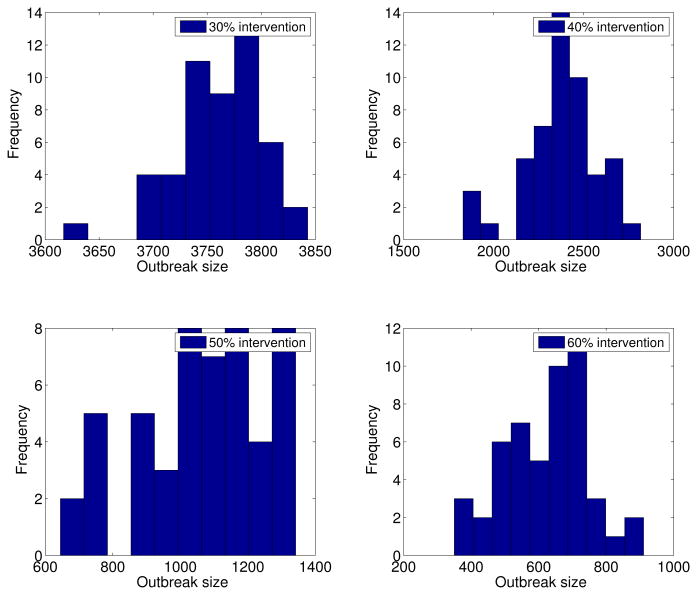
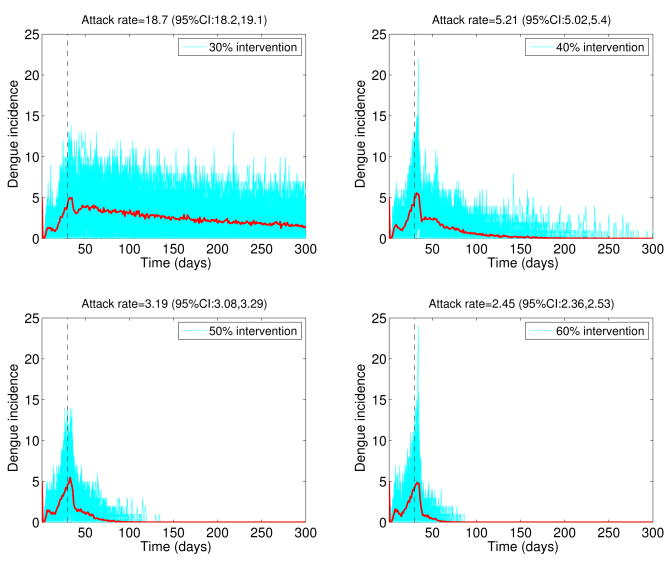
The stochastic transmission model simulations, with parameters given in Table 1 and ℛ0 = 24, are illustrated in Figure 5. We found that small intensity interventions (< 30%) were unable to affect the final epidemic size of the dengue outbreaks (Figure 5) as a result of the late start of the interventions and high ℛ0 values. Reductions of 50% in mosquito density and the transmission rate between mosquitoes and hosts, respectively, following the start of the control interventions on March 16th, 2002 yielded an average overall attack rate of 26.6%. Figure 6 shows the variability in dengue outbreak size distribution according to intensity of reactive control interventions ranging from 30% to 60%. For smaller values of ℛ0, epidemic control can be achieved with less effort (Figure 7).
Figure 5.
Effect of reactive control interventions on dengue epidemics. Stochastic dengue epidemics were simulated based on model 2 according to the epidemiology of dengue (Table 1, basic reproduction number, ℛ0 = 24), the population size of Easter Island, a baseline average of 3 mosquitoes per person, and reductions of 20% to 50% in mosquito density and the transmission rate between mosquitoes and hosts, respectively, following the start of the control interventions on March 16th, 2002. A total of 50 stochastic epidemic realizations are shown in blue. The red solid curve corresponds to the average of stochastic realizations. Note that the outbreak size is highly sensitive to even slight decreases in the percentage of reductions in the mosquito populations.
Figure 6.
Dengue outbreak size distribution according to intensity of reactive control interventions. Final outbreak size histograms were obtained from stochastic epidemic simulations (model 2) according to the epidemiology of dengue (Table 1, basic reproduction number, ℛ0 = 24), the population size of Easter Island, a baseline average of 3 mosquitoes per person, and reductions of 30% to 60% in mosquito density and the baseline transmission rate between mosquitoes and hosts following the start of control interventions on March 16th, 2002.
Figure 7.
Effect of reactive control interventions on dengue epidemics. Stochastic dengue epidemics were simulated based on model 2 according to the epidemiology of dengue (Table 1, basic reproduction number, ℛ0 = 5), the population size of Easter Island, a baseline average of 3 mosquitoes per person, and reductions of 30% to 60% in mosquito density and the transmission rate between mosquitoes and hosts, respectively, following the start of the control interventions on March 16th, 2002. A total of 50 stochastic epidemic realizations are shown in blue. The red solid curve corresponds to the average of stochastic realizations.
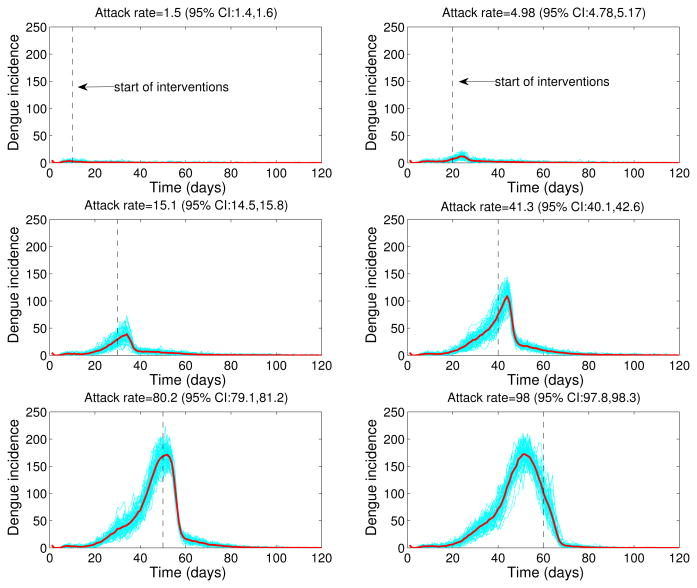
We also explored the impact of the timing of start of interventions on dengue dynamics and final epidemic size after fixing the intensity of control interventions at 80%. We then varied the timing of start of interventions from 10 to 60 days after the epidemic onset and generated stochastic dengue epidemics according to the epidemiology of dengue (Table 1, basic reproduction number, ℛ0 = 24), and the population size of Easter Island. The final epidemic size was highly sensitive to the timing of start of interventions with mean attack rates ranging from 1.5% (small outbreak) when interventions started 10 days after epidemic onset to 98% when interventions started 60 days after epidemic onset (Figure 8).
Figure 8.
Effect of timing of start of interventions on dengue epidemic outbreaks. Stochastic dengue epidemics were generated according to the epidemiology of dengue (Table 1, basic reproduction number, ℛ0 = 24), the population size of Easter Island, control interventions with 80% intensity and varying the start of interventions from 10 to 60 days after epidemic onset. Stochastic epidemic realizations are shown in blue. The red solid curve corresponds to the mean of stochastic realizations.
4. Discussion
We used a stochastic differential equation model for dengue transmission to evaluate the impact of reactive control strategies on the dynamics and final epidemic size of the 2002 dengue epidemic on Easter Island. Our model was calibrated using a high ℛ0 = 24 regime based on the actual epidemic incidence characteristic of dengue transmission in naive populations, an extrinsic incubation period based on mean temperature associated with the early epidemic phase, and a small population size characteristic of the epidemic. Our findings indicate that reactive mitigations efforts depending on level of intensity can significantly reduce the final epidemic size, even when control interventions are implemented several weeks after the epidemic onset. We note that our conclusion is conservative because our results are based on a large reproduction number as estimated for this previously immunologically naive population.
Our transmission model is an extension of the classical dengue transmission models [2, 32, 25] as it accounts for more realistic variability of the distribution of model parameters relating to the vector and host epidemiology [5]. In particular, the epidemic peak timing is significantly delayed as the variance of epidemiological quantities is reduced by moving from exponentially distributed incubation and infectious periods to essentially fixed epidemiological parameters with variance close to 0 (Figure 1). We have also taken into account the local variability of mean temperature during the early epidemic growth phase to better model the dependence between temperature and the mosquito incubation period. One limitation of our model is the assumption of homogenous mixing between hosts and vectors in the population. Hence, a more realistic contact structure could be incorporated to account for case clustering and spatial heterogeneity of vector density levels in the population when appropriate data are available. An effort in this direction has modeled qualitative patterns of dengue transmission in Easter Island and other localities in Brazil using household-level transmission units where hosts are allowed to visit other households with certain probability [10].
We relied on dengue notification data that was partially reconstructed as the epidemic evolved by reviewing medical records and through the implementation of an active surveillance system. Hence, it is expected that a number of asymptomatic and mild cases of dengue disease were not counted. Hence, the observed final epidemic size should be considered an underestimate. We also remark that our estimates of ℛ0 are robust to this limitation as long as underreporting levels did not change significantly during the early epidemic phase [10].
In summary, we have used a stochastic dengue transmission model to explore the effect of reactive control interventions on the dynamics and final epidemic size of dengue epidemics in a completely susceptible population. Our results suggest that reactive control interventions could have a significant effect on the final attack rates of dengue even when these start a few weeks after the epidemic onset. Furthermore, our estimate of ℛ0 based on epidemiological data of the 2002 dengue epidemic in Easter Island falls within the upper range of estimates of the reproduction number previously reported for other localities including endemic dengue areas. Because a significant fraction of this population now enjoys protective immunity to DEN-1, there is a potential for dengue hemorrhagic fever epidemics that could result from the introduction of novel dengue serotypes into the region [15]. We note that a total of 80 dengue cases have been reported during 2006-2010 following the 2002 dengue epidemic in Easter Island. Out of the 80 dengue cases, 3 cases have been due to serotype DEN-1 and 77 cases have been due to serotype DEN-4. This suggests that vector control efforts coupled with local climatic conditions and higher stochasticity associated with smaller populations play an important role on dengue transmission risk in Easter Island. In particular, based on local temperature data we have estimated that roughly 30% of mosquitoes were expected to survive the extrinsic incubation period to become viable dengue transmitters compared to 62.4% estimated for Peruvian localities at significantly higher temperatures [6]. Close monitoring of dengue viruses through epidemiological and virological surveillance in the vector and the host should facilitate the rapid identification of new dengue viruses and the rapid implementation of mitigation efforts.
Acknowledgments
This research (JH) was partially supported by an NIH/NIG-MS grant (1U01GM097661-01) in the Models of Infectious Disease Agent Study (MIDAS) program.
Contributor Information
G. Chowell, Email: gchowell@asu.edu, Mathematical and Computational Modeling Sciences Center, School of Human Evolution and Social Change, Arizona State University, Tempe, AZ 85287, USA, and, Fogarty International Center, National Institutes of Health, Bethesda, MD 20892, USA
R. Fuentes, Email: rodrigo.fuentes@minsal.cl, Department of Epidemiology, Ministerio de Salud, Santiago, Chile
A. Olea, Email: normandin07@gmail.com, Universidad del Desarrollo, Santiago, Chile
X. Aguilera, Email: ximenaguilera@gmail.com, Universidad del Desarrollo, Santiago, Chile
H. Nesse, Email: hnesse@asu.edu, School of Human Evolution and Social Change, Arizona State University, Tempe, AZ 85287, USA
J. M. Hyman, Email: mhyman@tulane.edu, Tulane University, New Orleans, LA, 70118, USA
References
- 1.Aguilera X, Olea A, Mora J, Abarca K, Segovia J. Brote de dengue en Isla de Pascua. El Vigia (Boletín de Vigilancia en Salud Pública) 2002;16:37–38. [Google Scholar]
- 2.Anderson RM, May RM. Infectious Diseases of Humans. Oxford University Press; Oxford, UK: 1991. [Google Scholar]
- 3.Brauer F, Castillo-Chavez C. Mathematical Models in Population Biology and Epidemiology. Springer-Verlag; New York: 2000. [Google Scholar]
- 4.Chowell G, Cazelles B, Broutin H, Munayco CV. The influence of climatic and geographic factors on the timing of dengue epidemics in Peru, 1994-2008. BMC Infectious Diseases. 2011;11:164. doi: 10.1186/1471-2334-11-164. [DOI] [PMC free article] [PubMed] [Google Scholar]
- 5.Chowell G, Diaz-Duenas P, Miller JC, Fenimore PW, Hyman JM, Castillo-Chavez C. Estimation of the reproduction number of dengue fever from spatial epidemic data. Mathematical Biosciences. 2007;208:571–589. doi: 10.1016/j.mbs.2006.11.011. [DOI] [PubMed] [Google Scholar]
- 6.Chowell G, Torre CA, Munyaco-Escate C, Suarez-Ognio L, Lopez-Cruz R, Hyman JM, Castillo-Chavez C. Spatial and temporal dynamics of dengue fever in Peru: 1994-2006. Epidemiology and Infection. 2008;8:1–11. doi: 10.1017/S0950268808000290. [DOI] [PMC free article] [PubMed] [Google Scholar]
- 7.Chowell G, Sanchez F. Climate-based descriptive models of dengue fever: The 2002 epidemic in Colima, Mexico. Journal of Environmental Health. 2006;68:40–44. [PubMed] [Google Scholar]
- 8.Diekmann O, Heesterbeek J. Wiley Series in Mathematical and Computational Biology. John Wiley & Sons, Ltd.; Chichester: 2000. Mathematical Epidemiology of Infectious Diseases: Model Building, Analysis and Interpretation. [Google Scholar]
- 9.Dirección Meteorológica de Chile. Available from: http://www.meteochile.cl/
- 10.Favier C, Degallier N, Rosa-Freitas MG, Boulanger JP, Costa Lima JR, Luitgards-Moura JF, Menkes CE, Mondet B, Oliveira C, Weimann ET, Tsouris P. Early determination of the reproduction number for vector-borne diseases: The case of dengue in Brazil. Tropical Medicine and International Health. 2006;11:332–340. doi: 10.1111/j.1365-3156.2006.01560.x. [DOI] [PubMed] [Google Scholar]
- 11.Ferguson NM, Donnelly CA, Anderson RM. Transmission dynamics and epidemiology of dengue: Insights from age-stratified sero-prevalence surveys. Phil Trans Roy Soc Lond B. 1999;354:757–768. doi: 10.1098/rstb.1999.0428. [DOI] [PMC free article] [PubMed] [Google Scholar]
- 12.Focks DA, Daniels E, Haile DG, Keesling JE. A simulation model of the epidemiology of urban dengue fever: Literature analysis, model development, preliminary validation, and samples of simulation results. American Journal of Tropical Medicine and Hygiene. 1995;53:489–506. doi: 10.4269/ajtmh.1995.53.489. [DOI] [PubMed] [Google Scholar]
- 13.Gubler DJ. Dengue and dengue hemorrhagic fever. Clinical Microbiology Reviews. 1998;11:480–496. doi: 10.1128/cmr.11.3.480. [DOI] [PMC free article] [PubMed] [Google Scholar]
- 14.Gustafsson L, Sternad M. Bringing consistency to simulation of population models– Poisson simulation as a bridge between micro and macro simulation. Mathematical Biosciences. 2007;209:361–385. doi: 10.1016/j.mbs.2007.02.004. [DOI] [PubMed] [Google Scholar]
- 15.Halstead SB. Dengue virus-mosquito interactions. Annu Rev Entomol. 2007;53:273–291. doi: 10.1146/annurev.ento.53.103106.093326. [DOI] [PubMed] [Google Scholar]
- 16.Hsieh YH, Chen CW. Turning points, reproduction number, and impact of climatological events for multi-wave dengue outbreaks. Trop Med Int Health. 2009;14:628–638. doi: 10.1111/j.1365-3156.2009.02277.x. [DOI] [PubMed] [Google Scholar]
- 17.Hsieh YH, Ma S. Intervention measures, turning point, and reproduction number for dengue, Singapore, 2005. American Journal of Tropical Medicine and Hygiene. 2009;80:66–71. [PubMed] [Google Scholar]
- 18.Hyman JM, Li J, Stanley EA. The differential infectivity and staged progression models for the transmission of HIV. Mathematical Biosciences. 1999;155:77–109. doi: 10.1016/s0025-5564(98)10057-3. [DOI] [PubMed] [Google Scholar]
- 19.Instituto Nacional de Estadísticas (INE) Estadísticas Demográficas y Vitales. 2009 Available from: http://www.ine.cl.
- 20.Jacquez JA. Compartmental Analysis in Biology and Medicine. Michigan Thompson-Shore, Inc.; Michigan: 1996. [Google Scholar]
- 21.Jetten TH, Focks DA. Potential changes in the distribution of dengue transmission under climate warming. American Journal Tropical Medicine and Hygiene. 1997;57:285–297. doi: 10.4269/ajtmh.1997.57.285. [DOI] [PubMed] [Google Scholar]
- 22.Koopman JS, Prevots DR, Vaca Marin MA, Gomez Dantes H, Zarate Aquino ML, Longini IM, Jr, Sepulveda Amor J. Determinants and predictors of dengue infection in Mexico. American Journal of Epidemiology. 1991;133:1168–1178. doi: 10.1093/oxfordjournals.aje.a115829. [DOI] [PubMed] [Google Scholar]
- 23.Li CF, Lim TW, Han LL, Fang R. Rainfall, abundance of Aedes aegypti and dengue infection in Selangor, Malaysia. Southeast Asian Journal of Tropical Medicine and Public Health. 1985;16:560–568. [PubMed] [Google Scholar]
- 24.Luz PM, Codeco CT, Massad E, Struchiner CJ. Uncertainties regarding dengue modeling in Río de Janeiro, Brazil. Memórias do Instituto Oswaldo Cruz. 2003;98:871–878. [PubMed] [Google Scholar]
- 25.MacDonald G. The Epidemiology and Control of Malaria. Oxford University Press; London: 1957. pp. 45–62. Chapter Epidemics. [Google Scholar]
- 26.Marques CA, Forattini OP, Massad E. The basic reproduction number for dengue fever in São Paulo state, Brazil: 1990–1991 epidemic. Transactions of the Royal Society of Tropical Medicine and Hygiene. 1994;88:58–59. doi: 10.1016/0035-9203(94)90498-7. [DOI] [PubMed] [Google Scholar]
- 27.Massad E, Coutinho FA, Burattini MN, Lopez LF. The risk of yellow fever in a dengue-infested area. Transactions of the Royal Society of Tropical Medicine and Hygiene. 2001;95:370–374. doi: 10.1016/s0035-9203(01)90184-1. [DOI] [PubMed] [Google Scholar]
- 28.Mourya DT, Yadav P, Mishra AC. Effect of temperature stress on immature stages and susceptibility of Aedes aegypti mosquitoes to chikungunya virus. American Journal Tropical Medicine and Hygiene. 2004;70:346–350. [PubMed] [Google Scholar]
- 29.Muir LE, Kay BH. Aedes aegypti survival and dispersal estimated by mark-release-recapture in northern Australia. American Journal of Tropical Medicine and Hygiene. 1998;58:277–282. doi: 10.4269/ajtmh.1998.58.277. [DOI] [PubMed] [Google Scholar]
- 30.Otero M, Solari HG, Schweigmann N. A stochastic population dynamics model for Aedes aegypti: Formulation and application to a city with temperate climate. Bulletin of Mathematical Biology. 2006;68:1945–1974. doi: 10.1007/s11538-006-9067-y. [DOI] [PubMed] [Google Scholar]
- 31.Perret C, Abarca K, Ovalle J, Ferrer P, Godoy P, Olea A, Aguilera X, Ferrés M. Dengue-1 virus isolation during first dengue fever outbreak on Easter Island, Chile. Emerg Infect Dis. 2003;9:1465–1467. doi: 10.3201/eid0911.020788. [DOI] [PMC free article] [PubMed] [Google Scholar]
- 32.Ross R. The Prevention of Malaria. John Murray; London: 1910. [Google Scholar]
- 33.Schultz GW. Seasonal abundance of dengue vectors in Manila, Republic of the Philippines. Southeast Asian Journal of Tropical Medicine and Public Health. 1993;24:369–375. [PubMed] [Google Scholar]
- 34.Smith DL, Dushoff J, Mckenzie FE. The risk of a mosquito-borne infection in a heterogeneous environment. PLoS Biology. 2004;2:1957–1964. doi: 10.1371/journal.pbio.0020368. [DOI] [PMC free article] [PubMed] [Google Scholar]
- 35.Stoddard ST, Morrison AC, Vazquez-Prokopec GM, Paz Soldan V, Kochel TJ, Kitron U, Elder JP, Scott TW. The role of human movement in the transmission of vector-borne pathogens. PLoS Negl Trop Dis. 2009;3:e481. doi: 10.1371/journal.pntd.0000481. [DOI] [PMC free article] [PubMed] [Google Scholar]
- 36.van den Driessche P, Watmough J. Reproduction numbers and sub-threshold endemic equilibria for compartmental models of disease transmission. Mathematical Biosciences. 2002;180:29–48. doi: 10.1016/s0025-5564(02)00108-6. [DOI] [PubMed] [Google Scholar]
- 37.Vaughn DW, Green S, Kalayanarooj S, Innis BL, Nimmannitya S, Suntayakorn S, Endy TP, Raengsakulrach B, Rothman AL, Ennis FA, Nisalak A. Dengue viremia titer, antibody response pattern, and virus serotype correlate with disease severity. Journal of Infectious Diseases. 2000;181:2–9. doi: 10.1086/315215. [DOI] [PubMed] [Google Scholar]
- 38.Wearing HJ, Rohani P, Keeling MJ. Appropriate models for the management of infectious diseases. PLoS Medicine. 2005;2:e174. doi: 10.1371/journal.pmed.0020174. [DOI] [PMC free article] [PubMed] [Google Scholar]
- 39.World Health Organization. Dengue and dengue hemorrhagic fever. [accessed March 04, 2006]; Available from: http://www.who.int/mediacentre/factsheets/fs117/en/
- 40.World Health Organization. Clinical diagnosis of dengue. [accessed April 04, 2006]; Available from: http://www.who.int/csr/resources/publications/dengue/012-23.pdf.


