

Abstract
Background
For the last decade, the importance of providing amplification up to 9–10 kHz has been supported by multiple studies involving children and adults. The extent to which a listener with hearing loss can benefit from bandwidth expansion is dependent on the audibility of high-frequency cues. The American National Standards Institute (ANSI) devised a standard method for measuring and reporting hearing aid bandwidth for quality-control purposes. However, ANSI bandwidth measurements were never intended to reflect the true frequency range that is audible for a speech stimulus for a person with hearing loss.
Purpose
The purpose of this study was to (1) determine the maximum audible frequency of conventional hearing aids using a speech signal as the input through the hearing aid microphone for different degrees of hearing loss, (2) examine how the maximum audible frequency changes when the input stimulus is presented through hearing assistance technology (HAT) systems with cross-coupling of manufacturers' transmitters and receivers, and (3) evaluate how the maximum audible frequency compares with the upper limit of the ANSI bandwidth measure.
Research Design
Eight behind-the-ear hearing aids from five hearing aid manufacturers were selected based on a range of ANSI bandwidth upper frequency limits. Three audiometric configurations with varied degrees of high-frequency hearing loss were programmed into each hearing aid. Hearing aid responses were measured with the International Speech Test Signal (ISTS), broadband noise, and a short speech token (/asa/) as stimuli presented through a loudspeaker. HAT devices from three manufacturers were used to create five HAT scenarios. These instruments were coupled to the hearing aid programmed for the audiogram that provided the highest maximum audible frequency in the hearing aid analysis. The response from each HAT scenario was obtained using the same three stimuli as during the hearing aid analysis.
Study Sample
All measurements were collected in an audiometric sound booth on a Knowles Electronic Manikin for Acoustic Research (KEMAR).
Data Collection and Analysis
A custom computer program was used to record responses from KEMAR. Maximum audible frequency was defined as the highest point where the Long-Term Average Speech Spectrum (LTASS) intersected the audiogram.
Results
The average maximum audible frequency measured through KEMAR ranged from 3.5 kHz to beyond 8 kHz and varied significantly across devices, audiograms, and stimuli. The specified upper limit of the ANSI bandwidth was not predictive of the maximum audible frequency across conditions. For most HAT systems, the maximum audible frequency for the hearing aid plus HAT condition was equivalent to the hearing aid for the same measurement configuration. In some cases, however, the HAT system imposed a lower maximum audible frequency than the hearing aid–only condition.
Conclusions
The maximum audible frequency of behind-the-ear hearing aids is dependent on the degree of hearing loss, amplification device, and stimulus input. Estimating the maximum audible frequency by estimating the frequency where the speech spectrum intersects the audiogram in the high frequencies can assist clinicians in making decisions about which device or configuration of devices provides the greatest access to high-frequency information, as well as whether frequency-lowering technology should be used.
Keywords: Hearing aid bandwidth, audible bandwidth, high-frequency audibility
Introduction
Hearing aid bandwidth traditionally has been restricted to an upper frequency of approximately 5–6 kHz. More recently, however, some hearing aids have advertised a high-frequency response that exceeds 10 kHz. Extending the bandwidth of hearing aids has been supported by multiple studies in children that have demonstrated improved speech recognition (Stelmachowicz et al, 2001) and an increased rate of novel word learning (Pittman, 2008). Additionally, in adults, improved vertical sound localization (Byrne and Noble, 1998), perceived sound quality for speech and music (Moore and Tan, 2003; Ricketts et al, 2008), and speech-in-noise performance (Peeters et al, 2011) have been reported with high-frequency bandwidths that extend up to 9–10 kHz. However, the extent to which a listener with hearing loss can benefit from bandwidth expansion is dependent on the audibility of high-frequency cues.
Restrictions of traditional hearing aid bandwidth have been linked to difficulties in fricative perception (Stelmachowicz et al, 2001) and production (Moeller et al, 2007) in children with hearing loss. Specifically, the peak energy of the high-frequency fricative /s/ is concentrated between 6.3–8.8 kHz in female speakers and in child speakers and is thus outside the range of amplification for most traditional hearing aids (Stelmachowicz et al, 2001). On the other hand, /s/ is typically audible with traditional amplification for male speakers as their peak energy occurs at approximately 5 kHz. The differences in the spectral characteristics of /s/ among speakers lead to inconsistent audibility of /s/ depending on the speaker, situation, and context (Stelmachowicz et al, 2001). This is problematic because the voiceless /s/ and its voiced counterpart /z/ are responsible for possession, plurality, and tense markers and is also the fifth most frequently occurring phoneme in the English language (Mines et al, 1978). Inconsistent exposure to /s/ can lead to marked speech and language delays (Moeller et al, 2007).
According to the American National Standards Institute ([ANSI] S3.22; ANSI, 2003), hearing aid bandwidth is quantified by first obtaining the frequency response curve by attaching the hearing aid to a 2-cc coupler in an appropriate test box and presenting a 60 dB SPL swept pure-tone signal. The average response of the hearing aid at 1, 1.6, and 2.5 kHz is calculated. A line is drawn parallel to the frequency axis at a level 20 dB less than this average. The highest and lowest frequencies at which the response curve intersects the horizontal line are considered the upper and lower bandwidth limits of the hearing aid, respectively. The purpose of this bandwidth measurement, as well as the other acoustic measurements specified by the standard, is to provide reference specifications for quality control. However, the ANSI S3.22 (2003) standard states that the frequency range measured using this method is for informational purposes only and does not provide tolerances for this measurement. The more important clinical aspect of bandwidth is how much of the speech spectrum is audible, given the listener's degree and configuration of hearing loss and the amount of amplification provided in the high frequencies. This information is not available through the ANSI S3.22 (2003) estimate of bandwidth because it is measured with a swept pure tone and does not take into account the impact of degree or configuration of hearing loss or the spectrum of speech on audibility. Presumably, as hearing loss increases in the high frequencies, the achievable high-frequency audibility of the hearing aid will decrease. An individualized estimate of high-frequency audibility that takes into account the listener's ear canal acoustics and degree and configuration of hearing loss, in addition to the electroacoustic aspects of the hearing aid, may provide a more accurate representation of high-frequency audibility.
To promote adequate speech and language development, the entire speech spectrum should be audible across multiple listening conditions. Hearing aids in conjunction with remote-microphone hearing assistance technology (HAT) help accomplish this in environments where distance, noise, and reverberation are present, such as in the classroom. HAT can improve the listener's signal-to-noise ratio above the advantages in audibility provided by a hearing aid. Specifically, remote-microphone HAT systems place a lapel-style or head-worn microphone close to the speaker's mouth, and the signal is wirelessly transmitted to a receiver coupled to the listener's hearing aids. Such a configuration provides the listener with a clear signal independent of the proximity of the speaker to the listener as well as an improved signal-to-noise ratio over the hearing aid alone (American Academy of Audiology [AAA], 2011). In this HAT configuration, the hearing aids serve as the signal input; therefore, the maximum audible frequency of the HAT can never be greater than that of the hearing aid, assuming equal inputs. However, it is possible for the maximum audible frequency of the HAT to be less than that of the hearing aid if the HAT imposes additional frequency restrictions, possibly eliminating high-frequency audibility that was present before the HAT was coupled.
As with hearing aids, HAT systems must be electro-acoustically verified to ensure that the system is providing appropriate audibility during use. The AAA HAT Clinical Practice Guidelines (2011) recommends using the concept of transparency to complete HAT verification. When transparency is achieved, the individual outputs from the hearing aid and the HAT are equal when presented with the same input level (65 dB SPL). When the system is used together, the output from the HAT microphone will be higher than from the hearing aids because the input to the HAT microphone is higher. Traditionally, a 10 dB HAT advantage has been recommended. Although this guideline helps ensure that the entire HAT system is functioning appropriately, specifying the bandwidth of the signal is not currently recommended as part of the guidelines and has not been described in previous studies.
Although research has supported bandwidth expansion for the detection of high-frequency speech sounds, the relationship between ANSI bandwidth and the maximum audible frequency for an individual with hearing loss is less clear. This is an important relationship to investigate, as published ANSI bandwidth ranges are one of the only standard metrics of bandwidth available. Therefore, if clinicians wish to compare bandwidth specifications across devices, they are restricted to using the data provided by ANSI. It is important to remember that the ANSI bandwidth was designed purely for quality-control purposes and does not reflect an audible, working bandwidth attainable for all audiometric degrees and configurations. Furthermore, the effects of remote microphone HAT on the maximum audible frequency have not been described in previous studies.
In the current study, “upper limit of ANSI bandwidth” refers to the highest frequency obtained from the ANSI S3.22 (2003) measure in a test box. “Maximum audible frequency” refers to the highest frequency measured on a Knowles Electronic Manikin for Acoustic Research (KEMAR), where the average of the speech spectrum is above an individual's threshold of hearing. The average of the speech spectrum was chosen instead of the peaks of speech because it is a more conservative estimate of high-frequency audibility and also because such a measure is easy to calculate using existing hearing aid verification methods.
The purpose of the current study was to first determine the maximum audible frequency of conventional hearing aids using a realistic speech signal as the input through the hearing aid microphone for different degrees of hearing loss. It was hypothesized that the upper limit of the ANSI bandwidth would not be an accurate predictor of the maximum audible frequency across varying degrees of hearing loss and hearing aids. Specifically, it was predicted that the ANSI measurement would overestimate the highest audible frequency and that this point would decrease as the degree of high-frequency hearing loss increased.
Next, the maximum audible frequency of conventional hearing aids was measured when coupled to HAT systems using a realistic speech signal. It was predicted that the maximum audible frequency obtained from the HAT devices would be at best equal to that obtained in the hearing aid–only condition; however, it could be less if the HAT receiver itself imposes a restricted frequency range. The effect of the HAT maximum audible frequency was also analyzed when receivers and transmitters from different HAT manufacturers were cross-coupled. Depending on a school district's immediate device availability, educational audiologists oftentimes must pair a transmitter from one manufacturer with a receiver from another manufacturer to provide the child with hearing loss an immediate classroom amplification option. Because devices from different manufacturers do not have the same specification data, it is reasonable to presume that a cross-coupled configuration may perform suboptimally than one that is not intermixed. Therefore, it was hypothesized that cross-coupling transmitters and receivers would have a negative effect on the highest frequency that would be audible.
Finally, the maximum audible frequency obtained through the hearing aid microphone was compared with the manufacturer's published upper limit of the ANSI bandwidth for quality-control purposes. As stated previously, it was hypothesized the ANSI bandwidth would overestimate the true highest audible frequency across all conditions.
Methods
Hearing Aid Selection
Eight models of behind-the-ear (BTE) hearing aids from five different manufacturers were selected based on their specified upper limit of ANSI bandwidth (ANSI S3.22, 2003). The hearing aids included were Siemens Explorer 500 P (5.1 kHz), Phonak Ambra Micro P (5.5 kHz), Oticon Chili SP9 (6.5 kHz), Starkey S Series IQ II (6.6 kHz), Phonak Naida SIX SP (6.9 kHz), Phonak Nios S H20 V (7.1 kHz), Widex Clear 440 (7.2 kHz), and Oticon Safari 900 13P (10 kHz). Standard ANSI (2003) measures (including bandwidth) were completed on all hearing aids using an Audioscan Verifit to ensure functioning within reported specifications.
HAT Selection
HAT devices from three different manufacturers were used and included a Phonak Inspiro transmitter, a Phonak MLxi receiver, an Oticon Amigo T30/T31 transmitter, Oticon Amigo R2 receiver, and a Comfort Audio Digi System that consisted of a DM10 transmitter, DT10 receiver, and DT05 programmer. These devices were cross-coupled to create five different HAT configurations: Phonak transmitter to Phonak receiver, Oticon transmitter to Oticon receiver, Phonak transmitter to Oticon receiver, Oticon transmitter to Phonak receiver, and Comfort Audio transmitter to Comfort Audio receiver.
Audiogram Selection
Pittman and Stelmachowicz (2003) characterized audio-metric configurations common to children with sensorineural hearing loss and found that sloping, u-shaped, and flat configurations occurred most frequently. Therefore, each hearing aid was programmed for three different audiometric configurations that varied in their high-frequency audibility and are common to children with sensorineural hearing loss. As shown in Figure 1, Audio-gram A represents normal-hearing sloping to a profound sensorineural hearing loss, Audiogram B represents a moderately severe flat sensorineural hearing loss, and Audiogram C represents a mild flat sensorineural hearing loss.
Figure 1.
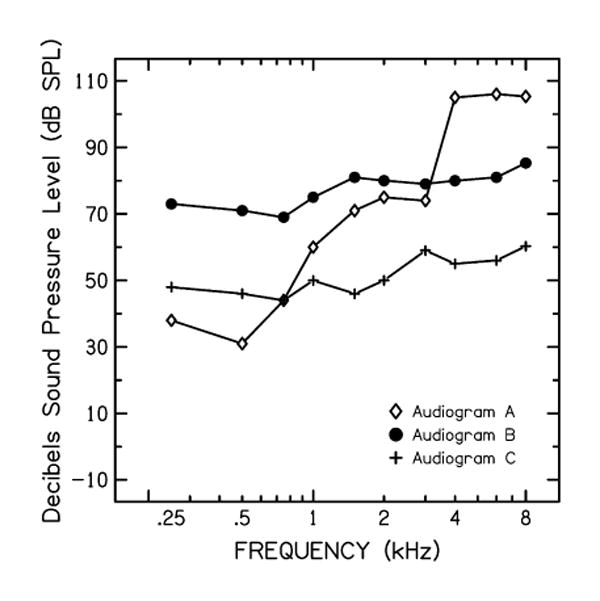
The three audiometric configurations programmed into each hearing aid in dB SPL.
Setup
All measurements were collected in a sound booth on a KEMAR. The right microphone connection on the back of KEMAR was connected to a GRAS Sound & Vibration Power Module Type 12AR. The output of the power source was connected to a microphone input on a Really Nice Preamp by FMR Audio. The output from the preamplifier was then connected to a Lynx soundcard, which allowed for monitoring of stimulus presentation and ambient room noise. The preamplifier gain was set to 12 dB for all measurements with a hearing aid and/or HAT device and 42 dB for measurements without a hearing aid. This ensured that the signals recorded from KEMAR were not peak-clipped. An International Speech Test Signal (ISTS; Holube et al, 2010) was equalized to a level of 62 dB SPL, and a short speech token (/asa/, Stelmachowicz et al, 2010) and broadband noise (BBN) stimuli were equalized to the ISTS. Figure 2 shows the spectra of each stimulus.
Figure 2.
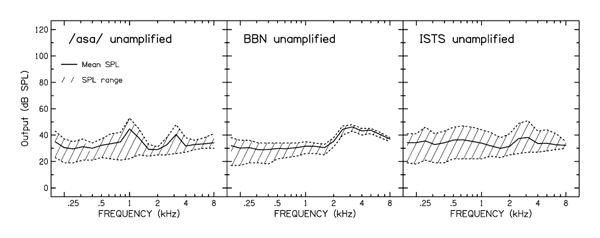
The unamplified spectrum of the /asa/ (left), BBN (middle), and ISTS (right) inputs.
Hearing Aid
The KEMAR was placed in a chair at a calibrated position 39 inches from a Studiophile BX8A loudspeaker at 0° azimuth. The loudspeaker level was calibrated and fixed at a position that delivered the ISTS stimulus at a level of 62 dB SPL when measured with a sound level meter at KEMAR's right ear.
Hearing Aid plus HAT
For the hearing aid plus HAT measurements, KEMAR was positioned according to the AAA HAT Clinical Verification Guidelines (2011) such that the ISTS was measured on a sound level meter to be 65 dB SPL at ear-level and 80 dB SPL at the input to the HAT microphone. The final calibrated position used was KEMAR at 87 inches from the middle of the loudspeaker and the HAT microphone placed on a stand 12 inches from the loudspeaker.
Procedures
Aided Measurements
All hearing aid and hearing aid plus HAT responses were measured with three stimuli: the ISTS, BBN, and an isolated /asa/ syllable spoken by a female speaker. The ISTS is a speech signal that is shaped according to the Long-Term Average Speech Spectrum (LTASS) and features a passage read by a female speaker in six different languages. It was used to estimate the maximum audible frequency of each device when the input was speech. The short speech token (/asa/) was recorded from a female speaker for Stelmachowicz et al (2010). The /asa/ was used to examine the short-term audibility of the high-frequency fricative /s/ when spoken by a female. The ISTS and /asa/ were specifically chosen to determine if signal duration affected estimates of high-frequency audibility. The BBN stimulus consisted of a 10 sec sample of white noise. As white noise consists of equal energy at all frequencies, it was used to obtain a theoretical maximum audible frequency of each device without the high-frequency roll-off seen in speech. A custom computer program (HARL Analysis Suite) was used to record responses from KEMAR. Stimulus presentation, stimulus recording, and ambient room noise were monitored on a Lynx scene mixer.
Hearing Aid
A NOAH Link was used to connect all hearing aids to their respective manufacturer's software for programming. A patient age of 36 mo was entered into NOAH, and all hearing aids were programmed using Desired Sensation Level v5.0 targets (Scollie et al, 2005). For all hearing aids, an occluded earmold setting was selected, noise reduction features were disabled, and frequency-lowering technology was deactivated on hearing aids that use this signal processing. With an Audioscan Verifit system, soft (50 dB SPL) and average (60 dB SPL) speech signals were presented to each hearing aid for each audiogram using Desired Sensation Level-Child targets and an age of 36 mo. Targets were matched within ±3 dB for 0.5, 1, 2, and 4 kHz at both input levels. Additionally, targets were matched within ±3 dB at 6 kHz for Audiograms B and C and were matched as closely as possible for Audiogram A as allowed by the steeply sloping configuration. The maximum audible frequency, as defined by the highest point where the LTASS intersected the audiogram, was recorded for each audiogram and hearing aid combination from the Audioscan Verifit.
Next, each hearing aid was coupled to KEMAR's right ear using a GRAS Sound & Vibration Canal Extension Adaptor for 2-mm internal diameter tubing (size 13). All three stimuli were presented via the loudspeaker and were recorded using custom software (HARL Analysis Suite) for each hearing aid programmed with each audiogram. The maximum audible frequency from each KEMAR recording was obtained by plotting the output data using a customized computer program (PLT; Neely, 2008) and finding the highest frequency where the average response line intersected with the audiogram. Before the initiation of any data collection, a calibration tone was presented through the loudspeaker, and the reading on a volt meter was compared with that collected on the calibration day to ensure proper setup.
To account for the size differences between the coupler in KEMAR and the 2-cc coupler with the pediatric age entered into the Verifit for programming, we added the following correction factors to each response before data analysis: +3 dB at 1 kHz, +4 dB at 3 kHz, and +3 dB at 6 kHz. These values were obtained from the acoustic transfer function in the KEMAR manual.
Hearing Aid plus HAT
Each HAT configuration was coupled to the Oticon Safari BTE hearing aid that was used during the hearing aid analysis and was programmed to Audiogram C. The Oticon Safari BTE and Audiogram C were chosen for HAT investigation because this pairing provided the greatest maximum audible frequency from the hearing aid analysis and thus would provide the widest working bandwidth for the HAT condition. The same verification procedures used in the hearing aid conditions were also used for each HAT configuration. Additionally, AAA HAT Clinical Verification Guidelines (2011) were followed each time the Oticon Safari BTE was coupled to a new receiver and/or transmitter. As in the hearing aid conditions, all three stimuli were presented through the loudspeaker and visual inspection of the plotted output data were used to identify the maximum audible frequency for each stimulus. Data were collected for each system in (1) HAT-only mode and (2) HAT-plus-hearing-aid-microphone mode.
Results
Hearing Aid
Figure 3 details the average output from each hearing aid under each condition. The maximum audible frequency is the highest frequency where the audiogram intersects with the average output and is shown in Table 1. This value ranged from 3.6, 3.5, and 3.7 kHz to beyond 8 kHz for the ISTS, /asa/, and BBN stimuli, respectively. The upper limit of the ANSI bandwidth did not correlate with the measured maximum audible frequency for ISTS (r = 0.082, p = 0.702), /asa/ (r = 0.025, p = 0.908), or BBN (r = 0.221, p = 0.599). For Audiogram C, six of the seven hearing aids had a maximum audible frequency that exceeded 8 kHz, regardless of the stimulus. In this case, the maximum audible frequency for Audiogram C was constant for each stimulus, which violated the assumption of homogeneity of variance that is assumed for analyses of variance; therefore, that audiogram was excluded from further statistical analyses.
Figure 3.
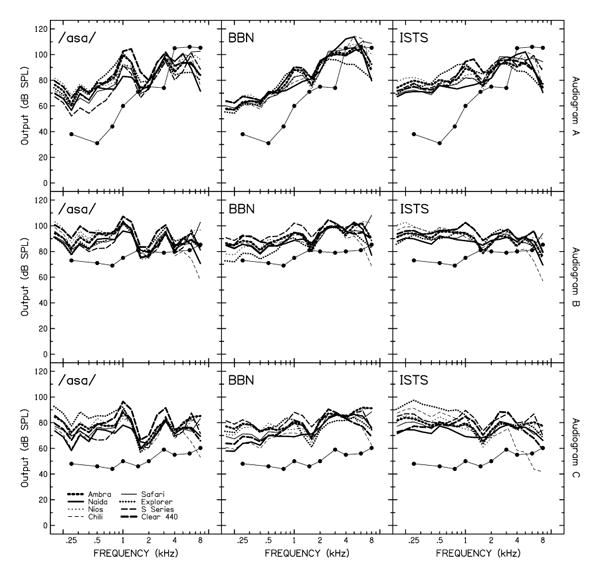
The average output in dB SPL from each hearing aid when measured with each audiogram and stimulus. The maximum audible frequency can be obtained by finding the highest point where the audiogram intersects with the average hearing aid output and drawing a vertical line.
Table 1. Recorded Maximum Audible Frequency (in kHz) from Each Hearing Aid under Each Condition.
| Hearing Aid | ISTS | /asa/ | BBN | Upper Limit of ANSI Bandwidth |
|---|---|---|---|---|
| Siemens Explorer 500 P | 5.1 | |||
| Audiogram A | 3.570 | 3.550 | 3.650 | |
| Audiogram B | 6.750 | 7.500 | 7.600 | |
| Audiogram C | 8.000+ | 8.000+ | 8.000+ | |
| Phonak Ambra Micro P | 5.5 | |||
| Audiogram A | 3.600 | 3.600 | 3.900 | |
| Audiogram B | 7.000 | 8.000 | 8.000+ | |
| Audiogram C | 8.000+ | 8.000+ | 8.000+ | |
| Oticon Chili SP IX | 6.5 | |||
| Audiogram A | 3.750 | 3.650 | 7.000 | |
| Audiogram B | 5.300 | 3.900 | 6.700 | |
| Audiogram C | 7.000 | 7.300 | 8.000 | |
| Starkey S Series IQ II | 6.6 | |||
| Audiogram A | 3.650 | 3.500 | 5.600 | |
| Audiogram B | 7.500 | 7.600 | 8.000 | |
| Audiogram C | 8.000+ | 8.000+ | 8.000+ | |
| Phonak Naida S IX SP | 6.9 | |||
| Audiogram A | 3.750 | 3.700 | 5.900 | |
| Audiogram B | 6.700 | 6.500 | 7.400 | |
| Audiogram C | 8.000+ | 8.000+ | 8.000+ | |
| Phonak Nios S H20 V | 7.1 | |||
| Audiogram A | 3.700 | 3.650 | 7.000 | |
| Audiogram B | 8.000+ | 8.000+ | 8.000+ | |
| Audiogram C | 8.000+ | 8.000+ | 8.000+ | |
| Widex Clear 440 | 7.2 | |||
| Audiogram A | 3.700 | 3.700 | 3.850 | |
| Audiogram B | 6.800 | 7.700 | 8.000+ | |
| Audiogram C | 7.700 | 8.000+ | 8.000+ | |
| Oticon Safari 900 13 P | 10 | |||
| Audiogram A | 3.750 | 3.750 | 5.000 | |
| Audiogram B | 8.000+ | 8.000+ | 8.000+ | |
| Audiogram C | 8.000+ | 8.000+ | 8.000+ |
A two-way analysis of variance was completed with audiogram (A versus B) and stimulus (ISTS versus /asa/ versus BBN versus ANSI) as repeated-measures factors. Because the ANSI measurement did not vary as a function of audiogram, the same values were used for Audiograms A and B for this outcome. The main effect of audiogram was significant [F(1,7) = 36.553, p < 0.001, ηp2 = 0.839], reflecting a higher maximum audible frequency with Audiogram B (6.995 kHz) than Audiogram A (4.855 kHz) on average (p = 0.001). The main effect of stimulus was also significant [F(3,21) = 6.64, p = 0.002, ηp2= 0.487]. Post hoc testing using Bonferroni adjustment indicated that the difference between the ISTS (5.345 kHz) and /asa/ (5.018 kHz) was not significant (p = 0.135), but that BBN (6.475 kHz, p = 0.011 for ISTS difference) and ANSI (6.862 kHz, p = 0.010 for ISTS difference) were significantly higher than either ISTS or /asa/. The two-way interaction between stimulus and audiogram was not significant.
To examine the relationship between the maximum audible frequency and stimulus type, we calculated the correlations between the measured maximum audible frequency for /asa/, BBN, and the ISTS and the upper limit of the ANSI bandwidth for each hearing aid and audiogram. The maximum audible frequency for the short-term speech stimulus /asa/ correlated with the maximum audible frequency for the ISTS (r = 0.975, p < 0.001). These results suggest that for the bandwidth of current hearing aids, the maximum audible frequency correlated across stimuli for the same hearing aid and audiogram. The short-term stimulus /asa/ provided nearly the same estimate of maximum audibility as the longer-duration ISTS stimulus.
Hearing Aid plus HAT
For the HAT systems, the maximum audible frequency was equivalent to the maximum audible frequency of the hearing aid for the same measurement configuration, with the exception of the Phonak-to-Phonak and Oticon-to-Phonak configurations. When measured in the HAT-only mode, both Phonak-to-Phonak and Oticon-to Phonak configurations imposed additional restrictions on the high-frequency audibility of the signal, which were not observed in the hearing aid alone. However, when the hearing aid microphones were enabled in conjunction with the HAT, the high-frequency audibility of the signal improved. Figure 4 illustrates the average responses observed in the HAT configurations.
Figure 4.
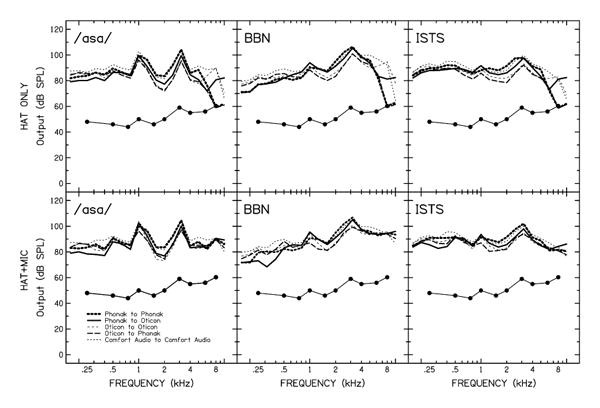
The average output in dB SPL from the HAT-only and HAT-plus-microphone conditions using the Oticon Safari hearing aid and Audiogram C.
Discussion
The purpose of this study was to evaluate the effects of degree of hearing loss and stimulus on the maximum audible frequency for different hearing aids and remote microphone HAT. As predicted, the maximum audible frequency decreased as the degree of hearing loss increased. The maximum audible frequency also depended on the type of stimulus used to measure the output of the hearing aid. Stimuli with the spectral characteristics of speech, which have decreasing energy as frequency increases, resulted in a lower maximum audible frequency than broadband stimuli. The maximum audible frequency of the signal through a hearing aid coupled to a remote microphone HAT system was always equal to or less than the highest audible frequency of the hearing aid by itself, as predicted. A single estimate of the upper limit of bandwidth, as provided in ANSI specified measurements, did not reflect the variability in achievable high-frequency audibility seen across conditions.
The results of this study suggest that achievable high-frequency audibility is dependent on the listener's degree of hearing loss, output of the hearing aid across frequencies, and the signal used to measure that output. Through manipulation of these three variables, the attainable maximum audible frequency varied greatly relative to the upper limit of bandwidth specified in the ANSI standard. Importantly, the ANSI standard was never intended to reflect the bandwidth that would be audible for an individual listener with hearing loss; instead, the ANSI bandwidth specification was intended as a quality-control mechanism. Completing real-ear probe-microphone measurements or real-ear-to-coupler difference measurements will help estimate the highest frequency of the LTASS that is audible for an individual listener with hearing loss. Verification will ensure that important high-frequency energy is audible and will provide information that can be used to determine when frequency-lowering technology would be appropriate. The AAA Clinical Practice Guidelines (2013) details currently recommended practices for pediatric amplification verification.
However, estimates of high-frequency audibility between 2–8 kHz can be restricted in real-ear measurements because of the relationship of the probe tube location and the production of standing waves (Dirks and Kincaid, 1987). As a result, current verification approaches may limit the high-frequency estimation of an individual's maximum audible frequency. Such limitations illustrate the need for further research to help ensure proper verification of high-frequency audibility for children with hearing loss.
When comparing the upper limit of ANSI bandwidth with that obtained by visually inspecting the maximum audible frequency, ANSI overestimated the maximum audible frequency for all hearing aids programmed with Audiogram A when measured with the ISTS. Interestingly, the greatest overestimation (6.250 kHz) occurred for the hearing aid that had the widest advertised bandwidth (10 kHz). Although that particular hearing aid had the widest ANSI bandwidth, two other hearing aids achieved the same maximum audible frequency when measured with the ISTS, despite having a specified upper limit of ANSI bandwidth approximately 3.5 and 3.1 kHz less. For Audiogram B, the maximum audible frequency was overestimated for four of eight hearing aids in the ISTS condition. The maximum audible frequency for Audiogram C was underestimated with respect to the upper limit of ANSI bandwidth for all hearing aids when measured with the ISTS. It was excluded from further statistical analysis because of a lack of variability. The use of a short-term speech stimulus, /asa/ spoken by a female, resulted in a similar estimate of maximum audible frequency compared with the longer-duration ISTS. This observation suggests that as long as the stimuli contain energy at higher frequencies, the maximum audible frequency provides a consistent estimate of the achievable high-frequency audibility for stimuli that differ in duration.
Although these findings are consistent with the hypothesis, the influence of degree of high-frequency hearing loss on the relationship of the upper limit of ANSI bandwidth to an individual's maximum audible frequency cannot be resolved entirely because of the limited number of audiometric thresholds included in this analysis. That the upper limit of ANSI bandwidth did not correlate with the maximum audible frequency of the ISTS conditions clearly suggests that manufacturer-reported bandwidth should be interpreted with caution for clinical purposes. A greater maximum audible frequency was observed in the flat, moderately severe hearing loss configuration (Audiogram B) than in the normal sloping-to-profound configuration (Audiogram A). At best, Audiogram A provided a maximum audible frequency of 3.750 kHz, which would not be sufficient to provide consistent access to /s/, even for male speakers. Even if it was possible to provide enough high-frequency amplification in this case, acoustic speech cues may be too distorted to successfully contribute to speech recognition. In that case, the use of appropriately prescribed frequency-lowering technology may be considered. Wolfe et al (2010) demonstrated improved audibility in quiet for /s/ and /z/ for children with moderate to moderately severe hearing loss when nonlinear frequency compression was activated. Furthermore, after 6 mo of hearing aid use, children fitted with this technology maintained performance or showed additional gains in speech recognition (Wolfe et al, 2011).
Although appropriately prescribed frequency-lowering technology may help overcome the pitfalls of insufficient bandwidth, not all hearing aids possess this feature, including the hearing aid used in this study that had the highest advertised upper limit of ANSI bandwidth (10 kHz). In situations such as this, the audiologist must be aware of the discrepancy between ANSI bandwidth and audible bandwidth in order to select the device that will provide the patient with consistent access to all speech sounds to promote typical speech and language development.
The addition of a HAT system provided a maximum audible frequency that was equivalent to that measured in the hearing aid–only analysis in three of the five conditions, consistent with the assumption that the achievable high-frequency audibility of the HAT is dependent on that of the hearing aid, when presented with equal inputs. The cross-coupling of different manufacturers' transmitters and receivers was completed in two different scenarios, and a decrease in the maximum audible frequency was observed in one instance. Interestingly, the maximum audible frequency was reduced by 0.2– 0.3 kHz in both pairings where the Phonak MLxi receiver was used without the hearing aid microphones enabled, suggesting that this receiver may impose additional bandwidth restrictions on the frequency spectrum of the signal. When input was delivered to both the hearing aid microphones and the HAT transmitter, the maximum audible frequency recovered to that of the other pairings. These results suggest that mixing various companies' transmitters and receivers may have limited effects on an individual's maximum audible frequency, when the hearing aid and HAT microphones are activated simultaneously.
Study Limitations
The current study did not attempt to estimate a maximum audible frequency above 8 kHz, as that is typically the highest frequency tested audiometrically. This condition subsequently limited the estimation of high-frequency audibility above 8 kHz and did not allow for any potential restrictions that may have occurred above this point in the HAT configurations, as well as with Audiogram C in the hearing aid analysis, to be seen.
The current study assessed the effects of maximum audible frequency on only one hearing aid programmed to one hearing loss when coupled with various HAT devices. Although these results showed an unaffected maximum audible frequency in three of five conditions for the configuration used, it is unknown how the other hearing aids and audiometric configurations would have performed when paired with the various HAT devices. The AAA HAT Clinical Verification Guidelines (2011) recommend first completing electroacoustic verification on a patient's hearing aid to ensure appropriate high-frequency audibility and then complete electroacoustic verification for every HAT configuration being considered to ensure that the maximum audible frequency is not compromised during the pairing. Furthermore, to better evaluate the effects of cross-coupling different manufacturers' transmitters and receivers on the maximum audible frequency, future studies should incorporate several other devices to address this issue more completely.
During the hearing aid and HAT analyses, this study assumed that audibility of the LTASS is necessary to support perception of high-frequency speech information. However, given the high crest factor of high-frequency speech sounds, audibility of only the spectral peaks may be sufficient in some instances for perception, even if the LTASS is inaudible. Thus, future studies should incorporate speech perception outcomes to examine the effects of bandwidth variations on perception.
Clinical Implications.
The present study supports the premise that the ANSI bandwidth standard was developed to be used for specification purposes for quality control only; it was not intended to be generalizable to all individuals with hearing loss. Instead of relying on this measure to assume maximum high-frequency audibility, clinicians must consider a patient's audiometric configuration and the impact it will have on high-frequency audibility.
The maximum audible frequency is dependent and predictable based on the degree of hearing loss and input stimulus bandwidth.
In the current study, the upper limit of ANSI bandwidth was not related to the maximum audible frequency for any of the three stimuli used.
Remote-microphone HAT may impose additional high-frequency audibility restrictions on the input signals not observed in the hearing aid alone.
Clinicians can quickly and easily estimate the maximum audible frequency by visually inspecting the frequency where the speech spectrum intersects the audiogram in the high frequencies. This step can then assist clinicians in making decisions regarding device selection and in determining whether frequency-lowering technology should be used for an individual patient.
Abbreviations
- AAA
American Academy of Audiology
- ANSI
American National Standards Institute
- BBN
broadband noise
- BTE
behind-the-ear
- HAT
hearing assistance technology
- ISTS
International Speech Test Signal
- KEMAR
Knowles Electronic Manikin for Acoustic Research
- LTASS
Long-Term Average Speech Spectrum
- SPL
sound pressure level
References
- American Academy of Audiology (AAA) Clinical Practice Guidelines: Pediatric Amplification. 2013. [Google Scholar]
- American Academy of Audiology (AAA) Clinical Practice Guidelines: Remote Microphone Hearing Assistance Technologies for Children and Youth from Birth to 21 Years. 2011. [Google Scholar]
- American National Standards Institute (ANSI) Specification of Hearing Aid characteristics, Part 6: Recommended Measurements, Specifications, and Tolerances. ANSI S3.22. New York, NY: ANSI; 2003. [Google Scholar]
- Byrne D, Noble W. Optimizing sound localization with hearing aids. Trends Ampl. 1998;3(2):51–73. doi: 10.1177/108471389800300202. [DOI] [PMC free article] [PubMed] [Google Scholar]
- Dirks DD, Kincaid GE. Basic acoustic considerations of ear canal probe measurements. Ear Hear. 1987;8(5, Suppl):60S–67S. doi: 10.1097/00003446-198710001-00002. [DOI] [PubMed] [Google Scholar]
- Holube I, Fredelake S, Vlaming M, Kollmeier B. Development and analysis of an international speech test signal (ISTS) Int J Audiol. 2010;49(12):891–903. doi: 10.3109/14992027.2010.506889. [DOI] [PubMed] [Google Scholar]
- Mines MA, Hanson BF, Shoup JE. Frequency of occurrence of phonemes in conversational English. Lang Speech. 1978;21(3):221–241. doi: 10.1177/002383097802100302. [DOI] [PubMed] [Google Scholar]
- Moeller MP, Hoover B, Putman C, et al. Vocalizations of infants with hearing loss compared with infants with normal hearing: Part I—phonetic development. Ear Hear. 2007;28(5):605–627. doi: 10.1097/AUD.0b013e31812564ab. [DOI] [PubMed] [Google Scholar]
- Moore BCJ, Tan CT. Perceived naturalness of spectrally distorted speech and music. J Acoust Soc Am. 2003;114(1):408–419. doi: 10.1121/1.1577552. [DOI] [PubMed] [Google Scholar]
- Neely ST. PLT. Boys Town National Research Hospital. 2008 http://audres.org/rc/plt/
- Peeters H, Lau CC, Kuk F. Speech-in-noise potential of hearing aids with extended bandwidth. Hear Rev. 2011;18(3):28–36. [Google Scholar]
- Pittman AL. Short-term word-learning rate in children with normal hearing and children with hearing loss in limited and extended high-frequency bandwidths. J Speech Lang Hear Res. 2008;51(3):785–797. doi: 10.1044/1092-4388(2008/056). [DOI] [PMC free article] [PubMed] [Google Scholar]
- Pittman AL, Stelmachowicz PG. Hearing loss in children and adults: audiometric configuration, asymmetry, and progression. Ear Hear. 2003;24(3):198–205. doi: 10.1097/01.AUD.0000069226.22983.80. [DOI] [PMC free article] [PubMed] [Google Scholar]
- Ricketts TA, Dittberner AB, Johnson EE. High-frequency amplification and sound quality in listeners with normal through moderate hearing loss. J Speech Lang Hear Res. 2008;51(1):160–172. doi: 10.1044/1092-4388(2008/012). [DOI] [PubMed] [Google Scholar]
- Scollie S, Seewald R, Cornelisse L, et al. The Desired Sensation Level multistage input/output algorithm. Trends Amplif. 2005;9(4):159–197. doi: 10.1177/108471380500900403. [DOI] [PMC free article] [PubMed] [Google Scholar]
- Stelmachowicz P, Lewis D, Hoover B, Nishi K, McCreery R, Woods W. Effects of digital noise reduction on speech perception for children with hearing loss. Ear Hear. 2010;31(3):345–355. doi: 10.1097/AUD.0b013e3181cda9ce. [DOI] [PMC free article] [PubMed] [Google Scholar]
- Stelmachowicz PG, Pittman AL, Hoover BM, Lewis DE. Effect of stimulus bandwidth on the perception of /s/ in normal-and hearing-impaired children and adults. J Acoust Soc Am. 2001;110(4):2183–2190. doi: 10.1121/1.1400757. [DOI] [PubMed] [Google Scholar]
- Wolfe J, John A, Schafer E, Nyffeler M, Boretzki M, Caraway T. Evaluation of nonlinear frequency compression for school-age children with moderate to moderately severe hearing loss. J Am Acad Audiol. 2010;21(10):618–628. doi: 10.3766/jaaa.21.10.2. [DOI] [PubMed] [Google Scholar]
- Wolfe J, John A, Schafer E, et al. Long-term effects of nonlinear frequency compression for children with moderate hearing loss. Int J Audiol. 2011;50(6):396–404. doi: 10.3109/14992027.2010.551788. [DOI] [PubMed] [Google Scholar]