

Abstract
Introduction
The accumulation of advanced glycation end-products (AGEs) in bone has been suggested to adversely affect the fracture resistance of bone with aging, diabetes, and pharmacological treatments. The formation of AGEs increases crosslinking in the organic matrix of bone but it is unknown how elevated levels of AGEs affect the mechanisms of fracture resistance such as microdamage formation.
Methods
Human tibial cancellous bone cores were subjected to non-enzymatic glycation (NEG) by in vitro ribosylation and were mechanically loaded to pre- (0.6%) and post- (1.1%) yield apparent level strains. Loaded specimens were stained with lead–uranyl acetate and subjected to microCT-based 3D quantification and characterization of microdamage as either diffuse damage and linear microcracks. Damaged volume per bone volume (DV/BV) and damaged surface per damaged volume (DS/DV) ratios were used to quantify the volume and morphology of the detected microdamage, respectively.
Results
In vitro ribosylation increased the microdamage morphology parameter (DS/DV) under both pre-(p<0.05; +51%) and post-yield loading (p<0.001; +38%), indicating that the alteration of bone matrix by NEG caused the formation of crack-like microdamage morphologies. Under post-yield loading, the NEG-mediated increase in DS/DV was coupled with the reductions in microdamage formation (DV/BV; p<0.001) and toughness (p<0.001).
Discussion
Using a novel microCT technique to characterize and quantify microdamage, this study shows that the accumulation of AGEs in the bone matrix significantly alters the quantity and morphology of microdamage production and results in reduced fracture resistance.
Keywords: Non-enzymatic glycation, Advanced glycation end-products, Microdamage, microCT, Biomechanics, Bone, Diabetes
Introduction
Microdamage can form in vivo with loading from physiological activities [1–3]. The formation of microdamage reflects the quality of the bone matrix and its ability to resist fracture [4]. Mechanically, the formation of microdamage allows the incremental dissipation of energy, and it is a critical mechanism in bone to resist the propagation of catastrophic fractures [4–6]. Different morphologies of microdamage affect the fracture resistance of bone differently. For example, the formation of linear microcracks, which appear as singular cracks with clearly delineated edges [3], is associated with a quadratic rate of modulus loss. In contrast, the formation of diffuse damage, which appear optically as pooled staining [1], is associated with a more gradual linear loss of modulus [2,6]. With aging, the alterations in bone quantity and quality [7] culminate in bone's reduced ability to form diffuse damage, leading to the increased formation of linear microcracks and, consequently, increased fragility [8].
Non-enzymatic glycation (NEG) has been demonstrated to reduce bone quality by altering the organic components of bone. NEG post-translationally modifies amino groups on proteins in the organic matrix to create molecular crosslinks known as advanced glycation end-products (AGEs) [9]. The accumulation of AGEs has been observed in bone with aging [10], diabetes [11,12], and pharmacological treatments [13], and is associated with a significant reduction in fracture resistance [14-16]. NEG adversely stiffens the organic matrix of bone [16] and manifests itself as decreased ductility [17] and post-yield deformation at the tissue level [14,16]. Because microcracking in bone is related to fracture resistance [4–6,8], it was hypothesized that the NEG of cancellous bone may alter the both the quantity and morphology of microdamage production during pre-yield and post-yield loading.
To test the hypothesis, multiple cancellous bone cores were taken from a single donor. The cancellous bone cores were subjected to an in vitro ribosylation procedure to increase AGEs [16], mechanically loaded to either pre- or post-yield apparent level strains, and subjected to a lead–uranyl acetate staining technique [18] to quantify 3-dimensional microdamage by microCT.
Although traditional means of microdamage assessment by optical evaluation of serial sections allow distinct 2-dimensional characterization of microdamage morphologies [1,3], extending these analyses to 3-dimensions poses additional challenges, particularly in the increased morphological complexities and spatial biases. For example, a microcrack viewed under one plane could be seen as diffuse damage in an orthogonal plane [19] (Fig. 1). In order to overcome some of these challenges, a novel parameter is proposed, namely damaged surface area per damaged volume (DS/DV), to effectively characterize microdamage as either linear microcracks or diffuse damage.
Fig. 1.
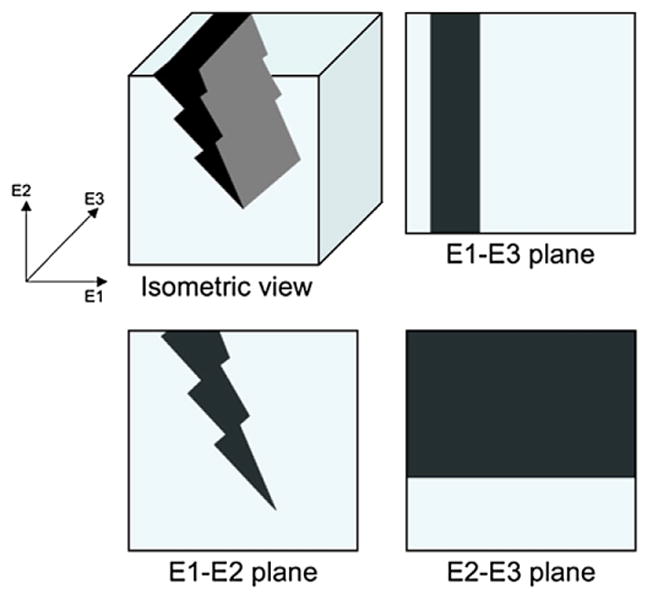
A schematic for microdamage in isometric view and in orthogonal planes. A linear microcrack, as viewed in 3-dimensions, can appear differently in different orthogonal planes. For example, the histological observation of the E1-E2 plane will show that this is a single microcrack, while observations at the E1–E3 and E2–E3 planes may be interpreted as diffuse damage that extensively spans a region. Even for a well-defined 3D microdamage morphology, the orientation can dictate whether it is classified as a microcrack or diffuse damage. Thus, a spatial quantitative metric is necessary to effectively characterize whether the microdamage is diffuse-like or crack-like.
Methods
Specimen preparation
Thirty-three cylindrical cancellous bone cores with an 8 mm diameter and approximately 8–10 mm in length were harvested from the tibial plateaus of a single human male donor of 64 years old, with no history of metabolic diseases, using a drill press and a modified jig. The cancellous bone cores were taken along the principal trabeculae orientations as determined by a X-Ray radiograph. The cancellous bone cores were cut into 8 mm segments using the ISOMET 11-1180 low-speed diamond blade saw (Buehler Corp., Lake Bluff, IL). Using a caliper the length and diameter were measured at thirty-degree rotations and averaged for each core.
One bone core was stained without loading as a negative control for the lead–uranyl acetate stain. The 32 remaining cores underwent a 7-day incubation period at 37 °C in either an in vitro ribosylation solution for NEG (16 cores) or a control solution (16 cores) to increase crosslinks in the physiological range corresponding to 2–3 decades of in vivo aging [16]. The solutions contained 0.6 M ribose, zwitterionic buffers (30 mM HEPES) and protease inhibitors (25 mM ε-amino-n-caproic acid, 5 mM benzamidine, 10 mM N-ethylmaleimide) in Hanks buffer. The control solution has the same composition as the ribosylation solution but was without ribose. During the incubation process, the pH of the solutions was monitored using an electronic pH meter every 24 h and rigorously maintained between 7.3 and 7.6 using aliquots of NaOH and HCl.
Mechanical testing
After the incubation, unconfined compression testing of control and ribosylated cancellous bone cores was conducted using the MTS Bionix 858 hydraulic servo mechanical testing machine in constant flow of saline at 37°C (MTS, Eden Prairie, MN). Each specimen was glued to brass end-caps using cyanoacrylate glue and loaded at 833 microstrains per second to either 0.6% (pre-yield; 8 cores from control and 8 from ribosylated) or 1.1% (post-yield; 8 cores from control and 8 from ribosylated) apparent-level strains. These strain values were determined from preliminary studies and were found to be appropriate for this particular donor and anatomical location. Displacement was obtained from an extensometer that measured the relative displacement of the end-caps. The apparent-level elastic modulus was computed from a linear regression of the initial linear portion of the stress–strain curve; and energy dissipation was computed as the area under the stress–strain curve.
Microdamage analyses
The mechanically tested cores were stained for microdamage in a solution of 70% acetone containing a lead–uranyl acetate complex for the staining of microdamage as previously described [18]. After staining, the bone cores were scanned by microCT (Scanco VivaCT40, Switzerland) at a resolution of 10.5 μm to determine the magnitude of microdamage accumulation due to ex vivo loading. Microdamage measurements were obtained from thresholded cylindrical volumes having a diameter of 4 mm and a length 4 mm, at least 2 mm from away from all cutting surfaces. Optimum threshold values for bone and lead-uranyl sulfide were determined from their respective attenuation constants. The ratios of damaged volume to bone volume (DV/BV), a measure of microdamage quantity, and damaged surface to damaged volume (DS/DV), an indicator of microdamage morphology, were used to characterize microdamage. The stained unloaded control bone resulted in a DV/BV value of less than 0.005, confirming the specificity of the stain for loading-induced microdamage [18].
Linear microcracks are typically defined histologically as a sharply delineated crack, while diffuse damage typically appears as a pool of staining [1,6,8]. Under such observations, it can be generalized that the perimeter to area ratio would be higher for the microcrack than for the diffuse damage. Extrapolating this ratio into 3-dimensions suggest that the damaged surface area per damage ratio (DS/DV) would be comparatively higher for the microcrack than for the diffuse damage. A mathematical derivation that confirms these observations is provided in the appendix.
Statistical analyses
The effects of ribosylation on microdamage formation (DV/BV) and morphology (DS/DV) within the same strain levels were determined using t-tests. Chi-square tests were used to determine whether there are differences in the binned frequency distribution of the damage magnitude (DV/BV) between control and ribosylated groups at the same strain levels. Statistical analyses were done using SigmaSTAT 3.0 (SPSS).
Results
BV/TV of the bone cores between the ribosylated and controls were statistically indistinguishable (p=0.82; t-test). There were no differences due to ribosylation in the apparent elastic modulus at either the 0.6% pre-yield strain (p=0.65; t-test) or 1.1% post-yield strain levels (p=0.76; t-test) (Fig. 2A). Energy dissipation (or toughness) were not significantly different between the ribosylated group and the control group at the 0.6% pre-yield strain (p=0.32; t-test); however, nearly a 30% reduction in energy dissipation was observed between ribosylated and control when the samples were loaded to the 1.1% post-yield strain (p<0.001; t-test) (Fig. 2B).
Fig. 2.

Apparent level behavior of cancellous bone cores under unconfined compression loading. [A] There were no differences in the apparent elastic modulus of the cancellous bone cores between control and ribosylated groups at the 0.6% (p=0.65; t-test) and 1.1% (p=0.76; t-test) strain levels. [B] A significant difference in energy dissipation was observed between the control and ribosylated groups at the 1.1% (p<0.001; t-test) but not at the 0.6% strain levels (p=0.32; t-test). Error bars denote the standard deviations.
The ribosylated group sustained more microdamage (DV/BV) compared to the control group at the 0.6% pre-yield strain (p=0.05; t-test; Fig. 3). However, loading to 1.1% post-yield strain resulted in higher microdamage formation in the control group than in the ribosylated group (p<0.001; t-test; Fig. 3). Ribosylation also increased microdamage DS/DV under both pre- (p<0.05) and post-yield loading (p<0.001), suggesting that NEG increased the formation of crack-like microdamage morphologies (Fig. 4).
Fig. 3.
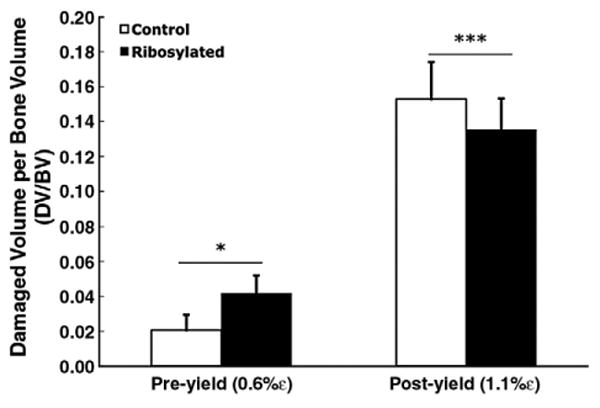
During pre-yield loading, the ribosylated group incurred a 53% higher microdamage magnitude (DV/BV) than the control group (p=0.05; t-test). In contrast, during post-yield loading, the control group incurred 18.6% higher DV/BV (p<0.001; t-test). Error bars denote the standard deviations.
Fig. 4.
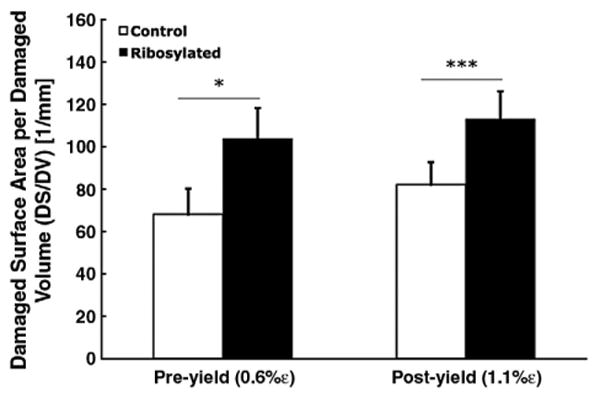
DS/DV is a quantitative measure of microdamage morphology. Non-enzymatic glycation by in vitro ribosylation shifts the microdamage morphology towards a higher DS/DV in both pre-yield (p<0.05; t-test) and post-yield strains (p<0.001; t-test), suggesting that NEG alters the morphology of microdamage in bone. Error bars denote the standard deviations.
Microdamage sizes sorted by DV/BV were tabulated into a histogram showing the respective frequencies of occurrence between control and ribosylated groups under pre-yield and post-yield loading. The frequency of microdamage DV/BV was similar between control and ribosylated groups under pre-yield loading (p=0.13; Chi-Square test) and but was significantly different under post-yield loading (p<0.05; Chi-Square test) (Fig. 5).
Fig. 5.
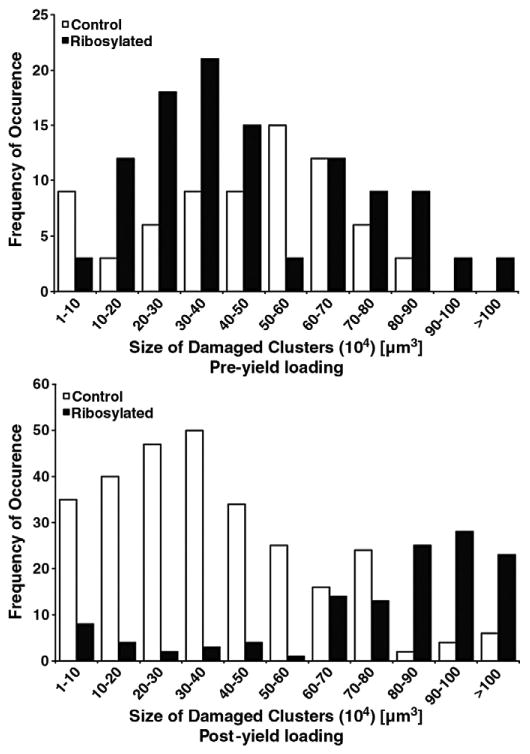
Histogram showing the frequencies of microdamage volumes (DV/BV) in the all tested bone cores. The X-axis provides the ranges in which the DV/BV values were binned. Y-axis provides the frequency of each bin (i.e. specific microdamage volumes). The distribution of microdamage sizes formed under loading differs between the control and ribosylated groups under pre-yield (TOP; p=0.13; Chi-Square test) and post-yield (BOTTOM; p<0.05; Chi-Square test) loading.
Discussion
Using the new technique for microdamage analysis presented here, a 3-dimensional measurement and quantitative description of spatial morphology was obtained from microCT data in terms of the ratios of damaged volume per bone volume (DV/BV) and damaged surface area per damaged volume (DS/DV). These two parameters can quantify microdamage in a 3-dimensional manner and eliminate spatial biases that may be introduced in two-dimensional serial sections. DV/BV and DS/DV allow the direct quantification of microdamage volume and morphologies, respectively. It has been shown that in 3-dimensions, microdamage can be interpreted both as diffuse damage and linear microcracks from different orthogonal views [19]. The traditional histomorphometric strategies towards the characterization of microdamage morphologies are dependent on the orthogonal orientation of the evaluation plane (Fig. 1). Independently of orientation, however, microcracks have a larger surface to volume ratio than diffuse damage, and high values of DS/DV reflect a higher composition of crack-like morphologies while low values of DS/DV reflect a larger ratio of diffuse-like morphologies (Fig. 6). DS/DV can thus provide a relative quantitative assessment of crack-like or diffuse-like microdamage morphologies independently of damage size and orientation. Moreover, the robustness of this parameter requires no a priori assumptions of distribution nor volume, and DS/DV allows the direct characterization of a single segmented microdamage patch, or multiple microdamage clusters over a whole volume of bone to provide an averaged value.
Fig. 6.

Microdamage morphology can be distinctly quantified using the DS/DV parameter. [LEFT] A crack-like appearance is characterized by a higher DS/DV (DS/DV: 122.10/mm; DV/BV: 0.026). [LEFT] A diffuse-like appearance is manifested by lower DS/DV values (DS/DV: 55.10/mm; DV/BV: 0.14). Both cubic volumes are 0.5 mm on each side, and darkened regions are stain-labeled damaged regions.
Lead–uranyl acetate staining is a non-specific stain that diffuses into the void spaces in bone [20,21]. The localization of lead-uranyl sulfide therefore indicates voids and physical spaces created by physical damage in bone resulting from material level yielding. Moreover, the lead–uranyl acetate has been shown to diffuse into damage process zones, in which no visually observable physical void has been created but the bone material has begun to yield and toughen in order to resist the propagation of a defect [20]. Consequently, localization of microdamage stains within the bone tissue marks the occurrence of local yielding associated with either a physical separation, i.e. a microcrack, or the formation of damage process zone [20,22,23].
The unique trabecular architecture of cancellous bone creates a wide range of local strains within its microstructure during apparent loading in the elastic region, some of which can exceed the proportional limit at the material level. This results in localized yielding and the subsequent formation of microdamage [18,22,23]. Consistent with this concept, mechanical loading at pre-yield strain levels in both the control and ribosylated groups resulted in the formation of microdamage as marked by DV/BV (Fig. 4).
Previous works have shown that non-enzymatic glycation (NEG) exerts its effects on the biomechanical behavior of bone through a stiffening of the organic matrix [14,16]. Although the elastic properties of bone are not affected, this stiffening reduces the organic matrix's ability to reversibly dissipate energy [16], which is manifested as reduced post-yield material properties [14–16] and a subsequent loss in bone's material-level toughening. The results obtained here confirm that NEG does not affect the elastic modulus and elastic (pre-yield) energy dissipation. Despite the lack of differences on the pre-yield mechanical behavior, NEG increased microdamage formation even at the pre-yield strains, demonstrating that the local material has a reduced ability to dissipate energy. Additionally, pre-yield microdamage in the ribosylated (103.8/mm±14.4/mm) had higher DS/DV than the control group (68.1/mm±12.1/mm). The increase in DS/DV suggests a shift in microdamage morphology to crack-like from diffuse-like. Taken together, increased microdamage formation (higher DV/BV) and more crack-like microdamage (higher DS/DV) indicate that more and longer microcracks are being formed. Thus the loss of toughening due to NEG may reduce intrinsic or extrinsic crack resistance mechanisms to cause increased propagation of cracks [24,25].
The adverse mechanical consequences of NEG were primarily manifested as reduced mechanisms of post-yield energy dissipation. In contrast to the increased DV/BV in the ribosylated group under pre-yield strain, the control group under post-yield strain incurred increased microdamage formation as measured by DV/BV. Furthermore the control group had a lower post-yield DS/DV than the ribosylated group and consequently accumulated more diffuse-like than crack-like morphology. Because diffuse damage is effective in resisting fracture through incrementally dissipating energy over a larger volume, bone in the control group dissipated more energy through the production of diffuse damage with high DV/BV and lower DS/DV. In contrast, ribosylated bone was less efficient at resisting fracture and forms crack-like morphologies with lower DV/BV and higher DS/DV. The energy dissipation further demonstrates that NEG reduces the amount of energy dissipated by each of the damaged elements. Our results show that the poor fracture properties of ribosylated bone are a consequence of its decreased ability to form damage in the post-yield loading regime. The biomechanical effects of in vitro ribosylation studies observed here are consistent with previous in vivo studies, showing reduced fracture resistance of bone with an increase in non-enzymatic glycation [15,16].
Morphologies of microdamage also play an important role in bone's ability to resist fracture. Specifically, the formation of linear microcracks is associated with reduced fatigue life loss at the tissue level compared to that of microdamage diffuse damage [2,6]. The decreased ability of aging bone to compartmentalize damage efficiently may be a result of the decline in matrix quality. In particular, young bone has been observed to form more diffuse damage than linear microcracks under loading, while old bone was observed to form more linear microcracks than diffuse damage under loading [6,23,24]. Within the context of this study, the modification of bone by non-enzymatic glycation simulates age-related changes in bone's organic matrix [10,15,16] and thus loading to pre-yield apparent level strains resulted in the formation of more crack-like microdamage morphologies in the ribosylated group than the control group, similar to trends exhibited in loaded young versus old bone [6].
The frequencies of microdamage DV/BV were markedly different between the ribosylated and control group under post-yielding (Fig. 5). The greater occurrence of larger clusters of microdamage in the ribosylated bone suggest that rather than dissipating energy equally over the entire volume, some local regions are undergoing extensive microdamage. The larger microdamage clusters may also be indicative of the saturation of damage process zones that coalesce and propagate into fracture. In contrast, the control bone forms a greater number of smaller clusters of damage to dissipate energy efficiently across the volume of cancellous bone in post-yield loading without coalescing and minimize catastrophic stress concentrators and consequent fracture [26]. These changes in microdamage distribution, along with the shifts of ribosylated DS/DV to a crack-like morphology, suggest that non-enzymatic glycation causes cancellous bone to form greater amount of crack-like microdamage under post-yield loading.
In order to isolate the effects of non-enzymatic glycation, the tissue samples were harvested from a single donor at a single anatomic site. This criterion minimized the effects related to patient history, matrix quality, and anatomic variations. “On-axis” preparation was used to extract the cancellous bone cores in order to reduce microstructural variations between the cores [27]. Such a deliberate control over sample selection also limits the available range of architectural parameters. Previous studies have shown that microdamage initiation is correlated with architecture parameters such as the structural model index [28], and it is likely that bone quality changes due to non-enzymatic glycation would interact with trabecular architecture to influence microdamage formation.
Although the scanner resolution of the microCT scanner used in this study is 10.5 μm, previous work has demonstrated that CT scanners can detect physical openings approximately 10% of the voxel resolution without the use of a contrast agent [29]. Given the 10.5 μm voxel resolution used here, linear microcracks openings of 1.1 μm [1,3-6] should readily be detectable. In addition, the use of an atomically heavy lead-uranyl sulfide also allows for the increased delineation of the contrast agent from the surrounding bone tissues. Despite the ability to detect micron-scale cracks, this technique is susceptible to partial volume effects that may affect the computation of parameters, particularly DS/DV. Analysis of propagation of uncertainty shows that the average DS/DV error for specific morphologies such as a single microcrack is approximately 5% and less than 1% for diffuse damage (see Appendix). The presence of these errors would underestimate DS/DV values in cracks, and the true differences between microcracks and diffuse damage are likely to be larger than the measurements noted here.
This study is limited in the following ways. First, although no data are currently available, differences in the distribution of AGEs could affect damage accumulation. In this study the distribution of AGEs induced due to in vitro ribosylation was not characterized and compared with in vivo controls. A previous study has shown that in vitro ribosylation increases the accumulation of AGEs proportionally throughout the matrix and results in a heterogeneous distribution of AGEs within the microstructural components of the cortical bone matrix [14]. It is thus likely that the chemokinetics of the ribosylation process would proportionally increase the accumulation of AGEs throughout the cancellous bone matrix resulting in an amplification of the existing AGEs distribution. Second, the use of bone from a single donor may, despite reducing the biological variations in the bone samples, limit the application of these results. Lastly, ribosylating the bones of a 64-year-old patient results in levels of AGEs approximately to 80–90 years of aging which would represent an extreme in the age-related accumulation of advanced glycation end-products. The in vitro ribosylation procedure used here has been demonstrated to cause an increase in AGEs corresponding to two to three decades of in vivo aging and result in a similar loss of mechanical properties as observed with aging [13,14]. Moreover, the increased accumulation of AGEs is also prevalent in individuals with type II diabetes, and these individuals have significantly elevated risk of fracture despite normal or slightly higher BMD levels [30], suggesting that altered bone quality due to increased NEG may contribute to the increased fracture incidence. Thus, our results may also provide insights in the mechanisms of bone fragility in diabetics.
It is noteworthy that this study demonstrates the interactions of non-enzymatic glycation and microdamage formation on bone fragility. The accumulation of microdamage [6,8,31,32] and advanced glycation end-products have been shown to increase with age and adversely affect the mechanical behavior of bone [14,15]. Furthermore, despite its clinical relevance and importance in determining bone fragility and fracture risk, the clinical quantification of microdamage remains challenging due to the laborious histological preparations and subjective evaluation process. Advanced imaging modalities, combining new in vivo contrast agents and high-resolution imaging tools similar to this study, may overcome these challenges to make the clinical assessment of microdamage possible. The microCT techniques demonstrated here provide semi-automated measurements of microdamage, and the numerically-based characterization technique proposed here is free of orientation and spatial biases that allow for quantitative comparisons. It is also worth noting that the parameters DV/BV and DS/DV can be adapted for any imaging system including the 3-dimensional stacking of confocal microscopy microdamage images.
In summary, by using a new technique for the detection and quantification of spatial microdamage in 3-dimensions, it is demonstrated here that the adverse effects of NEG on bone's fracture resistance are manifested through the altered formation and morphology of microdamage. Thus, NEG causes multiple changes in microdamage mechanisms and leads to an overall reduction in bone toughness through its ability to dissipate energy.
Supplementary Material
Fig. S1.
Acknowledgments
The authors are grateful for the assistance by Ms. Lamya Karim in the preparation of the appendix. The authors also acknowledge the use of the Imaging Core Facility at the Centre of Biotechnology and Interdisciplinary Studies at Rensselaer Polytechnic Institute for MicroCT.
Funding Source: National Institutes of Health Grant #AG020618.
Appendix A
Parameterizing microdamage morphology using DS/DV
In this appendix, a mathematical basis for the quantification of damage morphologies is provided. Specifically, the numerical computation of damaged surface to damaged volume ratio (DS/DV) is demonstrated for several possible morphologies of microdamage in order to establish a range of values and the associated morphology. For the sake of simplicity, all theoretical microdamage morphologies are modeled using a 10 μm-sided cubic voxel as the building block. Although the microCT resolution used in this study produces a voxel size of 10.5 μm, the computations demonstrated here are proportional across all scales.
A row of ten voxels is proposed to represent a single defect parallel to the viewing plane (Fig. S1A). It can readily be shown that the DS/DV for this defect is 420/mm. Although the appearance of such defect would be unequivocally characterized as a microcrack, observations of confocal microscopy sections reveal that microcracks typically localize across serial sections [18,19], suggesting that microcracks are likely to have depth and may take on the form shown in Figs. S1B and S1C. Computing the DS/DV for these particular morphologies yields 140–240/mm.
A larger volume of microdamage as shown in Fig S1D is considered next, which would likely be quantified as diffuse damage under observations by optical microscopy at any orientation. The DS/DV for this morphology would yield 60/mm. Based on these calculations, it can be intuitively inferred that while comparing the values of DS/DV, comparatively higher values denote morphologies that are closer to that of a single microcrack, while lower values denote morphologies that are closer to a diffuse damage patch.
The case of a more complex morphology, seen in Fig S1E, is also considered here. Figure S1E shows a simple network of cross-hatched cracks containing seven intersecting cracks. The DS/DV value for such morphology is 85/mm. The DS/DV of the cross-hatch cracks is lower than that of the single crack model (Fig. S1B and S1C) but higher than that of the diffuse damage model (Fig. S1D). Consequently the network, shown in Figure S1E, is more diffuse than a single crack, but more crack-like than the diffuse damage. These quantitative comparisons are consistent with the qualitative definitions of linear microcracks and diffuse damage [1,3,6].
Also, comparison of this analysis with our experimental data (Fig. 5) shows that geometrically perfect linear microcracks with DS/DV in the 420–240/mm (Figs. S1 (A and B)) rarely occur in bone. Linear microcracks in bone are more likely to have additional damage in their vicinity that causes diffusion of lead–uranyl acetate in a zone wider than the 10.5 m resolution of microCT and registers a DS/DV in 100–140/mm range. For example, a DS/DV value of 140/mm for a crack with length and width in 80–100 μm can only be achieved at the expense having an expanded crack height of more a single voxel layer (Figure S1C). Furthermore, diffuse damage (DS/DV range up to 85/mm) may be more common in bone than previously anticipated.
Propagation of uncertainty of DS/DV due to microCT resolution
Because DS/DV measures are susceptible to random and systematic errors due to the spatial resolution and partial volume effects, it is important to determine the magnitude of error in the computation of DS/DV. The errors associated with DS/DV are dependent on the geometric morphology of the microdamage and the errors can be estimated by the propagation of uncertainty. Calculations are provided for the case of the microcrack (A1B) and diffuse damage (A1D). The generalized mathematical form of DS/DV for the two example cases can be expressed as follows (Eq A5):
| (Eq A1) |
Where x, y, and z are the respective dimensions of the microdamage.
Starting with the generalized form of the law of propagation of uncertainty (Eq A6) and assuming that the directional errors due to partial volume and spatial volume in the x-, y-, and z- directions are independent (where ζ is the propagated error, n is the degree of freedom, and x0, y0, and z0 are the expected errors) we get:
| (Eq A2) |
Applying the Eq A5 to Eq A6 we arrive at the following:
| (Eq A3) |
Since any systematic errors due to the resolution is on average one half of the voxel size, the values of x0= y0= z0=5 μm can be assigned. In the case of the microcrack with dimensions of x=10 μm, y=100 μm, z=100 μm; it follows that the expected propagated error due partial volume on DS/DVmicrocrack is approximately 5%. Applying (Eq A7) to the diffuse damage with dimensions of x=100 μm, y=100 μm, z=100 μm, an error of less than 1% is obtained for the DS/DV for diffuse damage presented here.
Although the specific errors depend on the specific morphology of the microdamage, the expected range of error for microdamage will decrease with larger volumes of damage (DV/BV).
Footnotes
Presented as a plenary poster at the 30th Annual Meeting of the ASBMR, Montreal, Canada September 12–16, 2008.
References
- 1.Wenzel TE, Schaffler MB, Fyhrie DP. In vivo trabecular microcracks in human vertebral bone. Bone. 1996;19(2):89–95. doi: 10.1016/8756-3282(96)88871-5. [DOI] [PubMed] [Google Scholar]
- 2.Burr DB, Turner CH, Naick P, Forwood MR, Ambrosius W, Hasan MS, et al. Does microdamage accumulation affect the mechanical properties of bone. J Biomech. 1998;21(1998):337–45. doi: 10.1016/s0021-9290(98)00016-5. [DOI] [PubMed] [Google Scholar]
- 3.Vashishth D, Koontz J, Qiu SJ, Lundin-Cannon D, Yeni YN, Schaffler MB, et al. In vivo diffuse damage in human vertebral trabecular bone. Bone. 2000;26(2):147–52. doi: 10.1016/s8756-3282(99)00253-7. [DOI] [PubMed] [Google Scholar]
- 4.Vashishth D, Behiri JC, Bonfield W. Crack growth resistance in cortical bone: Concept of microcrack toughening. J Biomech. 1997;30(8):763–9. doi: 10.1016/s0021-9290(97)00029-8. [DOI] [PubMed] [Google Scholar]
- 5.Vashishth D, Tanner KE, Bonfield W. Experimental validation of a microcracking-based toughening mechanism for cortical bone. J Biomech. 2003;36(1):121–4. doi: 10.1016/s0021-9290(02)00319-6. [DOI] [PubMed] [Google Scholar]
- 6.Diab T, Vashishth D. Effects of damage morphology on cortical bone fragility. Bone. 2005;37(1):96–102. doi: 10.1016/j.bone.2005.03.014. [DOI] [PubMed] [Google Scholar]
- 7.Bloebaum RD, Lundeen GA, Shea JE, Whitaker EL. Age-related mineralization heterogeneity changes in trabecular bone of the proximal femur. Anat Rec A Discov Mol Cell Evol Biol. 2004;281(2):1296–302. doi: 10.1002/ar.a.20079. [DOI] [PubMed] [Google Scholar]
- 8.Diab T, Condon KW, Burr DB, Vashishth D. Age-related change in damage morphology of human cortical bone and its role in bone fragility. Bone. 2006;38(3):427–31. doi: 10.1016/j.bone.2005.09.002. [DOI] [PubMed] [Google Scholar]
- 9.Bailey AJ, Sims TJ, Avery NC, Halliagan EP. Non-enzymatic glycation of fibrous collagen: reaction products of glucose and ribose. Biochem J. 1995;305:385–90. doi: 10.1042/bj3050385. [DOI] [PMC free article] [PubMed] [Google Scholar]
- 10.Odetti P, Rossi S, Monacelli F, Poggi A, Cirnigliaro F, Federici M, et al. Advanced glycation end-products and bone loss during aging. Ann N Y Acad Sci. 2005;1043:710–7. doi: 10.1196/annals.1333.082. [DOI] [PubMed] [Google Scholar]
- 11.Monnier VM, Sell DR, Abdul-Karim FW, Emancipator SN. Collagen browning and cross-linking are increased in chronic experimental hyperglycemia: relevance to diabetes and ageing. Diabetes. 1988;37:867–72. doi: 10.2337/diab.37.7.867. [DOI] [PubMed] [Google Scholar]
- 12.Reiser KM. Nonenzymatic glycation of collagen in aging and diabetes. Proc Soc Exp Biol Med. 1984;196(1):17–29. doi: 10.3181/00379727-196-43158c. [DOI] [PubMed] [Google Scholar]
- 13.Tang SY, Allen MR, Phipps R, Burr DB, Vashishth D. Changes in non-enzymatic glycation and its association with altered mechanical properties following 1-year treatment with risedronate or alendronate. Osteoporos Int. 2009;20(6):887–94. doi: 10.1007/s00198-008-0754-4. [DOI] [PMC free article] [PubMed] [Google Scholar]
- 14.Vashishth D, Gibson GJ, Khoury JI, Schaffler MB, Kimura J, Fyhrie DP. Influence of nonenzymatic glyation on biomechanical properties of cortical bone. Bone. 2001;22(2):195–201. doi: 10.1016/s8756-3282(00)00434-8. [DOI] [PubMed] [Google Scholar]
- 15.Wang X, Shen X, Li X, Agrawal CM. Age-related changes in the collagen network and toughness of bone. Bone. 2002;31(1):1–7. doi: 10.1016/s8756-3282(01)00697-4. [DOI] [PubMed] [Google Scholar]
- 16.Tang SY, Zeenath U, Vashishth D. Effects of non-enzymatic glycation on cancellous bone fragility. Bone. 2007;40(4):1144–51. doi: 10.1016/j.bone.2006.12.056. [DOI] [PMC free article] [PubMed] [Google Scholar]
- 17.Hernandez CJ, Tang SY, Baumbach BM, Hwu PB, Sakkee AN, van der Ham F, et al. Trabecular microfracture and the influence of pyridinium and non-enzymatic glycation-mediated collagen cross-links. Bone. 2005;37(6):825–32. doi: 10.1016/j.bone.2005.07.019. [DOI] [PMC free article] [PubMed] [Google Scholar]
- 18.Tang SY, Vashishth D. A non-invasive technique for the three-dimensional quantification of in vitro microdamage in trabecular bone. Bone. 2007(5):1259–64. doi: 10.1016/j.bone.2006.10.031. [DOI] [PMC free article] [PubMed] [Google Scholar]
- 19.Fazzalari NL, Forwood MR, Manthey BA, Smith K, Kolesik P. Three-dimensional confocal images of microdamage in cancellous bone. Bone. 1998;23(4):373–8. doi: 10.1016/s8756-3282(98)00111-2. [DOI] [PubMed] [Google Scholar]
- 20.Schaffler MB, Pitchford WC, Choi K, Riddle JM. Examination of compact bone microdamage using back-scattered electron microscopy. Bone. 1994 Sep-Oct;15(5):483–8. doi: 10.1016/8756-3282(94)90271-2. [DOI] [PubMed] [Google Scholar]
- 21.Gimenez-Martin G, Risueno MC. A simple staining technique for electron microscopy with lead–uranyl acetate. Sep Exp. 1967;23:316–8. doi: 10.1007/BF02135708. [DOI] [PubMed] [Google Scholar]
- 22.Nagaraja S, Tracey CL, Guldberg RE. Trabecular bone microdamage and micro-structural stresses under uniaxial tension. J Biomech. 2005;38(3005):707–16. doi: 10.1016/j.jbiomech.2004.05.013. [DOI] [PubMed] [Google Scholar]
- 23.Yeni YN, Hou FJ, Ciarelli T, Vashishsh D, Fyhrie DP. Trabecular shear stresses predict in vivo linear microcrack density but not diffuse damage in human vertebral cancellous bone. Ann Biomed Eng. 2003(31):726–32. doi: 10.1114/1.1569264. [DOI] [PubMed] [Google Scholar]
- 24.Sobelman OS, Gibeling JC, Stover SM, Hazelwood SJ, Yeh OC, Shelton DR, et al. Do microcracks decrease or increase fatigue resistance in cortical bone. J Biomech. 2004;37:1295–303. doi: 10.1016/j.jbiomech.2003.12.034. [DOI] [PubMed] [Google Scholar]
- 25.Nalla RK, Stolken JS, Kinney JH, Ritchie RO. Fracture in human cortical bone: local fracture criteria and toughening mechanisms. J Biomech. 2005;38(7):1517–25. doi: 10.1016/j.jbiomech.2004.07.010. [DOI] [PubMed] [Google Scholar]
- 26.Bazant ZP, Chen EB. Scaling of structural failure. ASME Appl Mech Rev. 1997;50:593. [Google Scholar]
- 27.Liu X, Wang X, Neibur GL. Effects of damage on the orthotropic material symmetry of bovine tibial trabecular bone. J Biomech. 2003;36(12):1753–9. doi: 10.1016/s0021-9290(03)00217-3. [DOI] [PubMed] [Google Scholar]
- 28.Nagaraja S, Lin AS, Guldberg RE. Age-related changes in trabecular bone microdamage initiation. Bone. 2007;40(4):973–80. doi: 10.1016/j.bone.2006.10.028. [DOI] [PubMed] [Google Scholar]
- 29.Breunig TM, Stock SR, Guvenilir A, Elliott JC. Damage in aligned-fibre SiC/Al quantified using a laboratory X-ray tomographic microscope. Composites. 1993;24(3):209. [Google Scholar]
- 30.Schwartz AV. Diabetes mellitus: does it affect bone. Calcif Tissue Int. 2003;73:515–9. doi: 10.1007/s00223-003-0023-7. [DOI] [PubMed] [Google Scholar]
- 31.Burr DB, Forwood MR, Fyhrie DP, Martin RB, Schaffler MB, Turner CH. Bone microdamage and skeletal fragility in osteoporotic and stress fractures. J Bone Miner Res. 1997;12(1):6–15. doi: 10.1359/jbmr.1997.12.1.6. [DOI] [PubMed] [Google Scholar]
- 32.Norman TL, Yeni TN, Brown CU, Wang Z. Influence of microdamage on fracture toughness of the human femur and tibia. Bone. 1998;23(3):303–6. doi: 10.1016/s8756-3282(98)00103-3. [DOI] [PubMed] [Google Scholar]
Associated Data
This section collects any data citations, data availability statements, or supplementary materials included in this article.
Supplementary Materials
Fig. S1.