

Abstract
There is uncertainty about the relationship between plasma leptin and sweet taste in mice. Whereas 2 studies have reported that elevations in plasma leptin diminish responsiveness to sweeteners, another found that they enhanced responsiveness to sucrose. We evaluated the impact of plasma leptin on sweet taste in C57BL/6J (B6) and leptin-deficient ob/ob mice. Although mice expressed the long-form leptin receptor (LepRb) selectively in Type 2 taste cells, leptin failed to activate a critical leptin-signaling protein, STAT3, in taste cells. Similarly, we did not observe any impact of intraperitoneal (i.p.) leptin treatment on chorda tympani nerve responses to sweeteners in B6 or ob/ob mice. Finally, there was no effect of leptin treatment on initial licking responses to several sucrose concentrations in B6 mice. We confirmed that basal plasma leptin levels did not exceed 10ng/mL, regardless of time of day, physiological state, or body weight, suggesting that taste cell LepRb were not desensitized to leptin in our studies. Furthermore, i.p. leptin injections produced plasma leptin levels that exceeded those previously reported to exert taste effects. We conclude that any effect of plasma leptin on taste responsiveness to sweeteners is subtle and manifests itself only under specific experimental conditions.
Key words: chorda tympani nerve, leptin, mice, modulation, sweet taste
Introduction
Leptin is an adipose-derived hormone that influences appetite and energy balance in mammals (Friedman 2009). Early studies demonstrated that leptin is part of a long-term negative feedback system, which maintains homeostatic control over body fat by modulating the hypothalamic circuits that regulate feeding and energy expenditure (Campfield et al. 1995; Halaas et al. 1995; Pelleymounter et al. 1995; Friedman and Halaas 1998). Subsequent work showed that leptin has short-term metabolic effects as well, mediating the neuroendocrine response to fasting (Ahima and Flier 2000). Leptin may also alter the smell and taste of foods. For instance, elevation in plasma leptin concentration has been reported to alter olfactory-mediated responses to food odors, but there is debate over whether it increases (Thanos et al. 2013) or decreases (Julliard et al. 2007; Prud’homme et al. 2009; Savigner et al. 2009) responsiveness. Likewise, there is disagreement about whether elevating plasma leptin increases (Lu et al. 2012) or decreases (Kawai et al. 2000; Shigemura et al. 2004; Yoshida et al. 2013) taste-mediated responses to sugars. Given the growing evidence that bioactive peptides and their cognate receptors modulate peripheral taste function (Dotson et al. 2013), we felt that it was important to further evaluate the relationship between plasma leptin and sweet taste responsiveness in mice.
There are 3 lines of support for the hypothesis that leptin modulates sweet taste in mice. First, in situ hybridization and immunohistochemical studies indicated that 2 molecules critical for leptin signaling are expressed in taste cells: the long form of the leptin receptor (ObRb or LepRb) and the downstream protein STAT3 (or signaling transducers and activators of transcription 3) (Kawai et al. 2000; Shigemura et al. 2003; Martin et al. 2010; Cai et al. 2014). Second, leptin treatment was found to decrease electrophysiological responses of taste cells (Yoshida et al. 2013) and the chorda tympani (CT) taste nerve (Kawai et al. 2000) to the sweet stimulus sucrose. Third, behavioral studies indicated that leptin treatment diminishes the ability of sweeteners to mask the aversive taste of quinine (Shigemura et al. 2004). On the other hand, a recent report found that leptin treatment causes a small but significant increase in responsiveness of the CT nerve to sucrose (Lu et al. 2012).
Here, we first asked whether the LepRb isoform is expressed in the population of taste cells that are sweet-responsive, and whether leptin activates STAT3 in taste cells. Next, we determined whether leptin modulates 1) CT nerve responses to sweeteners in C57BL/6J (B6) and leptin-deficient B6.Cg-Lepob/J (ob/ob) mice, or 2) taste-mediated licking for sucrose in B6 mice. Finally, we sought to confirm that leptin treatment actually produced robust increases in plasma leptin and that untreated mice maintained nominal basal leptin levels over the course of our experiments.
Materials and methods
Mice
For the immunohistochemistry experiment, we used LepRb-YFP mice. They were generated by crossing LepRb-IRES-Cre mice, in which an IRES-delineated cre recombinase was inserted into the 3′ untranslated region of the exon specific to the long form of the leptin receptor (LepRb, exon 18b) (Leshan et al. 2006), with a reporter line that expresses enhanced yellow fluorescent protein (EYFP) under the control of the ROSA26 promoter after cre-dependent excision of a loxp-flanked stop sequence (Srinivas et al. 2001). Reporter expression recapitulates known LepRb neuronal expression in the hypothalamus (Leshan et al. 2006; Patterson et al. 2011).
In the other experiments, we used C57BL/6J (B6) and B6.Cg-Lepob/J (ob/ob) mice. Both strains of mice were purchased from Jackson Laboratory. They were kept in a temperature- and humidity-controlled vivarium on a fixed 12:12h light–dark cycle and were housed individually in standard polycarbonate shoebox cages (27.5×17×12.5cm). All mice were naive to the taste stimuli prior to testing, 7–12 weeks old at testing, and randomly assigned to treatment groups. All animal procedures were approved by the Institutional Animal Care and Use Committees of University of Maryland, Baltimore, MD (immunohistochemistry and behavior) and Columbia University (nerve recordings and plasma leptin measurements).
Immunohistochemistry
LepRb-EYFP mice were anesthetized with a lethal dose of pentobarbital and immediately perfused with 0.1M phosphate-buffered saline (PBS) followed by 10% formalin. Heads were maintained in fixative at 4 °C for 24h prior to tissue dissection. Tissues were cryoprotected in 30% sucrose overnight at 4 °C. Cryostat sections (12 µm) were collected onto glass slides. After several washes in PBS, sections were blocked for 2h with 2% normal donkey serum (Jackson Immunoresearch) and immunostained with primary antibodies overnight at 4 °C. Primary antibodies included rabbit-anti-phospholipase C β2 (PLCβ2, 1:100; Santa-Cruz Biotechnology), chicken-anti-green fluorescent protein (GFP, 1:3000; Aves Labs, Inc.), and rabbit-anti-glucagon (1:500; Immunostar). The specificity of the anti-glucagon and anti-PLCβ2 antibodies has been confirmed previously (Yang et al. 2007; Dvoryanchikov et al. 2009; Elson et al. 2010). We also conducted the following controls for specificity: omitting primary or secondary antibodies (all antibodies) and performing immunolabeling in tissue from wild-type mice (for anti-GFP; data not shown). Primary antibodies were visualized with Cy2 and Cy3 secondary antibodies (1:4000; Jackson Immunoresearch) except for the anti-GFP antibody, which was visualized via biotinylated donkey-anti-chicken secondary antibodies followed by streptavidin-conjugated CY2 (both at 1:4000; Jackson Immunoresearch). Images were collected on an Olympus Fluoview 500 confocal microscope using FluoView software. Brightness and contrast levels of collected images were adjusted in Adobe Photoshop CS3.
For detection of pStat3 in brain and taste buds, mice were given an intraperitoneal (i.p.) injection of leptin (NIDDK National Hormone & Peptide Program, Harbor-UCLA Medical Center, CA). In this and all subsequent experiments, the leptin was dissolved in a PBS solution (pH 7.4) and injected at a volume of 0.004mL/g mouse. We injected the mice with 1 of 2 dosages of leptin (400ng/g body weight or 5 µg/g body weight), either 15 or 45min prior to perfusion with PBS and 4% paraformaldehyde. After dissection, tissues were post-fixed for 2h (tongue) or overnight (brain) at 4 °C. Tissues were processed as above, except that cryostat sections of brain tissue were collected at 60 μm as free-floating sections. We continued with a modified immunohistochemistry protocol, described elsewhere (Münzberg et al. 2003). Sections were pretreated with 1% NaOH and 1% H2O2 for 20min to quench endogenous peroxidases before being exposed to 2 additional pretreatments: 0.3% glycine (10min) and 0.03% SDS (10min). After an additional blocking step (described above), sections were incubated with the primary antibody overnight at room temperature (rabbit-anti-pStat3; Cell Signaling Technology; 1:1000). The following day sections were treated with a biotinylated secondary antibody followed by VECTASTAIN ABC kit processing (Vector Labs). The signal was developed with Nickel-DAB (Sigma Chemical). Images were collected on an Olympus microscope through a Microfire camera (Optronics) on Picture Frame software.
Taste nerve recordings
We made electrophysiological recordings from the CT nerve of both B6 and ob/ob mice (n = 6–7 mice per strain and treatment). The recordings were taken while taste stimuli were delivered to the anterior surface of the tongue. Prior to the surgery, mice were anesthetized with 4% isoflurane (Butler Schein). Mice were then transferred to a thermostat-controlled circulating-water heating pad (HTP-1500; Adroit Medical Systems) set at 40 °C, kept under anesthesia with 2% isoflurane via a nose cone and tracheotomized. Subsequently, the 1–2% isoflurane was delivered through a tracheal cannula.
Each mouse was secured in a nontraumatic head holder throughout the surgery and CT nerve recordings. The surgery involved removing the pinna, ear canal, and anterior-dorsal region of the tympanic membrane. Then, the intact CT nerve was contacted with a tungsten electrode at the point where it passed between the malleus head and the anterior tympanic spine. The indifferent electrode was shunted to the ground electrode, which was anchored in nearby tissue. Nerve responses were amplified (10000×) with an optically coupled isolated bioamplifier (ISO-80; World Precision Instruments), passed through a band-pass filter (30–3000 Hz), digitized (2000 samples/s), transformed (root mean square), and integrated with a time constant of 1 s (Biopac Software).
Taste stimuli were flowed over the anterior surface of the tongue at 10mL/min with a continuous-flow system (VC-6 Perfusion Valve Control System; Warner Instruments). All solutions were kept at 35 °C (physiological temperature) with an automatic temperature controller (Warner Instruments). To control for variations in the strength of the neural signal, 0.1M ammonium chloride (NH4Cl) was used as a reference stimulus; it was applied prior to each taste stimulus. Each sapid solution was applied for 20 s, followed by a rinse of at least 40 s of artificial saliva (see below).
The following test stimuli were used: sucrose (0.03, 0.1, 0.3, 1.0M); sucralose (1, 3, 10, 30mM); NaCl (0.1M); citric acid (0.02M); quinine dihydrochloride (10mM); NH4Cl2 (0.1M); and a mixture of MSG (0.04M) and IMP (1mM). We added 100 µM amiloride to the MSG + IMP solution to minimize the contribution of sodium to the response. We dissolved all chemical stimuli (including the NH4Cl) in an artificial saliva solution (0.015M NaCl, 0.022M KCl, 0.003M CaCl2, and 0.0006M MgCl2; Ogawa et al. 1972). All chemicals were purchased from Sigma-Aldrich, except the sucralose, which was a gift from Tate and Lyle.
Leptin was administrated i.p. at a dosage of 100ng/g body weight; this is the same dosage used in previous studies of whether leptin modulates taste function (Kawai et al. 2000; Lu et al. 2012). Control mice received an i.p. injection of vehicle control (i.e., PBS alone). The i.p. injection was administered 20min prior to initiating recording from the CT nerve, and every 40min for the duration of the recordings. The control mice received i.p. PBS injections over the same timeframe.
Using Biopac software, the mean voltage (in mV) of the relative integrated response of the CT nerve was determined for the 20 s before stimulation (i.e., baseline response to artificial saliva) and the first 20 s of stimulation with a taste stimulant (i.e., excitatory response); breathing artifacts were excluded from calculations. The difference between the baseline and excitatory response was calculated to find the absolute response to the tastant, which was then divided by the absolute response to the preceding NH4Cl stimulation to find the relative response.
A 2-way repeated measure ANOVA was performed on the relative responses to the sweetener solutions for sucrose and sucralose separately. For both sweeteners, the within factor was sweetener concentration and the between factor was leptin treatment. A similar 2-way repeated measure ANOVA was also performed on the relative responses to the NaCl, citric acid, quinine, and MSG. An unpaired t-test with Welch’s correction (to control for unequal variance) was performed on the NH4Cl responses of control and leptin-treated mice. In this and all subsequent experiments, we used IBM SPSS Statistics (www14.software.ibm.com) and Prism 6 (www.graphpad.com) to analyze the data; we set the alpha level at 0.05.
Brief-access taste testing
We subjected male B6 mice to brief-access taste tests (Glendinning et al. 2002) in a commercial gustometer (Davis MS160-Mouse; DiLog Instruments). This device provided each mouse with access to a single sipper tube during successive 5-s trials. Immediately prior to a trial, the computer positioned a sipper tube directly behind a slot (1.5-cm wide, 4.0-cm high) in the wall of the testing chamber, and then opened the shutter. The trial began when the mouse took its first lick from the sipper tube and ended 5 s later when the shutter closed. During the 7.5-s intertrial interval, a different sipper tube was positioned behind the shutter in preparation for the next trial. Each mouse was offered a range of sucrose concentrations during a test session (see below for details). The order of presentation was randomized (without replacement) in blocks so that every concentration of sucrose plus water was presented once before the initiation of a second block. Each test session lasted 25min, during which the mouse could initiate up to 120 trials.
Before taste testing was conducted, the mice were given 3 days of training with water. This served to familiarize the mice with the gustometer and train them to lick from the sipper tube to obtain water. Each training session began when the mouse took its first lick and lasted 25min. On training day 1, the mouse could drink freely from a single sipper tube throughout the session as the shutter was permanently open. On training days 2 and 3, the mouse could only drink from a sipper tube during 5-s trials.
Once training was completed, testing began. We presented multiple concentrations of sucrose during the 25-min test session. We included water as a solution within each block of sucrose concentrations. We tested 7 mice with the broad (0.01, 0.03, 0.1, 0.3, 0.5, and 1.0M) and 14 mice with the relatively narrow (0.025, 0.05, 0.1, 0.2, and 0.4M) range of sucrose concentrations (Sigma-Aldrich). The sucrose solutions were prepared in deionized water and presented to mice at room temperature. Mice were randomly assigned to the leptin-treated or control group. Each mouse received an i.p. injection of leptin or vehicle control 10min before the onset of the 25-min test session.
To encourage sampling from the sipper tube during training, we water-deprived the mice for 22.5h before each training session. Following each training session, the mouse was given water ad libitum for 1h; afterward, it was food-deprived for another 22.5h. To encourage sampling from the sipper tube during testing, we food- and water-restricted each mouse for 23.5h. This involved limiting each mouse to 1g of laboratory chow (dustless precision 1g food pellets; BioServ) and 2mL of water.
We controlled for individual differences in lick rate by calculating the standardized lick ratio (SLR), separately for each mouse (for details, see Glendinning et al. 2002). To this end, the average number of licks per trial for each concentration was divided by that animal’s maximum potential lick rate per trial based on the mean of the interlick interval (ILI) distribution measured during training day 1 with water (only ILIs >50ms and <200ms were used). A SLR approaching 0 indicates that the solution elicited only sporadic licking, whereas an SLR near 1.0 indicates that the solution elicited nearly continuous licking across each 5-s trial. The SLR values were subjected to a mixed-model ANOVA, separately for each range of sucrose concentrations. The within factor was sucrose concentration and the between factor was leptin treatment. Finally, we compared the number of trials initiated per test session between leptin- and sham-injected mice with an unpaired t-test; mice subjected to the broad or narrow concentration ranges were assessed separately.
Disposition curve for leptin in anesthetized and unanesthetized mice
We tested a total of 10 male B6 mice. The anesthesia treatment was a within factor because the same mouse was subjected to both the experimental and control trials. In the experimental trial, the mouse was anesthetized with 2% isoflurane (via a nose cone) and kept under anesthesia across the blood-sampling period. In the control trial, the mouse was not anesthetized, and instead was permitted to move freely in a cage (lacking food or water) throughout the blood-sampling period. We counterbalanced the order of testing (i.e., whether a mouse received the control or experimental trial first) so as to minimize any potential order effect. The mice were given a recovery day between the experimental and control trials. The injection treatment was a between factor because different mice were given i.p. leptin (100ng/g mouse) (n = 5), versus i.p. sham (i.e., PBS alone; N = 5) injections. This resulted in 4 treatment groups: anesthetized/leptin-injected, anesthetized/sham-injected, unanesthetized/leptin-injected, and unanesthetized/sham-injected. We took a baseline tail blood sample immediately before the leptin or sham injection, and then took additional samples 10, 30, and 60min later.
All mice were food- and water-restricted 22.5h prior to blood collection (for details, see above) so that they were in the same physiological state as the mice in the CT nerve recordings and lick studies. Tail blood was collected in an EDTA-coated 30 μL capillary tube. The blood was immediately transferred to a 0.25mL centrifuge tube and spun at 6000rpm for 3min. Then, the plasma was removed and placed on ice until it was transferred to an −80 °C freezer. Plasma leptin levels were measured with the Mouse Leptin ELISA Kit (Crystal Chem).
The impact of leptin treatment and anesthesia on plasma leptin was analyzed with a mixed-model ANOVA. There were 2 within factors (anesthesia treatment and time) and 1 between factor (injection treatment).
Impact of time of day, physiological state, and body weight on basal leptin levels
We randomly selected male B6 mice that fell into 1 of 2 weight classes (low weight: 18–22g; high weight: 27–30g; n = 5 per weight class). During the 23h preceding the test, half of the mice had ad libitum access to food and water, whereas the other half were food- and water-restricted. Thus, there were 4 treatment groups: low weight/ad lib-fed; high weight/ad lib-fed; low weight/food- and water-restricted; and high weight/food- and water-restricted. We tested each mouse twice—once under ad libitum food and water, and a second time under food and water restriction. We counterbalanced the test sequence across mice to control for order effects. Two tail blood samples were collected from each mouse: one at 9:00 AM and the other at 3:00 PM. Plasma leptin levels were examined with a mixed-model ANOVA; there were 2 within factors (time of day and food deprivation), and one between factor (weight class).
Results
We predicted that leptin receptors would be found on Type 2 taste cells, a subpopulation that contains sweet-responsive taste cells. We used mice engineered to produce an EYFP reporter in cells that express LepRb (LepRb-EYFP mice) to determine if this is the case. Double-label immunohistochemistry for EYFP and the Type 2 taste cell markers PLCβ2 (Zhang et al. 2003; Clapp et al. 2004) and glucagon (Elson et al. 2010) show that nearly all EYFP-expressing cells were also immunopositive for these 2 proteins (Figure 1A,B). A previous study reported that messenger RNA for STAT3, a protein important for LepRb-mediated signal transduction, is expressed in taste buds (Shigemura et al. 2003). However, we saw no evidence of STAT3 phosphorylation in taste buds after i.p. injections of leptin (either 400ng/g or 5 μg/g) at either 15 or 45min postinjection (Figure 1C and data not shown). By contrast, immunoreactivity for phosphorylated STAT3 is clearly seen in hypothalamic neurons of the same animals (Figure 1C). Therefore, while expression of the LepRb isoform is found in a subpopulation of taste bud cells that includes those that respond to sweet stimuli, leptin doses sufficient to activate hypothalamic LepRbs did not produce detectable STAT3-dependent signaling in taste buds.
Figure 1.

LepRb is expressed, but does not activate STAT3, in taste cells. (A, B) Colocalization of LepRb-driven YFP (green, using anti-GFP antibody) and Type 2 taste cell markers (A) PLCβ2 and (B) glucagon in taste cells of mouse vallate papillae. Blue, DAPI. Scale bars, 20 μm. (C) Phosphorylated STAT3 (pSTAT3) immunostaining in mouse tissues after leptin treatment (5 μg/g; i.p. injection 45min prior to euthanasia): vallate papillae (left; scale bar, 125 μm); hypothalamus (middle; scale bar, 250 μm); hypothalamus with no primary antibody (right; scale bar, 250 μm). DAPI, 4′,6-diamidino-2-phenylindole.
Does leptin treatment change CT nerve responses to taste stimuli in B6 or ob/ob mice?
We used male B6 mice because they were used in previous studies of whether leptin modulates peripheral taste function (Kawai et al. 2000; Lu et al. 2012). We also tested male ob/ob mice because they do not produce leptin constitutively (Friedman 2009), and thus permit complete experimental control over plasma leptin levels. Because the mice were food- and water-restricted during the lick tests, we also food- and water-restricted them during these nerve recordings so that the mice would be in the same physiological state.
For B6 mice, the CT nerve responses (as indicated by relative response) increased significantly with concentration of both sucrose (F 3,33 = 38.4, P < 0.001) and sucralose (F 3,33 = 38.4, P < 0.001) (Figure 2A–C, left panels). Although there was a trend for leptin-treated mice to show stronger CT nerve responses to sucrose than control mice, the difference was not significant (F 1,11 = 3.3, P = 0.10). Likewise, there was no significant main effect of leptin treatment on CT nerve response to sucralose (F 1,11 < 0.1, P = 0.77) or interaction of leptin treatment × concentration for either sucrose (F 3,33 = 0.5, P = 0.69) or sucralose (F 3,33 = 0.4, P = 0.78). Unpaired t-tests failed to uncover a significant effect of leptin treatment on CT nerve responses to the solutions containing NaCl, citric acid, quinine, and MSG + IMP (in all comparisons, P > 0.31). The absence of a significant difference in the unprocessed CT nerve response to NH4Cl across leptin treatments (Welch-corrected unpaired t value, = 1.26, df = 5.6, P = 0.26) justified the use of the NH4Cl response to normalize CT nerve responses.
Figure 2.

Leptin treatment failed to alter CT nerve responses in both B6 and ob/ob mice. (A) Relative responses of the CT nerve to a range of concentrations of sucrose and sucralose in leptin-treated (left panels) and control (right panels) mice from both strains. The relative response was calculated by dividing the CT nerve responses to each stimulus by that to 0.1M NH4Cl. (B) Relative responses to a single concentration of NaCl (0.1M), citric acid (0.02M), quinine (0.01M), and MSG (0.4M) + IMP (1mM) in leptin-treated (left panel) and control (right panel) mice from both strains. (C) Typical whole-nerve integrated CT nerve responses to 0.1M NH4Cl and 3 concentrations of sucrose and sucralose in leptin-treated (top row of traces) and control (bottom row of traces) mice from the B6 strain. Symbols represent mean ± standard error. N = 6–7 mice per strain and treatment.
The results from the ob/ob mice were similar to those from the B6 mice (Figure 2A,B, right panels). Namely, the CT nerve responses to both sucrose and sucralose increased monotonically with concentration, resulting in significant main effects of concentration (in both comparisons, P < 0.0001). However, the main effect of leptin treatment and the interaction of leptin treatment × sweetener concentration were nonsignificant (in all comparisons, P > 0.49). Further, leptin failed to alter CT nerve response to the solutions containing NaCl, citric acid, quinine, and MSG + IMP (in all comparisons, P > 0.34). There was also no effect of leptin on the unprocessed CT nerve response to NH4Cl (Welch-corrected unpaired t value, = 0.32, df = 9.3, P = 0.76). Taken together, the findings in both B6 and ob/ob mice indicate that leptin had no measureable impact on peripheral CT nerve response to sweeteners in mice.
Does leptin alter concentration-dependent increases in licking for sucrose in B6 mice?
Using sucrose concentrations that matched those used in prior studies (Kawai et al. 2000; Shigemura et al. 2004; Lu et al. 2012), we examined unconditioned licking for sucrose in B6 mice with and without systemic leptin treatment. Our study design incorporated the potentially confounding effect of simultaneous contrast effects on licking for sugars—for example, the fact that the attractiveness of a low sucrose concentration (e.g., 0.1M) is greater when it is tested together with an intermediate (e.g., 0.4M) sucrose concentration than when it is tested together with a high (e.g., 1.0M) sucrose concentration (Grigson et al. 1993; Flaherty and Mitchell 1999). To this end, we tested 2 ranges of sucrose concentrations—0.025–0.4M and 0.01–1.0M.
When offered the broad range of sucrose solutions (i.e., 0.01–1.0M), the B6 mice exhibited lick rates that increased monotonically with concentration (Figure 3), resulting in a significant main effect of concentration (F 5,60 = 810.5, P < 0.0001). However, neither the main effect of leptin treatment (F 1,12 < 0.1, P = 0.92) nor the interaction of leptin treatment × sucrose concentration (F 5,60 = 0.53, P = 0.75) were significant. Likewise, when offered the narrow range of sucrose concentrations (i.e., 0.25–0.4M), the main effect of concentration was significant (F 4,104 = 668.2, P < 0.0001), but the main effect of leptin treatment (F 1,26 = 1.1, P = 0.29) and interaction of leptin treatment × sucrose concentration (F 4,104 = 2.28, P = 0.066) were nonsignificant (Figure 3). Thus, leptin treatment had no measureable impact on unconditioned licking for either the narrow or the broad range of sucrose concentrations.
Figure 3.
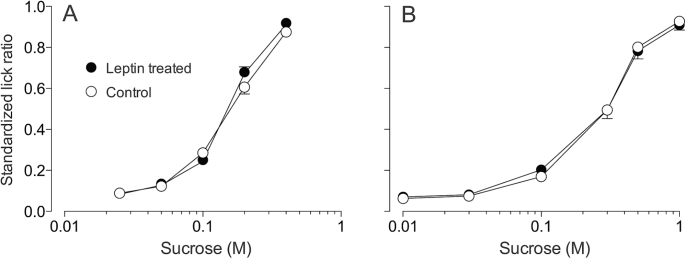
Leptin treatment did not alter unconditioned licking for the narrow (A) or broad (B) range of sucrose concentrations in B6 mice. We represent licking as standardized lick ratios (the higher the ratio, the faster the licking). All mice were food- and water-restricted prior to testing. Each mouse was offered the narrow or broad range of sucrose concentrations during a single test session; the concentrations were presented according to a randomized block design (without replacement). Symbols represents mean ± standard error. N = 7–14 mice per treatment level and panel.
Another measure of ingestive responsiveness is the number of trials that mice initiated across the 30-min test session (McCaughey and Glendinning 2013). However, there were no significant differences in number of trials initiated by sham- and leptin-injected mice when tested with the broad (sham: 41.2±2.9; leptin: 34.7±3.6; unpaired t value = 1.42, df = 12, P = 0.18) or narrow (sham: 38.4±3.2, leptin: 36.3±2.4; unpaired t value = 0.52, df = 26, P = 0.61) range of sucrose concentrations.
To what extent does leptin treatment increase plasma leptin levels?
Here, we sought to confirm that 1) the leptin treatment (i.e., 100ng/g) produced robust elevations in plasma leptin levels, and 2) the isoflurane anesthesia procedure (used in the CT nerve recordings) did not alter the leptin disposition curve. Prior studies have reported that certain types of anesthesia can alter the concentration of nutrients (and thus potentially leptin) in blood (Vaughan et al. 2014).
Leptin treatment produced a greater than 10-fold increase in plasma leptin levels within 30min (Figure 4). Indeed, the main effects of leptin treatment (F 1,8 = 102.9, P < 0.001) and time (F 3,21 = 623.3, P < 0.001) and the interaction of leptin treatment × time (F 3,21 = 644.6, P < 0.001) were all significant. However, the main effect of anesthesia and the interaction of anesthesia × time (or anesthesia × time × leptin treatment) were not significant (in all cases, P > 0.05). Taken together, it is apparent that leptin treatment produced dramatic increases in plasma leptin, irrespective of whether the mice were anesthetized.
Figure 4.

Plasma leptin concentrations increased >10-fold over the 60-min trial in leptin-treated but not control mice, irrespective of whether the mice were (A) unanesthetized or (B) anesthetized with isoflurane. Symbols represent mean ± standard error. N = 5 mice per injection treatment.
Does time of day, physiological state, or body weight alter basal plasma leptin levels?
The modulatory effects of leptin on peripheral taste responsiveness are thought to be greatest when plasma levels are <10ng/mL (Kawai et al. 2000; Niki et al. 2013). As a result, we sought to confirm that the mice in our study did not have plasma levels that exceeded this threshold concentration. To this end, we examined the impact of several variables known to modulate plasma leptin levels, which were not held constant in the experiments described above. For instance, plasma leptin levels increase with body weight (Gairdner and Amara 2012), and the B6 mice used in the lick studies and nerve recordings ranged between 22 and 29g. Likewise, fasting tends to reduce plasma leptin levels (Gairdner and Amara 2012); we tested both fasted and ad lib-fed mice.
There were significant main effects of food/water restriction (F 1,18 = 15.107, P = 0.001) and time of day (F 1,18 = 5.932, P = 0.025) on basal plasma leptin concentration (Figure 5). This shows that the plasma leptin concentrations were lower both during food-and-water-restriction and in the afternoon. Although there was no significant main effect of weight on plasma leptin concentration (F 1,18 = 0.460, P = 0.506), there was a significant interaction of food/water restriction × weight (F 1,18 = 4.561, P = 0.047). This latter result reveals that food and water restriction decreased plasma leptin levels to a greater extent in the heavier than the lighter mice. Notwithstanding these significant differences in basal leptin levels, it is notable that all mean plasma leptin levels were <5ng/mL.
Figure 5.

Effect of time of day (9:00 AM vs. 3:00 PM), physiological state (ad lib fed vs. food- and water-restricted), and body weight (18–22 vs. 27–30g) on basal plasma leptin concentrations. Symbols represent mean ± standard error. N = 5 mice per weight class.
Discussion
This study assessed the impact of plasma leptin on sweet taste responsiveness in mice. In contrast to previous findings (Kawai et al. 2000; Lu et al. 2012; Yoshida et al. 2013), we did not find evidence that circulating leptin impacts taste responsiveness to either caloric or noncaloric sweeteners.
Our immunohistochemical studies corroborated earlier findings (Kawai et al. 2000; Shigemura et al. 2003; Martin et al. 2010; Cai et al. 2014) that LepRb is expressed in taste cells, and also extended this work by establishing that LepRb is expressed selectively in Type 2 taste cells. However, we found that leptin treatment (at doses sufficient to activate hypothalamic LepRbs) failed to activate STAT3-dependent signaling in vallate taste bud cells, despite evidence that STAT3 is expressed in taste cells (Shigemura et al. 2003). Why this might be is unclear. One possibility is that LepRbs expressed on taste cells may not be sufficiently accessible to circulating leptin. Other peptide receptors found in taste buds (e.g., receptors for glucagon, glucagon-like peptide-1, cholecystokinin, peptide YY) appear to be targeted by paracrine agonists produced within subsets of taste cells (Herness et al. 2002; Shin et al. 2008; Elson et al. 2010; Dotson et al. 2013) or in the saliva (La Sala et al. 2013). Although there are no reports of leptin expression in taste cells, other nearby sources may be available. A second possibility is that LepRbs signal through a STAT3-independent mechanism in taste cells. Indeed, LepRb can signal though phosphoinositide 3-kinase (Hill et al. 2008) and extracellular signal-regulated kinase (Banks et al. 2000) pathways. The LepRb may only be expressed transiently during taste cell development, such that the EYFP reporter in LepRb-EYFP mice may not mimic the temporal expression pattern of LepRb. However, due to the rapid turnover of taste cells in the adult (~10 days), it would be expected that at least some labeled cells express the receptor. Finally, taste cells may express other LepR isoforms, which could contribute to leptin signaling (Bjørbaek et al. 1997) in the taste buds. Be that as it may, the absence of physiological or behavioral responses to leptin in our studies is consistent with a lack of taste cell responsiveness to changes in circulating leptin.
Despite obtaining robust CT nerve responses in the B6 and ob/ob mice, the leptin treatment had no systematic effect on the magnitude of response to any taste stimuli. Although there was a trend for the CT nerve responses to sucrose to be larger in leptin-treated than control B6 mice, the difference was not significant. This finding resembles a previous observation—namely, that leptin treatment caused a small but significant increase in CT nerve responsiveness to sucrose (but not saccharin) in B6 mice (Lu et al. 2012). The similarity in magnitude of the leptin-induced increase in CT nerve response to sucrose between the present study and that of Lu et al. (2000) suggests that elevated plasma leptin may, under certain conditions, increase the CT nerve response to sucrose in B6 mice. What remains difficult to explain, however, is why there was no corresponding leptin-induced enhancement of the CT nerve response to sucrose in ob/ob mice. Given that B6 and ob/ob mice are essentially genetically identical except for the mutation in the leptin gene, we would expect both strains to express similar leptin-signaling pathways in their taste cells. It may be, however, that the absence of leptin across development has altered LepR signaling or leptin sensitivity in the taste buds of ob/ob mice.
The quantitative differences between our findings and those of Lu et al. (2012) are minor as compared with the qualitative differences between our findings and those of Kawai et al. (2000). The latter study reported that leptin treatment decreases CT and glossopharyngeal nerve responses to sucrose and saccharin in both B6 and BALB mice. To explain the contradictory findings between our results and those of Kawai et al. (2000), we asked whether methodological differences rendered our studies incomparable. First, we explored the possibility that our leptin injections caused less robust elevations in plasma leptin than did the injections in the previous study. To this end, we measured plasma leptin levels at various time points. We found that leptin reached plasma concentrations approximately 2 times higher in the present study than in the Kawai et al. (2000) study (i.e., 24 vs. 12ng/mL), irrespective of whether the mice were anesthetized. These results establish that the mice in the present study actually experienced more robust elevations in plasma leptin than those in the previous study. Second, given that the peripheral taste system becomes unresponsive to experimental elevations in plasma leptin when the basal leptin levels exceed 10ng/mL (Kawai et al. 2000; Niki et al. 2013), we examined the impact of our experimental conditions on basal leptin levels in the B6 mice. We found that even though changes in water/food restriction, time of day, and weight class all caused systematic changes in basal leptin levels, none caused mean plasma leptin concentrations to rise above 5ng/mL. Accordingly, the B6 mice in our study should have been responsive to the leptin injections. Third, there were several important methodological differences between our study and that of Kawai et al. (2000)—for example, the temperature of the taste solutions (i.e., 35 vs. 24 °C, respectively), the solvent used for the taste stimuli (i.e., artificial saliva vs. distilled water, respectively), and the state of the taste nerve during recordings (i.e., intact vs. cut). Although both temperature and solvent could have impacted the magnitude of the CT nerve responses (Lu et al. 2012), it is not clear how they could have modulated responsiveness to leptin. Further, we recorded from an intact CT nerve, while Kawai et al. (2000) recorded from a cut CT nerve. It is conceivable that an intact CT nerve would generate weaker responses to sucrose than a cut CT nerve, owing to insulation conferred by the intact nerve sheath. However, this was not the case: the mean relative responses of B6 mice to 1M sucrose in the present study and in Kawai et al. (2000) were similar.
Behavioral studies
The B6 mice initiated a relatively large number of trials and generated robust concentration-dependent increases in lick rates for sucrose, irrespective of whether they received the narrow or broad range of concentrations. Given these strong ingestive responses, our tests should have been able to detect subtle modulatory effects of leptin on sucrose taste processing. Nevertheless, we did not obtain any evidence for these modulatory effects. Although this result agrees with results from our nerve studies, it would appear to contradict a prior behavioral study with ob/ob mice (Shigemura et al. 2004). This prior study reported that sucrose and saccharin masked the aversive taste of quinine much less effectively in leptin-injected ob/ob mice than in sham-injected ob/ob mice. The authors explained this latter observation by proposing that leptin treatment diminished the peripheral taste response to the sweeteners, and in so doing, diminished its ability to mask the taste of quinine. While we did not find that leptin treatment diminishes the peripheral taste response to sucrose or sucralose in B6 mice, we cannot reject the possibility that leptin impaired the ability of the sweeteners to mask the aversive taste of quinine because we did not test binary mixtures. Indeed, given that the masking phenomenon appears to be mediated in both peripheral (Formaker and Frank 1996) and central (Kroeze and Bartoshuk 1985) circuits of the taste system, it is possible that leptin acts selectively on circuits that mediate mixture interactions between sweet and bitter taste stimuli.
Conclusion
In closing, we acknowledge 3 interpretive limitations of our study. First, our ability to relate the STAT3-signaling results to the CT nerve results is limited by the fact that each study involved distinct taste bud populations (i.e., vallate vs. foliate, respectively). Second, while input from the CT nerve plays an important role in driving taste-mediated licking for sugars, input from other taste nerves (i.e., greater superficial petrosal and glossopharyngeal) contribute to the overall ingestive response. Third, as noted above, there were several methodological differences between our study and those of Kawai et al. (2000) and Shigemura et al. (2004), which may have contributed to the contradictory findings.
Notwithstanding these caveats, we found that even though the B6 mice expressed LepRb selectively in Type 2 taste cells, stimulation of LepRb did not appear to activate STAT3 in taste cells. This finding is consistent with the observations that leptin treatment did not alter 1) CT nerve responsiveness to sweeteners in B6 and ob/ob mice, or 2) taste-mediated licking for sucrose in B6 mice. At this point, we can only speculate why our results differ from those of prior studies (Kawai et al. 2000; Lu et al. 2012). Nevertheless, the preponderance of negative results presented herein leads us to conclude that any effect of plasma leptin on taste responses to sweeteners is subtle and manifests itself only under specific experimental conditions.
Funding
This work was supported by grants from National Institutes of Health/National Institute on Deafness and Other Communication Disorders (NIH NIDCD) [DC010110, DC010113].
Acknowledgements
The leptin was obtained from A.F. Parlow at the National Hormone & Peptide Program.
References
- Ahima RS, Flier JS. 2000. Leptin. Annu Rev Physiol. 62:413–437. [DOI] [PubMed] [Google Scholar]
- Banks AS, Davis SM, Bates SH, Myers MG., Jr 2000. Activation of downstream signals by the long form of the leptin receptor. J Biol Chem. 275:14563–14572. [DOI] [PubMed] [Google Scholar]
- Bjørbaek C, Uotani S, da Silva B, Flier JS. 1997. Divergent signaling capacities of the long and short isoforms of the leptin receptor. J Biol Chem. 272:32686–32695. [DOI] [PubMed] [Google Scholar]
- Cai H, Daimon CM, Cong WN, Wang R, Chirdon P, de Cabo R, Sévigny J, Maudsley S, Martin B. 2014. Longitudinal analysis of calorie restriction on rat taste bud morphology and expression of sweet taste modulators. J Gerontol A Biol Sci Med Sci. 69:532–544. [DOI] [PMC free article] [PubMed] [Google Scholar]
- Campfield LA, Smith FJ, Guisez Y, Devos R, Burn P. 1995. Recombinant mouse OB protein: evidence for a peripheral signal linking adiposity and central neural networks. Science. 269:546–549. [DOI] [PubMed] [Google Scholar]
- Clapp TR, Yang R, Stoick CL, Kinnamon SC, Kinnamon JC. 2004. Morphologic characterization of rat taste receptor cells that express components of the phospholipase C signaling pathway. J Comp Neurol. 468:311–321. [DOI] [PubMed] [Google Scholar]
- Dotson CD, Geraedts MC, Munger SD. 2013. Peptide regulators of peripheral taste function. Semin Cell Dev Biol. 24:232–239. [DOI] [PMC free article] [PubMed] [Google Scholar]
- Dvoryanchikov G, Sinclair MS, Perea-Martinez I, Wang T, Chaudhari N. 2009. Inward rectifier channel, ROMK, is localized to the apical tips of glial-like cells in mouse taste buds. J Comp Neurol. 517:1–14. [DOI] [PMC free article] [PubMed] [Google Scholar]
- Elson AE, Dotson CD, Egan JM, Munger SD. 2010. Glucagon signaling modulates sweet taste responsiveness. FASEB J. 24:3960–3969. [DOI] [PMC free article] [PubMed] [Google Scholar]
- Flaherty CF, Mitchell C. 1999. Absolute and relative rewarding properties of fructose, glucose, and saccharin mixtures as reflected in anticipatory contrast. Physiol Behav. 66:841–853. [DOI] [PubMed] [Google Scholar]
- Formaker BK, Frank ME. 1996. Responses of the hamster chorda tympani nerve to binary component taste stimuli: evidence for peripheral gustatory mixture interactions. Brain Res. 727:79–90. [DOI] [PubMed] [Google Scholar]
- Friedman JM. 2009. Leptin at 14 y of age: an ongoing story. Am J Clin Nutr. 89(Suppl):973S–979S. [DOI] [PMC free article] [PubMed] [Google Scholar]
- Friedman JM, Halaas JL. 1998. Leptin and the regulation of body weight in mammals. Nature. 395:763–770. [DOI] [PubMed] [Google Scholar]
- Gairdner SE, Amara CE. 2012. Serum leptin is not correlated with body fat in severe food restriction. Appl Physiol Nutr Metab. 37:1063–1071. [DOI] [PubMed] [Google Scholar]
- Glendinning JI, Gresack J, Spector AC. 2002. A high-throughput screening procedure for identifying mice with aberrant taste and oromotor function. Chem Senses. 27:461–474. [DOI] [PubMed] [Google Scholar]
- Grigson PS, Spector AC, Norgren R. 1993. Microstructural analysis of successive negative contrast in free-feeding and deprived rats. Physiol Behav. 54:909–916. [DOI] [PubMed] [Google Scholar]
- Halaas JL, Gajiwala KS, Maffei M, Cohen SL, Chait BT, Rabinowitz D, Lallone RL, Burley SK, Friedman JM. 1995. Weight-reducing effects of the plasma protein encoded by the obese gene. Science. 269:543–546. [DOI] [PubMed] [Google Scholar]
- Herness S, Zhao FL, Lu SG, Kaya N, Shen T. 2002. Expression and physiological actions of cholecystokinin in rat taste receptor cells. J Neurosci. 22:10018–10029. [DOI] [PMC free article] [PubMed] [Google Scholar]
- Hill JW, Williams KW, Ye C, Luo J, Balthasar N, Coppari R, Cowley MA, Cantley LC, Lowell BB, Elmquist JK. 2008. Acute effects of leptin require PI3K signaling in hypothalamic proopiomelanocortin neurons in mice. J Clin Invest. 118:1796–1805. [DOI] [PMC free article] [PubMed] [Google Scholar]
- Julliard AK, Chaput MA, Apelbaum A, Aimé P, Mahfouz M, Duchamp-Viret P. 2007. Changes in rat olfactory detection performance induced by orexin and leptin mimicking fasting and satiation. Behav Brain Res. 183:123–129. [DOI] [PubMed] [Google Scholar]
- Kawai K, Sugimoto K, Nakashima K, Miura H, Ninomiya Y. 2000. Leptin as a modulator of sweet taste sensitivities in mice. Proc Natl Acad Sci USA. 97:11044–11049. [DOI] [PMC free article] [PubMed] [Google Scholar]
- Kroeze JH, Bartoshuk LM. 1985. Bitterness suppression as revealed by split-tongue taste stimulation in humans. Physiol Behav. 35:779–783. [DOI] [PubMed] [Google Scholar]
- La Sala MS, Hurtado MD, Brown AR, Bohórquez DV, Liddle RA, Herzog H, Zolotukhin S, Dotson CD. 2013. Modulation of taste responsiveness by the satiation hormone peptide YY. FASEB J. 27:5022–5033. [DOI] [PMC free article] [PubMed] [Google Scholar]
- Leshan RL, Björnholm M, Münzberg H, Myers MG., Jr 2006. Leptin receptor signaling and action in the central nervous system. Obesity (Silver Spring). 14(Suppl 5):208S–212S. [DOI] [PubMed] [Google Scholar]
- Lu B, Breza JM, Nikonov AA, Paedae AB, Contreras RJ. 2012. Leptin increases temperature-dependent chorda tympani nerve responses to sucrose in mice. Physiol Behav. 107:533–539. [DOI] [PubMed] [Google Scholar]
- Martin B, Shin YK, White CM, Ji S, Kim W, Carlson OD, Napora JK, Chadwick W, Chapter M, Waschek JA, et al. 2010. Vasoactive intestinal peptide-null mice demonstrate enhanced sweet taste preference, dysglycemia, and reduced taste bud leptin receptor expression. Diabetes. 59:1143–1152. [DOI] [PMC free article] [PubMed] [Google Scholar]
- McCaughey SA, Glendinning JI. 2013. Experience with sugar modifies behavioral but not taste-evoked medullary responses to sweeteners in mice. Chem Senses. 38:793–802. [DOI] [PMC free article] [PubMed] [Google Scholar]
- Münzberg H, Huo L, Nillni EA, Hollenberg AN, Bjørbaek C. 2003. Role of signal transducer and activator of transcription 3 in regulation of hypothalamic proopiomelanocortin gene expression by leptin. Endocrinology. 144:2121–2131. [DOI] [PubMed] [Google Scholar]
- Niki M, Jyotaki M, Ohkuri T, Yoshida R, Ninomiya Y. 2013. Regulation of basal sweet sensitivity of mice by leptin (Abstract from the 35th Annual Meeting of AChemS). Chem Senses. 38:619–657. [Google Scholar]
- Ogawa H, Yamashita S, Noma A, Sato M. 1972. Taste responses in the macaque monkey chorda tympani. Physiol Behav. 9:323–331. [DOI] [PubMed] [Google Scholar]
- Patterson CM, Leshan RL, Jones JC, Myers MG., Jr 2011. Molecular mapping of mouse brain regions innervated by leptin receptor-expressing cells. Brain Res. 1378:18–28. [DOI] [PMC free article] [PubMed] [Google Scholar]
- Pelleymounter MA, Cullen MJ, Baker MB, Hecht R, Winters D, Boone T, Collins F. 1995. Effects of the obese gene product on body weight regulation in ob/ob mice. Science. 269:540–543. [DOI] [PubMed] [Google Scholar]
- Prud’homme MJ, Lacroix MC, Badonnel K, Gougis S, Baly C, Salesse R, Caillol M. 2009. Nutritional status modulates behavioural and olfactory bulb Fos responses to isoamyl acetate or food odour in rats: roles of orexins and leptin. Neuroscience. 162:1287–1298. [DOI] [PubMed] [Google Scholar]
- Savigner A, Duchamp-Viret P, Grosmaitre X, Chaput M, Garcia S, Ma M, Palouzier-Paulignan B. 2009. Modulation of spontaneous and odorant-evoked activity of rat olfactory sensory neurons by two anorectic peptides, insulin and leptin. J Neurophysiol. 101:2898–2906. [DOI] [PMC free article] [PubMed] [Google Scholar]
- Shigemura N, Miura H, Kusakabe Y, Hino A, Ninomiya Y. 2003. Expression of leptin receptor (Ob-R) isoforms and signal transducers and activators of transcription (STATs) mRNAs in the mouse taste buds. Arch Histol Cytol. 66:253–260. [DOI] [PubMed] [Google Scholar]
- Shigemura N, Ohta R, Kusakabe Y, Miura H, Hino A, Koyano K, Nakashima K, Ninomiya Y. 2004. Leptin modulates behavioral responses to sweet substances by influencing peripheral taste structures. Endocrinology. 145:839–847. [DOI] [PubMed] [Google Scholar]
- Shin YK, Martin B, Golden E, Dotson CD, Maudsley S, Kim W, Jang HJ, Mattson MP, Drucker DJ, Egan JM, et al. 2008. Modulation of taste sensitivity by GLP-1 signaling. J Neurochem. 106:455–463. [DOI] [PMC free article] [PubMed] [Google Scholar]
- Srinivas S, Watanabe T, Lin CS, William CM, Tanabe Y, Jessell TM, Costantini F. 2001. Cre reporter strains produced by targeted insertion of EYFP and ECFP into the ROSA26 locus. BMC Dev Biol. 1:4. [DOI] [PMC free article] [PubMed] [Google Scholar]
- Thanos PK, Robison LS, Robinson JK, Michaelides M, Wang GJ, Volkow ND. 2013. Obese rats with deficient leptin signaling exhibit heightened sensitivity to olfactory food cues. Synapse. 67:171–178. [DOI] [PMC free article] [PubMed] [Google Scholar]
- Vaughan KL, Szarowicz MD, Herbert RL, Mattison JA. 2014. Comparison of anesthesia protocols for intravenous glucose tolerance testing in rhesus monkeys. J Med Primatol. 43:162–168. [DOI] [PMC free article] [PubMed] [Google Scholar]
- Yang R, Ma H, Thomas SM, Kinnamon JC. 2007. Immunocytochemical analysis of syntaxin-1 in rat circumvallate taste buds. J Comp Neurol. 502:883–893. [DOI] [PubMed] [Google Scholar]
- Yoshida R, Niki M, Jyotaki M, Sanematsu K, Shigemura N, Ninomiya Y. 2013. Modulation of sweet responses of taste receptor cells. Semin Cell Dev Biol. 24:226–231. [DOI] [PubMed] [Google Scholar]
- Zhang Y, Hoon MA, Chandrashekar J, Mueller KL, Cook B, Wu D, Zuker CS, Ryba NJ. 2003. Coding of sweet, bitter, and umami tastes: different receptor cells sharing similar signaling pathways. Cell. 112(3):293–301. [DOI] [PubMed] [Google Scholar]