

Abstract
Objective
In order to perform effective translational research for cancer therapy, we need to employ pre-clinical models which reflect the clinical situation. The purpose of this study was to quantitatively compare the vascular architecture of human colorectal cancer and experimental tumour models to determine the suitability of animal models for vascular studies and antivascular therapy.
Methods
In this study we investigated the three-dimensional properties of colonic tumour vasculature in both human clinical tissues (normal mucosa control [n=20], carcinoma [n=20] and adenoma [n=6]) and murine colorectal xenografts (LS147T [n=6] and SW1222 [n=6]). Scanning Electron Microscope Stereoimaging (SEM) and X-ray Micro-Computed Tomography (Micro-CT) methods were employed for 3D analyses of the vascular corrosion casts from these tissues.
Results
Morphological measurements showed that there were significant differences in the underlying morphology in the different tissues. Of the studied xenografts, LS147T is more consistently similar to the vascular architecture of the human carcinoma than SW1222. The only reversal of this is for the inter-vessel distance.
Conclusion
While SEM stereoimaging provided better surface detailed resolution of the corrosion casts, it was complimented by the fully 3D micro-CT method. Comparison made between the xenografts and clinical tumours showed that the LS147T xenografts shared many similarities with the clinical tumour vasculature. This study provides insight into how to select the most suitable pre-clinical models for translational studies of clinical cancer therapy.
Keywords: Microvascular Architecture, Corrosion Casting, Micro-Computed Tomography, Stereo-imaging, Angiogenesis, Tortuosity
Introduction
Tumour vascular is important as both a therapeutic target (Tozer et al., 2005b;Tozer et al., 2001) (Qayum et al., 2009) & prognostic biomarker (Gulubova and Vlaykova, 2009;Minardi et al., 2008;Yildiz et al., 2008). Methods which enable the 3D structure to be analysed are therefore of great value in assessing the effects of treatments (El-Emir et al., 2007; Salmon et al., 2006; Tozer, 2003; Malcontenti-Wilson et al., 2001) and understanding the underlying biology of tumour vascularisation (Belien et al., 1999). Confocal (Dickie et al., 2006) and two-photon microscopy (Tozer et al., 2005a) can be used for this purpose; however, due to poor depth of penetration, these techniques are limited to special sample preparations such as window chamber xenografts. However the window chamber system compresses the tumour between two glass slides, giving a narrow sample thickness of ~200μm which is not representative of a naturally growing tumour. In contrast, corrosion casting (Malkusch et al., 1995; Skinner et al., 1990) satisfied the goals of capturing three-dimensional vascular architecture of the tumour in a consistent manner, independent of tumour location and sample thickness. The main advantage of corrosion casts is that the whole terminal vascular system can be studied at high resolution using both Scanning Electron Microscopy (SEM) and Micro Computed Tomography (Micro-CT), yielding both structural and topological information of the vascular system. The importance of using 3D measurements is highlighted in a study by Minnich et al. which compared the accuracy of 2D and 3D measurements of the microvasculature(Minnich and Lametschwandtner, 2000). This is clearly an important issue as a number of studies and clinical assays rely on two-dimensional tissue sections for measuring vascular morphology(Pavlopoulos et al., 1998).
Xenografts are commonly used as analogues for patient tumours. In this study we compared the microvasculature of clinical tissue from human normal mucosa, carcinoma and adenoma, with two xenograft lines commonly used in the study of angiogenesis and antivascular therapies. The xenografts were selected to represent different clinical situations: (i) LS147T - a moderate-to-poorly differentiated tumour (Pedley et al., 2002;Sharma et al., 2005), and (ii) SW1222 - a well differentiated xenograft (El Emir et al, 2007) forming regular glands (Fig. 1 A and B). Vascular distribution is highly heterogeneous in LS147T, but less so in SW1222, where vessels are seen throughout the tumour. Hypoxic regions are observed in both xenografts, but these regions are more extensive in LS147T than in SW1222 tumours. Many of these aspects are important in the response to therapy, as detailed in the study by El-Emir et al. (El-Emir et al., 2007).
Fig. 1.

Xenograft histology
Scanning electron micrographs (SEM) can provide particularly high resolution images of tumour corrosion casts. Using a parallax pair of SEM images with a know tilt angle, three-dimensional measures of linear distances and angles can be made(Fait et al., 1998; Konerding et al., 2001; Malkusch et al., 1995; Skinner et al., 1990; Steinberg et al., 1989). Measurements were calculated as a function of equivalent pairs of x-y coordinates on each image. Linear distances and angles were calculated using two and three pairs of points respectively. Using this method, Konerding et al. measured inter-vessel distance, inter-branch distance, mean vessel diameter, vessel diameter and branching angle of tumour corrosion casts (Konerding et al., 2001; Konerding et al., 1999; Konerding et al., 1995). The different distributions of each measured parameter capture the distinct features of the vascular structures in each tumour or tumour region. SEM micrographs of corrosion casts are ideal for evaluating vessel surface detail on corrosion casts. However stereo-imaging only preserves partial three-dimensional structure of the cast, and it cannot be used to determine aspects such as the topology of the vascular network because measurements are limited to vessels within line-of-sight. For more sophisticated structural analysis a truly three-dimensional method is required. Here we show that micro-computed tomography can be used to provide precisely this type of information.
Micro-computed tomography or `micro-CT' is an X-ray imaging technique similar in principle to the `computed (axial) tomography' (CT or CAT). However, as the name implies, micro-CT scanning resolution is increased by several orders of magnitude, and resolutions are currently possible as low as 50 nm (Tkachuk et al., 2007;Xradia Inc., 2009). Micro-CT datasets present the possibility of measuring tortuosity of the tumour microvasculature in three-dimensions. Although this property of tumour vessels is frequently observed in the literature(Gerhardt et al., 2003;Konerding, 2006;Konerding et al., 2001;Konerding et al., 1999), the quantification of this aspect of vasculature is limited to only a few studies such as (Bullitt et al., 2004;Bullitt et al., 2003a;Bullitt et al., 2005;Tozer et al., 2005a).
Previous studies have utilised micro-CT with a range of other contrast agents in tumours (Savai et al., 2009; Maehara, 2003) and normal tissues (Bentley et al., 2002; Jorgensen et al., 1998), in the current study we have uniquely obtained data on diverse aspects of the microvasculature using both SEM stereo imaging and micro-CT. This paper discusses the benefits and limitations of each system.
Materials and Methods
Animal Material
6 LS147T and 6 SW1222 xenografts derived from human colorectal carcinomas were grown subcutaneously in the flanks of female nude (nu/nu, MF1) mice (average mouse weight ± Standard Deviation of 30.25 ± 2.41g LS147T and 26.35 ± 1.71g SW1222). The United Kingdom Coordinating Committee on Cancer Research Guidelines for the Welfare of Animals in Experimental Neoplasia and the Animal (Scientific Procedures) Act 1986 were followed for all animal experiments. Food and water were available ad libitum.
Xenograft Tissue Casting
Xenografts were processed for MERCOX corrosion casting using the protocol described by (Konerding et al., 1999). Average perfused tumour weight ± Standard Deviation was 0.88 ± 0.27g for SW1222 and 0.67 ± 0.28g for LS147T.
Clinical Material
The corrosion casting study included tumour specimens of clinical cancers excised from 20 patients (mean age 66 ± 3, 12 male, 8 female) undergoing surgery for primary adenocarcinoma; additional precancerous adenomas were found in 6 of these patients. Human control tissue from the normal mucosa was taken from a site distal to the tumour region. The carcinoma tissue is subdivided into 3 regions: tumour periphery (tr), luminal tumour surface (tz), and tumour core (tt).
Clinical Tissue Casting
For the clinical tumours, fresh hemi-colonectomy specimens were excised from patients undergoing surgery for colorectal cancer. These clinical samples and MERCOX corrosion casts were obtained in collaboration with Moritz Konerding and colleagues in accordance with methods described by (Konerding et al., 2001).
Stereoimaging
Stereo-imaging and 3D morphometry were carried out using previously described methods (Konerding et al., 2001;Konerding et al., 1999). All clearly visible vessels in the plane of view were measured for each of the four morphological parameters.
Statistical analysis
The total number of measurements varied across each tissue type, equal sized dataset were generated by sampling with replacement, with group size being determined by the smallest group for a given parameter: BA (n=827), IBD (n=793), VD (n=1223), IVD (n=979). ANOVA was used to compare tissue sample mean values for each morphometric parameter. A Tukey Honestly Significant Difference (HSD) post hoc test was used to determine confidence intervals and p-values associated with each pairwise comparison using the R statistics package(R Development Core Team, 2009).
Micro-Computed Tomography
Corrosion cast samples for high resolution scans were frozen in water and cut to appropriate sizes, then sublimed in a freeze-drier; this step was necessary to prevent damage to the delicate casts. Prior to scanning, whole or cropped samples of the corrosion casts were fixed to an acrylic sample podium with epoxy adhesive (Araldite, Huntsman Advanced Materials). The casts were scanned in a micro-CT machine (Skyscan 1172, Kartuizersweg, Belgium) with resolutions dependant on the size of the sample. The angular rotation interval of 0.25° was used for all scans. Single sample scanning time was 8–10 hours, with reconstruction on a 5 node cluster taking a further 8–16 hours. Sample sizes varied and determined the maximum scan resolution, with high resolution scans on smaller samples (1 – 2 μm3) and lower resolution scans on whole xenografts (3–4 μm3). Only high resolution scans were used for morphometric analyses and low resolution scans purely for visualisation of whole tumours. Size limits of 2GB for RAW files necessitated an isotropic reduction of resolution, with final resolutions for high resolution scans ranging between 3.4 – 4.8 μm3. Thresholding & postprocessing of the grey-scale images was performed with ImageJ (Rasband, 2006) to yield a binary 8-bit image of segmented vessel and void space. Generation of the binary image resulted in a number of `holes' due to lower polymer density in the axial regions of the cast vessels (and hence a lower grey-scale value) and small localised inhomogeneity in the polymer. These holes were digitally `filled' using an ImageJ hole-filling algorithm. A small distortion around smaller vessels could not be eliminated but was substantially reduced by applying a median filter to the data.
Three-dimensional morphometry included measures for microvascular density (MVD), specific vessel surface area (SSA) and vessel cross-sectional area (Vessel Calibre); all measurements were carried out on the segmented 8-bit datasets. MVD was expressed simply as a ratio of voxels determined to be inside the vessel, divided by the total number of voxels in the cuboid domain. Estimation of SSA was established by counting the number of voxels adjacent to void voxels, divided by the total number of voxels in the cuboid domain. The mean vessel calibre was determined by initially producing a skeleton (medial axis transform) of the 3D vessel geometry and then fitting a spline to the central axis of the skeleton (Hyvaluoma et al., 2007). A surface perpendicular to each point along the spline is then calculated as delimited by the vessel taken to be the void voxel boundary. Three metrics which characterise different aspects of vessel tortuosity were calculated from the segmented vascular structures using the methods described by Bullitt et al. (Bullitt et al., 2004;Bullitt et al., 2003a): (1) Distance Metric (DM) – a ratio between the actual curved path of the segmented vessel and the linear distance between its endpoints, (2) Inflection Count Metric (ICM) – (the sum of the minima of total curvature (inflection points) made by the vessel between its endpoints + 1) multiplied by the DM, and (3) Sum Of Angles Metric (SOAM) – the sum of total curvature between endpoints normalised by the path distance. The process for this analysis involved two steps: (1) semi-automated segmentation of the micro-CT datasets using VTree3D and (2) the tortuosity measurements on these segmented vessels using AnalyseVess3(Bullitt et al., 2003b).
Results
Stereo-imaging results
Distributions of stereo-image measurements collected for each geometrical parameter BA n=827, IBD n=793, vessel diameter VD n=1223 and inter-vessel distance IVD n=979 were analysed to identify significant differences across the vasculature of each tissue. With the exception of the approximately normal distribution seen in the BA, the other three parameters were broadly consistent with a log-normal distribution.
The normal human colonic mucosal capillary plexus is arranged in a pseudo-regular lattice composed of repeating `hexagonal' and `rhomboidal' units (Fig. 2 A). This plexus is directly supplied by arteries that divide within the sub-mucosa to subepithelial capillaries. Blood is subsequently drained from the mucosal capillaries by venules originating immediately under the mucosal surface and leading to the submucosal veins. The regular structure observed in the normal mucosa casts was not preserved in either clinical samples (adenoma or carcinoma) or xenografts. An extensively branched phenotype was observed in the adenoma vascular casts (Fig. 2 B and C). The carcinoma vasculature, particularly in the core samples, exhibited more variability in structure, presenting many of the architectural features commonly associated with tumour vasculature (heterogeneity, tortuosity, fenestrations and blind endings) (Fig. 2 D–F).
Fig. 2.

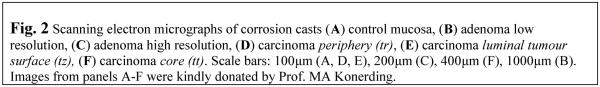
SEM micrographs of clinical casts
Vasculature of the xenograft tumours revealed even greater levels of disorganisation when compared to the clinical tumours (Fig. 3 A–E). The chaotic vascular morphology was a common observation in both xenograft tumours, and provides strong evidence for abnormal blood flow. Examples of this are: disorganised vasculature (Fig. 3 A), aberrant matting of vessels sprouting off a larger axial vessel (Fig. 3 B), differences in vascular morphology at the xenograft periphery and core (Fig. 3 C), and evidence of porous vasculature of xenografts indicated by the interstitial extrusion of large quantities of the casting polymer to form amorphous structures between the cast vessels (Fig. 3 D). Anomalies in the local vessel morphology include flattened vessels, a feature which is consistent with compressive forces exerted by the tumour cells, and elevated interstitial pressure. Aberrant connectivity of vessels was also evident (Fig. 3 E); here connection of an arteriole to a venule with no discernable intervening capillaries is shown. Arterial vessels can be identified by the shape of oblong endothelial cell nuclei imprints in the cast polymer, whereas the venule endothelial nuclei indentations are rounded (Fait et al., 1998).
Fig. 3.

SEM micrographs of xenograft casts
Branching angle
As observed in experiments by Gerhardt et al.(Gerhardt et al., 2003;Ruhrberg et al., 2002), nascent vessel sprouts are misguided by a loss of normal angiogenic factor patterning and gradient in tumours. It was therefore anticipated that aberrant sprout guidance would manifest itself by increased heterogeneity in the BA. From the measured data, a range of mean BA between (73.31°±33.57 carcinoma-core tt) and (87.14°±29.10 control) was observed (Fig. 4 A). The mean BA of each tumour/region differed significantly from the control mucosa with the exception of SW1222. The greatest difference in BA for the tumour tissues was seen in the carcinoma core (tt) and the SW1222 xenograft (Fig. 4 A/Table 1).
Fig. 4.

Distributions of SEM measurements
Table 1.
P-values associated with tissue comparisons
| Tissue Comparison: Mean Value Difference | Tukey HSD P-Values | |||
|---|---|---|---|---|
| BA | IBD | VD | IVD | |
| Carcinoma_p-Adenoma | 2.33E-03 | 2.98E-07 | <0.001 | 1.93E-11 |
| Carcinoma_tr-Adenoma | 1.32E-02 | 1.17E-02 | <0.001 | 9.15E-04 |
| Carcinoma_tz-Adenoma | 1.49E-03 | <0.001 | 1.22E-03 | 1.93E-11 |
| Carcionma_tt-Adenoma | 9.74E-01 | <0.001 | <0.001 | 1.93E-11 |
| Control-Adenoma | 2.24E-07 | 4.24E-01 | 1.32E-09 | 1.93E-11 |
| LS147T-Adenoma | >0.999 | 1.35E-03 | <0.001 | 1.07E-03 |
| SW1222-Adenoma | 1.27E-01 | <0.001 | <0.001 | 1.93E-11 |
| Carcinoma_tr-Carcinoma_p | >0.999 | <0.001 | 7.30E-01 | 1.93E-11 |
| Carcinoma_tz-Carcinoma_p | >0.999 | 1.06E-01 | 2.12E-07 | 1.24E-01 |
| Carcionma_tt-Carcinoma_p | 7.01E-02 | <0.001 | <0.001 | 1.93E-11 |
| Control-Carcinoma_p | 1.05E-12 | <0.001 | <0.001 | 4.55E-08 |
| LS147T-Carcinoma_p | 7.31E-03 | 7.01E-01 | 5.35E-01 | 1.93E-11 |
| SW1222-Carcinoma_p | 1.25E-09 | <0.001 | <0.001 | 9.19E-01 |
| Carcinoma_tz-Carcinoma_tr | 9.99E-01 | <0.001 | 8.79E-04 | 1.93E-11 |
| Carcionma_tt-Carcinoma_tr | 2.18E-01 | <0.001 | <0.001 | 1.93E-11 |
| Control-Carcinoma_tr | 1.06E-12 | 8.59E-01 | <0.001 | 1.93E-11 |
| LS147T-Carcinoma_tr | 3.50E-02 | 9.53E-13 | >0.999 | >0.999 |
| SW1222-Carcinoma_tr | 2.52E-08 | <0.001 | <0.001 | 1.93E-11 |
| Carcionma_tt-Carcinoma_tz | 5.12E-02 | <0.001 | <0.001 | 1.93E-11 |
| Control-Carcinoma_tz | 1.05E-12 | <0.001 | <0.001 | 1.88E-02 |
| LS147T-Carcinoma_tz | 4.86E-03 | 2.51E-04 | 2.89E-03 | 1.93E-11 |
| SW1222-Carcinoma_tz | 5.94E-10 | <0.001 | <0.001 | 2.11E-03 |
| Control-Carcionma_tt | 3.76E-10 | <0.001 | <0.001 | 1.94E-11 |
| LS147T-Carcionma_tt | 9.97E-01 | <0.001 | <0.001 | 1.93E-11 |
| SW1222-Carcionma_tt | 5.63E-03 | 2.79E-06 | <0.001 | 1.93E-11 |
| LS147T-Control | 3.67E-08 | 2.53E-08 | <0.001 | 1.93E-11 |
| SW1222-Control | 4.20E-02 | <0.001 | <0.001 | 2.95E-11 |
| SW1222-LS147T | 5.74E-02 | <0.001 | <0.001 | 1.93E-11 |
Table 1 Pairwise comparison of microvascular distributions for 5 tissues across 4 SEM morphometric parameters (branching angle BA, inter branch distance IBD, vessel diameter VD and inter vessel distance IVD). The carcinoma tissue is further subdivided into 4 groups as specified in the Methods). P-values reported by the statistical computation as 1 or 0 are reported here as >0.999 and <0.001 respectively. Full results are provided in supplementary Tables S2–5 and graphically in Fig. S1.
Inter-branch distance
Insight into the vessel density in each tissue sample was provided by distributions of IBD. In carcinoma samples, the border region between normal and tumour tissue (i.e. the carcinoma periphery samples) demonstrated the highest angiogenic activity, determined by increased sprout formation and vascular density. As the vessels sprout more frequently so the distances between each sprout diminishes, resulting in a reduced mean IBD (Fig. 4 B). Due to their relatively small size, xenografts and adenomas were not analysed by region, but a visual inspection of the SEM images of these casts confirm smaller IBDs were also present in the peripheral regions of both LS147T and SW1222 (Fig. 3 C). Mean IBDs in control, adenoma and carcinoma periphery (tr) were not significantly different from each other (Table 1). Carcinoma regions showed a significant increase in both luminal surface (tz) and periphery (tr) to the carcinoma core (tt) (Fig. 4 B). In the case of the tumour core, reduced vessel density and sprout formation result in longer distances between bifurcations. Mean IBD for SW1222 is significantly larger than the pooled carcinoma (p) and adenoma. By comparison, LS174T is not significantly different to the pooled carcinoma (p) but is significantly different to the adenoma, although this difference is small (Table 1).
Vessel diameter
One clear difference in the VD distributions was the range of variability in this parameter. This can be seen to increase from the carcinoma margins (both periphery(tr) and luminal surface(tz)) through to the inner core region, where the spread of diameter was largest (Fig. 4 C). This larger core vascular size is also seen in the xenografts (Fig. 3 C). Mean VD for SW1222, but not LS17T, showed a significant increase compared to both the clinical Adenoma and Carcinoma (p) (Table 1).
Inter-vessel distance
Although the IVD does not directly contribute to the haemodynamical properties of the tumour vascular system, it is nevertheless an important attribute in determining tissue hypoxia, and it is also an indicator of local metabolic burden of the tumour tissue (Hlatky et al., 2002). Increased variability in this parameter was observed in the tumour tissues when compared to the normal mucosa samples, which had a very narrow range for this parameter. IVD shows a lower vessel density in the core relative to the peripheral carcinoma samples (Fig. 4 D). For this parameter, it appears that LS174T is significantly different from the clinical carcinoma (p), while SW1222 shows no significant difference; both xenografts are significantly different from the adenoma IBD (Table 1).
X-ray microcomputed tomography results
From 3–6 block volumes of each tissue type, we performed measurements on the tortuosity and relative microvascular density and vessel surface area. For the tortuosity part of the analysis the total number of measured vessels for each tissue type was: Control Mucosa (n=1244), Adenoma (n=1349), Carcinoma (n=1367), LS147T (n=1614) and SW1222 (n=3132). A visual inspection of the high resolution dataset renderings from clinical samples of control mucosa, adenoma and carcinoma all showed greater consistency in branching hierarchy and organisation than the xenograft datasets LS147T and SW1222 (Fig. 5 A – E). At low resolution, scans of LS147T and SW1222 (Fig. 5 D and E) reproduce the overall structure of these casts. Unlike SEM stereoimages, these rendered structures could be `virtually sliced' to reveal the internal cast structure; in particular the SW1222 peripheral regions exhibit domains of extremely high vascular density (Fig. 5 E). Both xenografts were grown under identical conditions, suggesting differential cellular environments in the tumours were primarily responsible for the observed vascular morphologies.
Fig. 5.


Micro-CT volume rendering of tumour vascular casts
Analysis of the micro-CT data was carried out to determine quantitative differences between the vessel architectures. The mean vessel cross-sectional area (vessel calibre), microvascular density (MVD) and specific-surface area (SSA) were determined directly from the data. Additionally, three tortuosity metrics (DM, ICM and SOAM) were also determined from the semi-automatically segmented datasets. Distributions of each metric are shown in (Fig. 6 A–F). Vessel calibre distributions for adenoma showed the lowest variability, due to their well preserved branching structure. Mean vessel calibre (μm2) can be seen to increase from carcinoma (5.70E+02) → LS147T (8.20E+02) → SW1222 (1.69E+03), with SW1222 considerably larger than the other tissues (Fig. 6 A). These calibre measures are largely in agreement with SEM measures of vessel diameter VD (Fig. 3 C). Mean MVD (Fig. 6 B) is also elevated in SW1222 tumours (0.25) compared with the other tissues: control mucosa (0.13), adenoma (0.049), carcinoma (0.051) tissue) and LS147T (0.08). The high MVD seen in SW1222 was mainly due to the highly vascularised peripheral zone in this xenograft. MVD and SSA both show similarity in the shape of their distributions in each tissue. Measurements made on the SSA (Fig. 6 C) were particularly variable in the LS147T and SW1222 tissues, with the clinical samples more uniform in this parameter. The SSA of SW1222 was generally higher, due to the combination of greater MVD and higher calibre vessels.
Fig. 6.

Distributions of micro-CT measurements
The three measures used to describe vessel tortuosity displayed quite different results (Fig. 6 D–F), but in each case SW1222 samples registered among the most tortuous. However, ICM does consistently measure higher in SW1222 samples (Fig. 6 D), which on visual inspection could be qualitatively deemed the more tortuous.
The graphical renderings of the tumour vascular corrosion casts and the quantitative analysis show that the architecture of the LS147T vessels and those of the carcinoma are similar in many details: branching angle, IVD, VD, cross-sectional area, and vessel density. The SW1222 xenograft is significantly different from both LS147T and the clinical samples in most aspects.
Discussion
In this study both stereo-imaging and micro-CT were used to provide qualitative and quantitative data on the structure and properties of vascular corrosion casts from xenografts and colorectal tumours. This gave insight into the similarities and differences between two human xenografts and the clinical tumours they represent. Here the application of micro-CT proved to be an excellent method for studying the three-dimensional structure and properties of corrosion casts. It should be noted that vessels in the context of corrosion casts relate to a cast of the vessel lumen space and not the actual vessel (which includes additional layers of cells and proteins).
A normal distribution shape was only observed for BA in all samples. The mean BA of tumour tissues was shown to be significantly different to normal human mucosa in all tumours except SW1222. It is possible that branching angles once deregulated in tumours are free to diverge from the ordered pattern of the mucosal vasculature. However, this divergence is limited by a physical constraint such as shear stress, acting to inhibit extremes of branching during angiogenesis. It is also interesting to note that the mean BAs for carcinoma and adenoma are significantly different, though the magnitude is small. A prior study by Pavlopoulos et al. reported that “branching counts are significantly higher” in carcinoma compared with adenoma (Pavlopoulos et al., 1998). In their study, bifurcation density was determined by the number of ramifications per 100 sections. The stereoimaging analysis of IBD showed that this may only be true in the carcinoma periphery (tr); (Fig. 4 B/Table 1) shows IBD in the pooled carcinoma data (p), carcinoma luminal tumour surface (tz), and core were all significantly higher than in the adenoma, and consequently these samples have a lower branching frequency. However, as no delineation was made between the different carcinoma regions in the study by Pavlopulos et al. it was not possible to establish whether their conclusion was due to the regions of carcinoma tissue selected or the limitations of the two-dimensional method used to evaluate branching density. VD from stereoimaging and cross-sectional area metric from micro-CT were both used to gauge vessel size. The vessels in the corrosion casts are not regular in circumference and should not be assumed cylindrical. So the linear definition of vessel calibre as measured by stereo-imaging is therefore less reliable than measuring vessel calibre using a surface perpendicular to the axis of the vessel. Both measures indicate that SW1222 tumours displayed much wider vessels than LS147T, whereas LS147T were more closely matched to clinical tumours. In this study, as no measurements such as oncotic pressure or vessel maturation were made, it is difficult to give precise reasons why the vessels in SW1222 were larger. It was known prior to analysis that SW1222 tumours were more differentiated than the LS147T line (EL-Emir et al., 2007), and these morphological variations are likely to have determined the differences in vascular structure between the two xenografts.
Microvascular density (MVD) and inter-vessel distance (IVD) were both used to estimate the local quantity of vascular tissue. MVD is an important property of tumours, affecting nutrient and drug delivery. The SEM images provide excellent qualitative information of the cast surface detail; however IVD only provides a crude estimation of the MVD parameter. Firstly, it is based on point-to-point measures of linear distance between vessels, giving rise to some degree of operator bias in point selection. Secondly, the scanning electron micrographs restrict measurement to the line-of-sight, rendering vessels in the background unmeasurable. By contrast micro-CT MVD measurements do not suffer the same limitations, and provide a truly volumetric measure of density with minimal operator bias. MVD was highest in SW1222 tumours, with all but one sample registering above the maximum value found for the clinical and control tissues. Greater MVD in the SW1222 tumours by comparison to LS147T could explain the improved response to therapy in this tumour line (El-Emir et al., 2007;Sharma et al., 2005).
A further advantage of micro-CT is the capacity to measure aspects of the vessel architecture not possible using SEM stereo-imaging. An example of this is specific vessel surface area (SSA). SSA improves on MVD as a measure for defining the transport capacity of vascular tissue, as it is directly dependent on the calibre of vessels in the volume, whereas the MVD is ambiguous in this respect. The vessel SSA mapped fairly closely to the MVD in most tissues. The exception here was the LS147T tumours, where the SSA area was relatively larger; this was due to a greater abundance of smaller vessels in some of the LS147T samples.
Microvascular tortuosity is of particular interest in the field of anti-angiogenesis/vascular therapy, as some of these treatments have been shown to produce a reduction in vessel tortuosity (Jain, 2001). This process, termed `vascular renormalisation', is evident in the use of anti-angiogenesis antibodies, such as DC101 (Qayum et al., 2009;Tong et al., 2004). Much of the prior work on microvascular tortuosity was focused on specific tissues such as mesentery and retina which are convenient since these vessels grow as a planar two-dimensional layer(Bidiwala et al., 1998). Outside this limited context, to date, examples include the use of reconstructed physical sections (Kay et al., 1998), while multi-photon microscopy on window chambers has enabled the calculation of tumour microvascular tortuosity from three-dimensional data (Tozer et al., 2005a), though the normal tumour growth is restricted.
Tozer et al. used a single metric which represents the distance metric aspect of tortuosity. A broader approach to quantifying tortuosity as specified by (Bullitt et al., 2003a) involved using a semi-automated software application to compute vessel tortuosity from Magnetic Resonance Angiography (MRA). The method was adapted here by simply substituting the MRA datasets with binarized micro-CT datasets. Although reasonably homogeneous, it should however be noted that the datasets used were not of identical resolution, with a maximum of 1.4μm3 between the highest and lowest resolutions (Table S6 and S7); it is suggested that this may have affected the results of the SOAM metric. Tortuosity measures for the control and clinical tissues were generally similar in magnitude. ICM was elevated in all samples of SW1222, as shown in the cast stereo-images and volume renderings. These tumour vessels form highly dense networks with a tightly packed structure that necessitates a higher frequency of curves. Tozer et al. also found that DM is an ineffective discriminator of vessel tortuosity for purpose of differentiating between the vasculature of two tumour types (Tozer et al., 2005a). The problem with DM as a measure of vessel tortuosity is that it is purely the ratio between effective and linear distances. It is, for example, unable to differentiate between a highly sinusoidal vessel and one with a gentler but larger curvature, where both vessels have identical effective and linear distances. Deloid et al. suggest that each of DM, ICM and SOAM are limited in their ability to independently capture all aspects of tortuosity, and a measure combining the SOAM and DM may be more appropriate (DeLoid et al., 2005).
In relation to the question of which xenograft provided the closest approximation of clinical carcinoma vascular architecture for the parameters studied, LS147T was a closer match than SW1222, particularly in respect of IBD and VD; for both these parameters the LS147T (but not SW1222) value was not significantly different to the carcinoma. The only disagreement to this trend was the IVD, where SW1222 was closer to the pooled carcinoma mean value. In the case of BA, both LS147T and SW1222 are significantly different to the pooled carcinoma mean value, although for LS147T the difference is smaller. The homology of LS147T over SW1222 to the carcinoma is also replicated in the micro-CT study where, with the exception of the SOAM, mean values are more similar to the carcinoma tissue, although significance testing was not carried out.
In conclusion, stereoimaging gives better surface detailed resolution of the corrosion casts, whereas more aspects of the vascular architecture can be measured with micro-CT. Comparisons made between the two xenografts and clinical tumours clearly show that the LS147T xenograft shared many similarities with the clinical tumour vasculature, while the SW1222 showed significant differences in many of the parameters studied. We propose that the combination of stereoimaging and micro-CT provides a superior method of selecting the most structurally appropriate pre-clinical models for the investigation and optimisation of clinical anti-vascular therapy.
Supplementary Material
Acknowledgements
The authors would like to thank Markko Myllys, University of Jyväskylä, for his assistance in generating the corrosion cast micro-CT images; Professor Elizabeth Bullitt, University of North Carolina for her help with the tortuosity analysis, and Mathew Robson for excellent technical help. Funded by Cancer Research UK grant C34/A5149, European Union Seventh Framework Program grant 201342 ADAMANT, and King's College London and UCL Comprehensive Cancer Imaging Centre CR-UK & EPSRC, in association with the MRC and DoH (England).
Footnotes
Publisher's Disclaimer: This is a PDF file of an unedited manuscript that has been accepted for publication. As a service to our customers we are providing this early version of the manuscript. The manuscript will undergo copyediting, typesetting, and review of the resulting proof before it is published in its final citable form. Please note that during the production process errors may be discovered which could affect the content, and all legal disclaimers that apply to the journal pertain.
Supplementary Material Example movies showing rotations of vascular corrosion casts x-ray microcomputed tomography generated by volume rendering.
Movie1 – movie of LS147T Xenograft.
Movie2 – movie of SW1222 Xenograft.
Movie3 – movie of a clinical colorectal carcinoma volume.
REFERENCES
- Belien JA, van Diest PJ, Baak JP. Relationships between vascularization and proliferation in invasive breast cancer. J. Pathol. 1999;189:309–318. doi: 10.1002/(SICI)1096-9896(199911)189:3<309::AID-PATH457>3.0.CO;2-0. [DOI] [PubMed] [Google Scholar]
- Bentley MD, Ortiz MC, Ritman EL, Romero JC. The use of microcomputed tomography to study microvasculature in small rodents. Am. J. Physiol Regul. Integr. Comp Physiol. 2002;282:R1267–R1279. doi: 10.1152/ajpregu.00560.2001. [DOI] [PubMed] [Google Scholar]
- Bidiwala SB, Mansour MS, Stengel CK, Klein SA, Carroll SM, Koenig SC, Desoky AH, Tobin GR, Maldonado C, Barker JH. Quantification of the morphological features of a full microvascular network. Med. Biol. Eng Comput. 1998;36:621–626. doi: 10.1007/BF02524434. [DOI] [PubMed] [Google Scholar]
- Bullitt E, Ewend MG, Aylward S, Lin W, Gerig G, Joshi S, Jung I, Muller K, Smith JK. Abnormal vessel tortuosity as a marker of treatment response of malignant gliomas: preliminary report. Technol. Cancer Res. Treat. 2004;3:577–584. doi: 10.1177/153303460400300607. [DOI] [PMC free article] [PubMed] [Google Scholar]
- Bullitt E, Gerig G, Pizer SM, Lin W, Aylward SR. Measuring tortuosity of the intracerebral vasculature from MRA images. IEEE Trans. Med. Imaging. 2003a;22:1163–1171. doi: 10.1109/TMI.2003.816964. [DOI] [PMC free article] [PubMed] [Google Scholar]
- Bullitt E, Gerig G, Pizer SM, Lin W, Aylward SR. Tortuosity Analysis Software: VTree3D and AnalyseVess3. 2003b. [Google Scholar]
- Bullitt E, Zeng D, Gerig G, Aylward S, Joshi S, Smith JK, Lin W, Ewend MG. Vessel tortuosity and brain tumor malignancy: a blinded study. Acad. Radiol. 2005;12:1232–1240. doi: 10.1016/j.acra.2005.05.027. [DOI] [PMC free article] [PubMed] [Google Scholar]
- DeLoid G, Trivedi N, Lai J, Dickie R, Rogers RA. A Metric for Quantitative Analysis of Vascular Tortuosity. Microsc Microanal. 2005;11(S02):1022–1023. [Google Scholar]
- Dickie R, Bachoo RM, Rupnick MA, Dallabrida SM, Deloid GM, Lai J, Depinho RA, Rogers RA. Three-dimensional visualization of microvessel architecture of whole-mount tissue by confocal microscopy. Microvasc. Res. 2006;72:20–26. doi: 10.1016/j.mvr.2006.05.003. [DOI] [PubMed] [Google Scholar]
- El-Emir E, Qureshi U, Dearling JL, Boxer GM, Clatworthy I, Folarin AA, Robson MP, Nagl S, Konerding MA, Pedley RB. Predicting response to radioimmunotherapy from the tumor microenvironment of colorectal carcinomas. Cancer Res. 2007;67:11896–11905. doi: 10.1158/0008-5472.CAN-07-2967. [DOI] [PubMed] [Google Scholar]
- Fait E, Malkusch W, Gnoth SH, Dimitropoulou Ch, Gaumann A, Kirkpatrick CJ, Junginger Th., Konerding M. Microvascular patterns of the human large intestine: morphometric studies of vascular parameters in corrosion casts. Scanning Microscopy. 1998;12:641–651. [Google Scholar]
- Gerhardt H, Golding M, Fruttiger M, Ruhrberg C, Lundkvist A, Abramsson A, Jeltsch M, Mitchell C, Alitalo K, Shima D, Betsholtz C. VEGF guides angiogenic sprouting utilizing endothelial tip cell filopodia. J. Cell Biol. 2003;161:1163–1177. doi: 10.1083/jcb.200302047. [DOI] [PMC free article] [PubMed] [Google Scholar]
- Gulubova M, Vlaykova T. Prognostic significance of mast cell number and microvascular density for the survival of patients with primary colorectal cancer. J. Gastroenterol. Hepatol. 2009;24:1265–1275. doi: 10.1111/j.1440-1746.2007.05009.x. [DOI] [PubMed] [Google Scholar]
- Hlatky L, Hahnfeldt P, Folkman J. Clinical application of antiangiogenic therapy: microvessel density, what it does and doesn't tell us. J. Natl. Cancer Inst. 2002;94:883–893. doi: 10.1093/jnci/94.12.883. [DOI] [PubMed] [Google Scholar]
- Hyvaluoma J, Turpeinen T, Raiskinmaki P, Jasberg A, Koponen A, Kataja M, Timonen J, Ramaswamy S. Intrusion of nonwetting liquid in paper. Phys. Rev. E Stat. Nonlin. Soft. Matter Phys. 2007;75:036301. doi: 10.1103/PhysRevE.75.036301. [DOI] [PubMed] [Google Scholar]
- Jain RK. Normalizing tumor vasculature with anti-angiogenic therapy: a new paradigm for combination therapy. Nat. Med. 2001;7:987–989. doi: 10.1038/nm0901-987. [DOI] [PubMed] [Google Scholar]
- Jorgensen SM, Demirkaya O, Ritman EL. Three-dimensional imaging of vasculature and parenchyma in intact rodent organs with X-ray micro-CT. Am. J. Physiol. 1998;275:H1103–H1114. doi: 10.1152/ajpheart.1998.275.3.H1103. [DOI] [PubMed] [Google Scholar]
- Kay PA, Robb RA, Bostwick DG. Prostate cancer microvessels: a novel method for three-dimensional reconstruction and analysis. Prostate. 1998;37:270–277. doi: 10.1002/(sici)1097-0045(19981201)37:4<270::aid-pros9>3.0.co;2-v. [DOI] [PubMed] [Google Scholar]
- Konerding MA. In: Tumor vs normal microvasculature. Shepro D, editor. Encyclopedia of Microvascular Research: Biology and Pathology Academic Press/Elsevier Science; San Diego - Amsterdam: 2006. pp. 955–960. [Google Scholar]
- Konerding MA, Fait E, Gaumann A. 3D microvascular architecture of pre-cancerous lesions and invasive carcinomas of the colon. Br. J. Cancer. 2001;84:1354–1362. doi: 10.1054/bjoc.2001.1809. [DOI] [PMC free article] [PubMed] [Google Scholar]
- Konerding MA, Malkusch W, Klapthor B, van Ackern C, Fait E, Hill SA, Parkins C, Chaplin DJ, Presta M, Denekamp J. Evidence for characteristic vascular patterns in solid tumours: quantitative studies using corrosion casts. Br. J. Cancer. 1999;80:724–732. doi: 10.1038/sj.bjc.6690416. [DOI] [PMC free article] [PubMed] [Google Scholar]
- Konerding MA, Miodonski AJ, Lametschwandtner A. Microvascular corrosion casting in the study of tumor vascularity: a review. Scanning Microsc. 1995;9:1233–1243. [PubMed] [Google Scholar]
- Maehara N. Experimental microcomputed tomography study of the 3D microangioarchitecture of tumors. Eur. Radiol. 2003;13:1559–1565. doi: 10.1007/s00330-002-1729-z. [DOI] [PubMed] [Google Scholar]
- Malcontenti-Wilson C, Muralidharan V, Skinner S, Christophi C, Sherris D, O'Brien PE. Combretastatin A4 prodrug study of effect on the growth and the microvasculature of colorectal liver metastases in a murine model. Clin. Cancer Res. 2001;7:1052–1060. [PubMed] [Google Scholar]
- Malkusch W, Konerding MA, Klapthor B, Bruch J. A simple and accurate method for 3-D measurements in microcorrosion casts illustrated with tumour vascularization. Anal. Cell Pathol. 1995;9:69–81. [PubMed] [Google Scholar]
- Minardi D, Lucarini G, Filosa A, Milanese G, Zizzi A, Di PR, Montironi R, Muzzonigro G. Prognostic role of tumor necrosis, microvessel density, vascular endothelial growth factor and hypoxia inducible factor-1alpha in patients with clear cell renal carcinoma after radical nephrectomy in a long term follow-up. Int. J. Immunopathol. Pharmacol. 2008;21:447–455. doi: 10.1177/039463200802100225. [DOI] [PubMed] [Google Scholar]
- Minnich B, Lametschwandtner A. Lengths measurements in microvascular corrosion castings: two-dimensional versus three-dimensional morphometry. Scanning. 2000;22:173–177. doi: 10.1002/sca.4950220305. [DOI] [PubMed] [Google Scholar]
- Pavlopoulos PM, Konstantinidou AE, Agapitos E, Kavantzas N, Nikolopoulou P, Davaris P. A morphometric study of neovascularization in colorectal carcinoma. Cancer. 1998;83:2067–2075. [PubMed] [Google Scholar]
- Pedley RB, El Emir E, Flynn AA, Boxer GM, Dearling J, Raleigh JA, Hill SA, Stuart S, Motha R, Begent RH. Synergy between vascular targeting agents and antibody-directed therapy. Int. J. Radiat. Oncol. Biol. Phys. 2002;54:1524–1531. doi: 10.1016/s0360-3016(02)03923-8. [DOI] [PubMed] [Google Scholar]
- Qayum N, Muschel RJ, Im JH, Balathasan L, Koch CJ, Patel S, McKenna WG, Bernhard EJ. Tumor vascular changes mediated by inhibition of oncogenic signaling. Cancer Res. 2009;69:6347–6354. doi: 10.1158/0008-5472.CAN-09-0657. [DOI] [PMC free article] [PubMed] [Google Scholar]
- R Development Core Team . R: A Language and Environment for Statistical Computing. 2009. [Google Scholar]
- Rasband WS. ImageJ 1.36B. 2006. [Google Scholar]
- Ruhrberg C, Gerhardt H, Golding M, Watson R, Ioannidou S, Fujisawa H, Betsholtz C, Shima DT. Spatially restricted patterning cues provided by heparin-binding VEGF-A control blood vessel branching morphogenesis. Genes Dev. 2002;16:2684–2698. doi: 10.1101/gad.242002. [DOI] [PMC free article] [PubMed] [Google Scholar]
- Salmon HW, Mladinich C, Siemann DW. Evaluations of vascular disrupting agents CA4P and OXi4503 in renal cell carcinoma (Caki-1) using a silicon based microvascular casting technique. Eur. J. Cancer. 2006;42:3073–3078. doi: 10.1016/j.ejca.2006.06.016. [DOI] [PubMed] [Google Scholar]
- Savai R, Langheinrich AC, Schermuly RT, Pullamsetti SS, Dumitrascu R, Traupe H, Rau WS, Seeger W, Grimminger F, Banat GA. Evaluation of angiogenesis using micro-computed tomography in a xenograft mouse model of lung cancer. Neoplasia. 2009;11:48–56. doi: 10.1593/neo.81036. [DOI] [PMC free article] [PubMed] [Google Scholar]
- Sharma SK, Pedley RB, Bhatia J, Boxer GM, El Emir E, Qureshi U, Tolner B, Lowe H, Michael NP, Minton N, Begent RH, Chester KA. Sustained tumor regression of human colorectal cancer xenografts using a multifunctional mannosylated fusion protein in antibody-directed enzyme prodrug therapy. Clin. Cancer Res. 2005;11:814–825. [PubMed] [Google Scholar]
- Skinner SA, Tutton PJ, O'Brien PE. Microvascular architecture of experimental colon tumors in the rat. Cancer Res. 1990;50:2411–2417. [PubMed] [Google Scholar]
- Steinberg F, Konerding M, Donhuijsen K, Budach V, Streffer C. Investigations on the individuality of tumours from 20 xenotransplanted sarcomas on nude mice. Strahlenther. Onkol. 1989;165:504–505. [PubMed] [Google Scholar]
- Tkachuk A, Duewer F, Cui H, Feser M, Wang S, Yun W. X-ray computed tomography in Zernike phase contrast mode at 8 keV with 50-nm resolution using Cu rotating anode X-ray source. Zeitschrift für Kristallographie. 2007;222:650–655. [Google Scholar]
- Tong RT, Boucher Y, Kozin SV, Winkler F, Hicklin DJ, Jain RK. Vascular normalization by vascular endothelial growth factor receptor 2 blockade induces a pressure gradient across the vasculature and improves drug penetration in tumors. Cancer Res. 2004;64:3731–3736. doi: 10.1158/0008-5472.CAN-04-0074. [DOI] [PubMed] [Google Scholar]
- Tozer GM. Measuring tumour vascular response to antivascular and antiangiogenic drugs. Br. J. Radiol. 2003;76(Suppl 1):S23–S25. doi: 10.1259/bjr/30165281. [DOI] [PubMed] [Google Scholar]
- Tozer GM, Ameer-Beg SM, Baker J, Barber PR, Hill SA, Hodgkiss RJ, Locke R, Prise VE, Wilson I, Vojnovic B. Intravital imaging of tumour vascular networks using multi-photon fluorescence microscopy. Adv. Drug Deliv. Rev. 2005a;57:135–152. doi: 10.1016/j.addr.2004.07.015. [DOI] [PubMed] [Google Scholar]
- Tozer GM, Kanthou C, Baguley BC. Disrupting tumour blood vessels. Nat. Rev. Cancer. 2005b;5:423–435. doi: 10.1038/nrc1628. [DOI] [PubMed] [Google Scholar]
- Tozer GM, Prise VE, Wilson J, Cemazar M, Shan S, Dewhirst MW, Barber PR, Vojnovic B, Chaplin DJ. Mechanisms associated with tumor vascular shut-down induced by combretastatin A-4 phosphate: intravital microscopy and measurement of vascular permeability. Cancer Res. 2001;61:6413–6422. [PubMed] [Google Scholar]
- Xradia Inc . Xradia nanoXCT. 2009. [Google Scholar]
- Yildiz E, Ayan S, Goze F, Gokce G, Gultekin EY. Relation of microvessel density with microvascular invasion, metastasis and prognosis in renal cell carcinoma. BJU. Int. 2008;101:758–764. doi: 10.1111/j.1464-410X.2007.07318.x. [DOI] [PubMed] [Google Scholar]
Associated Data
This section collects any data citations, data availability statements, or supplementary materials included in this article.