

Abstract
Myelinated axons can conduct sustained trains of impulses at high frequency, but this involves substantial ion movements that must be reversed to restore homeostasis. Little attention has been paid to the potential osmotic consequences of the ion movements or to the pathway taken by sodium ions returning to their original endoneurial location, given that the axolemmal Na+–K+-ATPase extrudes these ions into the periaxonal space beneath the myelin rather than into the endoneurium. Serial confocal imaging of fluorescent axons conducting at sustained physiological frequencies in vivo has revealed surprising morphological changes that may illuminate these problems. Saphenous nerves and spinal roots of anaesthetized transgenic mice expressing axoplasmic yellow fluorescent protein were stimulated electrically or pharmacologically (veratridine). Within 2 h, the axon herniated on one or both sides of the nodal membrane, displacing the paranodal myelin and widening the nodal gap. The herniated axoplasm became directed back towards the internode, forming a ‘cap’ up to 30 μm long. Concurrently, the fluid in the expanded periaxonal space accumulated into droplets that appeared to travel to the paranode, where they escaped. No such alterations occurred in axons treated with sodium channel or Na+–K+-ATPase inhibitors. Remarkably, impulse conduction continued throughout, and all these changes reversed spontaneously over hours or days. The morphological changes were verified ultrastructurally, and occurred in virtually all myelinated axons. The findings appear to reveal an overlooked part of the physiological repertoire of nerve fibres, and here they are interpreted in terms of osmotic changes that may illuminate the pathway by which sodium ions return to the endoneurial space after they have entered the axon during impulse conduction.
Key points
Conduction in myelinated axons involves substantial ion movements that must be reversed to restore homeostasis.
The pathway taken by sodium ions returning to their original location and the potential osmotic consequences are currently unknown.
We report striking morphological changes in axons following sustained impulse conduction that appear to result from osmosis and to indicate accumulation of ions in the periaxonal space followed by their release at the paranode.
We conclude that the morphological changes illustrate a hitherto unrecognized part of normal axonal physiology that may also indicate the return pathway for the sodium ions involved in impulse formation.
Introduction
The normal physiological impulse traffic can require myelinated axons to conduct sustained trains of impulses at more than 100 Hz for hours (Prochazka & Gorassini, 1998). Despite the efficiencies gained by myelination, such impulse activity incurs substantial ion movements, and these have to be reversed over time in order to maintain homeostasis. For example, sodium ions enter the axoplasm at nodes of Ranvier during impulse formation, and the ions have to be pumped back to the extracellular space by the Na+–K+-ATPase (Skou, 1957; Glynn & Karlish, 1975; Koester & Siegelbaum, 1991). An initial assumption that this pump was conveniently located at the node of Ranvier has been challenged by immunohistochemical observations that the pump is located along the internodal axolemma (Mata et al. 1991; McGrail et al. 1991; Alberti et al. 2007; Young et al. 2008). The sodium ions are therefore pumped into the periaxonal space beneath the myelin, rather than into the endoneurial space. This arrangement provides a simple pathway for the restoration of potassium ions (because the major populations of potassium channels are also located along the paranodal and internodal axolemma), but it poses a problem for the return of sodium ions because they now have to negotiate the barrier imposed by the myelin sheath.
Despite the fundamental nature of this problem for our understanding of normal impulse conduction, the route taken by sodium ions after they enter the axon remains a mystery. The simplest pathway would be across the lipid bilayers of the myelin sheath, but it is improbable that charged sodium ions will pass freely across these membranes. Alternatively, the ions may traverse the gap junctions located in the Schmidt-Lanterman incisures (spiral cytoplasmic inclusions of non-compacted myelin; Scherer et al. 1995), but although these structures are common along internodes myelinated by Schwann cells in the peripheral nervous system, they are scarce within the CNS and so are unlikely to provide a universal pathway. Another possibility is that the ions pass to the nodal gap via the complicated junctions at the paranodes, which include the terminal junctions of the loops of myelin onto the paranodal axolemma (Peles & Salzer, 2000). Earlier investigators believed that substantial ion movements across the paranodal junctions were unlikely (Frankenhauser & Hodgkin, 1956; Bunge, 1968), but more recent observations have revealed that the cellular junctions at the paranodes are such that they provide delayed access to the periaxonal space for small molecules, such as lanthanum ions or fluorescent dextrans (Hirano & Dembitzer, 1969; Hall & Williams, 1971; Mierzwa et al. 2010a), demonstrating that diffusion between the extracellular space and the periaxonal space is possible (Mierzwa et al. 2010b; Rosenbluth et al. 2013). Whether this paranodal route is the one taken by sodium ions remains uncertain, given that small charged ions may have access to different pathways from lanthanum or dextran. We have observed morphological changes in response to sustained impulse conduction and interpreted these as indicating the return pathway for sodium ions.
Methods
Mice (n = 32); male and female, 8–12 weeks old, positive or negative for Thy-1-YFP-16 expression (Jackson Laboratories strain designation: B6.Cg-Tg(Thy1-YFP)16Jrs/J) were housed in groups of three or four per cage on a 12 h–12 h light–dark cycle with food and water ad libitum. All experiments were conducted in accordance with the Animals (Scientific Procedures) Act 1986 of the UK Home Office.
In vivo preparations
The saphenous nerve was exposed under general anaesthesia (induction with 5% isoflurane, maintenance with 1.5% isoflurane) and the mouse placed on the modified stage of a confocal microscope (LSM 5 Pascal; Carl Zeiss, Jena, Germany) such that the leg was stabilized on a moulded silicone support. Care was taken not to disturb the vasculature or to damage the epineurium or perineurium. For electrical stimulation, a pair of wire stimulating electrodes (20% iridium, 80% platinum, Teflon-coated except at the tip) were placed on the nerve distally (at the ankle) and attached to an isolated simulator (model DS2; Digitimer Ltd, Welwyn Garden City, England) triggered by a pulse generator (Neurolog system; Digitimer). An ‘active’ platinum wire recording electrode was placed on the nerve at the groin, with an ‘indifferent’ electrode (25 gauge needle) inserted percutaneously close to the recording electrode, and the electrodes were connected to the headstage of a differential AC/DC amplifier (Neurolog; Digitimer). An earth electrode was inserted under the skin of the thigh between the stimulating and recording electrodes. Supramaximal stimuli (0.2 μs duration, 1.5 times maximal) were applied for 1 or 2 h at 20 or 100 Hz, i.e. within the physiological range of some or many of the axons (Prochazka & Gorassini, 1998). Recordings of the averaged (n = 10 records) compound action potentials were viewed and stored every 20 min using a digital oscilloscope (Sigma 60 200 MS/s Digital Oscilloscope; Nicolet Technologies, St. Louis, MO, USA). Before and after the period of high-frequency stimulation, stimuli were applied at 1 Hz and the averaged (n = 10) compound action potentials again stored to monitor the changes over time. The recorded compound action potentials were processed using commercial software (OriginPro 7.5; Origin Lab Corporation, Northampton, MA, USA). Throughout the experiment, all exposed portions of the nerve were prevented from drying using saline. Chemical stimulation was performed by applying veratridine (100 μm) or vehicle (0.67% DMSO in saline) with balls of cotton wool positioned topically on the epineurium for 10 min. After electrical or chemical stimulation, the saphenous nerve was exposed along the whole length of the thigh and a coverslip positioned on the nerve. The preparation was then imaged, in vivo, using a confocal laser-scanning microscope (LSM 5 Pascal; Carl Zeiss; n = 9 axons from each of four animals per protocol) and an image size of 512 × 512 pixels (pixel size of 0.2 μm). Either a single image was recorded every 10 min or a z-stack (serial scans at different focal planes with 0.3 μm separation) was recorded every 20 min, for a period of 5–10 h after stimulation using a ×63 (oil) warmed (37°C) objective. In some experiments, the wounds were closed immediately after stimulation, and the animal was allowed to recover from anaesthesia and returned to the animal house for up to 3 weeks before being re-anaesthetized and the nerve exposed for imaging as described above. Control nerves (n = 4 per condition) received sham electrical stimulation instead of high-frequency stimulation and vehicle exposure instead of veratridine. Following experiments, the animals were killed by anaesthetic overdose followed by cervical dislocation.
After in vivo imaging, the nerves were fixed in situ (first paraformaldehyde, 4% in phosphate buffer, pH 7.4, and then glutaraldehyde, 4% in phosphate buffer, pH 7.4), excised and processed for light and electron microscopy using standard protocols. Transverse and longitudinal semi-thin sections (0.7 μm) were cut, mounted on glass slides and stained with thionin acetate and acridine orange for light microscopic examination (Axiophot; Carl Zeiss) and digital photography (Nikon D300 Digital Camera; Nikon, Japan). Ultrathin sections (70 nm, silver colour) from selected blocks were subsequently examined at electron microscopy (JEM-1010 electron microscope; JEOL, Japan). All the nodes present in a single longitudinal section (at least 10 per section, unless stated otherwise) were imaged for each treated animal, to avoid quantification of the same node in a different section.
Ex vivo preparations
Ex vivo experiments employed excised dorsal and ventral spinal roots removed from terminally anaesthetized mice. The roots were placed in a Petri dish and secured using strands of Vaseline, which were also used to delimit a series of individual chambers for each set of four roots. The excised tissue was incubated at 37°C in oxygenated artificial cerebrospinal fluid (ACSF; NaCl, 125 mm; KCl, 2.5 mm; MgCl2.6H2O, 1 mm; CaCl2.2H2O, 2 mm; NaH2PO4.H2O, 1.25 mm; NaHCO3, 25 mm; and glucose, 10 mm in distilled H2O), renewed every 45 min. Different dilutions of hyposmotic ACSF (10, 25 and 50%) were used in osmotic studies, by diluting ACSF with distilled H2O. Hyperosmotic ACSF (200%) was obtained by adding an excess of 200 mm NaCl (Iitake et al. 1989). In pharmacological experiments, the spinal roots were incubated after excision in ACSF (control) or in ACSF containing lidocaine (500 μm in ACSF; to block sodium channels) or ouabain (1 mm in ACSF; to block the Na+–K+-ATPase). Following an initial imaging of the axons, veratridine (100 μm) or vehicle (0.67% DMSO in ACSF) was added to the medium for 10 min, and then the original solution of ACSF containing lidocaine or ouabain was restored, and the nerves re-imaged every 45 min with a water-dipping objective (×40 magnification) using the confocal microscope. Imaging involved at least five nodes imaged per condition per time point, with collection of z-stacks with 0.5 μm separation between each image, an image size of 512 × 512 pixels and a pixel size of 0.2 μm.
The images were processed using ImageJ software (National Institutes of Health, Bethesda, MD, USA). Volumetric analysis was performed by converting the ‘z-stack’ images to binary images, after selecting the desired region of interest to be analysed. The threshold of the pixel intensity used to convert the eight-bit image into a binary one was determined automatically by the software in each ‘stack’ using the ‘z-image’ at the centre of the ‘stack’ and applied to the whole series of images, and the number of coloured pixels in each focal plane was summed. The nodal/paranodal area in the electromicrographs was obtained by quantifying the area of axoplasm contained between the proximal and the distal paranodal loops, for each individual node in one longitudinal section, per animal. The percentage of the expanded periaxonal space in the eletromicrographs was obtained by normalizing the area of expanded periaxonal space with the total area of axoplasm (determined as the total area delimited by myelin, excluding the nodal/paranodal region) in each individual axon present in one longitudinal section, per animal.
Data were treated with GraphPad Prism (GraphPad Software, Inc., La Jolla, CA, USA) after initial data processing with Microsoft Excel (Microsoft Corporation). Prior to all statistical analyses, the data were tested for normality of distribution using the D'Agostino-Pearson normality test. Statistical tests employed one-way ANOVA with Tukey's multiple comparison test post hoc, unless stated otherwise. Blind measurements were performed for all experiments.
Results
In vivo observations
Electrical stimulation
Only a small percentage of the axons in the nerve expressed yellow fluorescent protein (YFP; Feng et al. 2000), which allowed individual YFP-positive axons to be distinguished easily in vivo (Fig.1A; Supplementary video 1). Normal YFP-positive axons were visible as continuous lines of bright fluorescence running in parallel to each other. The axons did not appear as uniform cylinders, even when imaged immediately upon exposure in otherwise undissected nerves. Rather, the internodal axoplasm had irregularities in its outline, with the inclusion of darker regions that presumably represented vesicles or indentations in which YFP was absent (Fig.1A, bottom right). The nodes of Ranvier were easily distinguished in larger fibres by a marked constriction, comprising a slight bulge in the centre, approximately 1 μm wide, with tighter constrictions approximately 2–5 μm wide on either side (Fig.1A, bottom left). The tighter constrictions were interpreted as showing the paranodes, which bordered the slightly bulging node. The juxtaparanodes typically seemed uneven, with lateral extensions that often appeared to be bordered by axoplasm. At first glance, these structures appear pathological, but they are an established feature of the juxtaparanodal axon, which has a cog-wheel or fluted appearance in transverse section (Fig.1B; Brown & Abbott, 1993; Rosenbluth, 2009).
Figure 1. A normal yellow fluorescent protein (YFP)-positive axon imaged in vivo.
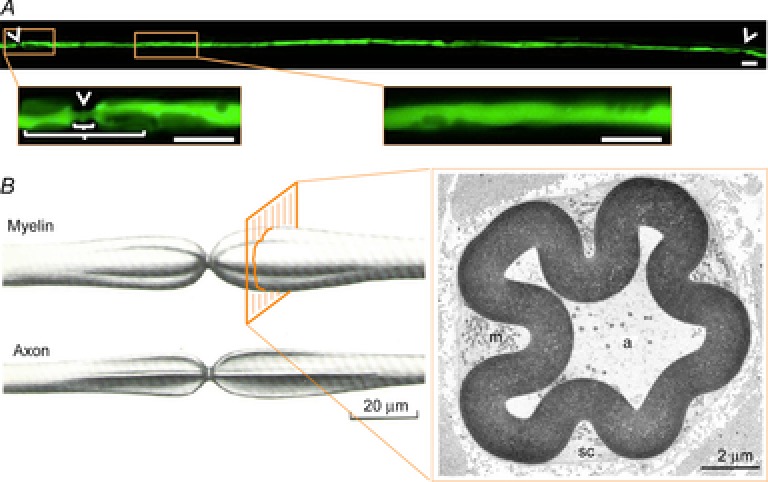
A, top panel, in vivo confocal image of a YFP-positive axon in an undisturbed saphenous nerve of a transgenically labelled mouse, with tiling of a series of images to show the full extent of the axon between two nodes of Ranvier (arrowheads). Bottom panels in A show magnified views of the regions indicated in the top panel, exhibiting a node of Ranvier (arrowhead), paranode and juxtaparanodes (short and long brackets, respectively) and the region of the internode indicated in the top image. B, left panel, an illustration of the surface contour of the paranodal bulbs and the surface contour of the enclosed axon after removal of the myelin sheath, showing its fluted conformation. B, right panel, the myelin sheath is convoluted, and the longitudinal grooves on its external surface are filled with Schwann cell cytoplasm (sc) rich in mitochondria (m), as seen in an electron micrograph of a transverse section of the paranode of a myelinated fibre. The internal contour of the myelin sheath conforms to that of the axoplasm (a). Adapted with permission from Culp & Ochoa (1982). Scale bars are 10 μm except where indicated otherwise.
Control nerves and nerves stimulated at 20 Hz showed no morphological alterations during the course of the experiment (Fig.2B and C), but stimulation at 100 Hz caused a stereotyped series of changes in virtually all of the nodes imaged. The earliest change, which was present in some axons at the end of the 2 h period of stimulation, involved a progressive thinning of the axoplasm along the internode, consistent with it being compressed by an expansion of the periaxonal space (Fig.2E, middle panel). The thinning of the internodal axoplasm affected all imaged axons within 6–8 h of the termination of stimulation. Over time (2 h), the initially relatively uniform thinning of the axoplasm became reorganized, such that the thinning was ‘focused’ to particular locations, consistent with an expanded periaxonal space becoming organized into droplets. Time-lapse imaging indicated that the droplets moved slowly along the internode towards the node/paranode (Fig.2D, bottom panel), where they disappeared as if released (Fig.2E, bottom panel).
Figure 2. Morphological alterations in axons stimulated at high frequency.
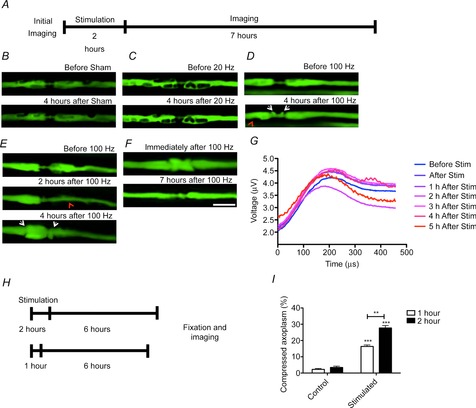
A, not to scale, in vivo confocal imaging of YFP-positive axons in the mouse saphenous nerve before and up to 8 h after stimulation for 2 h. B, in control nerves (submitted to sham surgery but no stimulation), the nodes of Ranvier and the internodes of sham-stimulated YFP-positive axons did not change during the observation period. In other preparations, a similar observation was made for nerves stimulated for 2 h at 20 Hz (C), but in nerves stimulated for 2 h at 100 Hz, there was a gradual appearance of a mushroom-shaped expansion of the paranodes (D and E, white arrowheads), accompanied by attenuation of the axoplasm (red arrowhead) in the internode. E, in nerves stimulated for 2 h at 100 Hz we observed the expansion of the periaxonal space at the paranodes (arrowhead) coinciding with (D) or preceding (E) the swelling of the paranodes (arrow). After a period of 2–10 h, the herniations shrank in size, seemingly being resorbed into the axon. F, the swelling of the paranodes could happen either symmetrically in both paranodes (D) or happen mainly in either the rostral (E) or caudal paranode, but no preference was demonstrated for one paranode instead of the other (data not shown). G shows the compound action potentials obtained from proximal saphenous nerve in response to supramaximal, distal electrical stimulation, following 2 h of stimulation at 100 Hz. The shape and amplitude of the compound action potential over time suggests that conduction is maintained in most axons during the first 5 h after sustained stimulation and is similar to that obtained before the onset of sustained stimulation. Stimulus applied at time −100 μs. Averages of n = 3 animals per condition. In some of the axons stimulated for 2 h at 100 Hz, the mushroom-shaped expansion of the paranodes was present immediately after stimulation (F, arrow), and it decreased in size 7 h after stimulation. H, not to scale, in similar preparations of mice, 6 h after being sham operated for 1 or 2 h or stimulated for 1 or 2 h with 100 Hz, longitudinal sections of saphenous nerves were embedded in resin and stained with thionin acetate and acridine orange. I, axons stimulated for 1 h exhibited some compression of the axoplasm, associated with the expansion of the periaxonal space, but axons stimulated at 100 Hz for 2 h exhibited a greater expansion of the periaxonal space. Data are presented with the SEM. Student’s unpaired t test with two-tailed distribution, two-sample equal variance. More than 10 axons were imaged and quantified from each of at least three animals per condition. **P < 0.01, ***P < 0.001. Scale bar is 10 μm.
During the period of axonal compression and droplet formation along the internode, a surprising sequence of changes occurred at the adjacent nodes of Ranvier. Initially, the axoplasm herniated out on either side of the nodal gap, laterally displacing the constriction that normally marks the paranodes (Fig.2D). The herniations grew in size to the diameter of the whole nerve fibre and became diverted back towards the adjacent internodal myelin, giving the appearance of a ‘mushroom cap’ that grew in size to displace the paranodal constriction away from the former nodal gap (Fig.2E; Supplementary video 2). In most cases, the change would start between 1 and 2 h after stimulation, becoming maximal around 4 h after stimulation. Thereafter, the herniations shrank in size, seeming to become resorbed into the axon, so that a more normal appearance was restored (Fig.2F; Supplementary video 3). At all times, the mushroom had a sharp outline, and no remnants of axoplasm appeared detached from the main body of the axon, as if the herniation remained bound by an intact axolemma throughout (later confirmed by electron microscopy; see below, Fig. 5). In a parallel experiment, compound action potentials were recorded every hour after stimulation of the saphenous nerve in vivo at 100 Hz. These recordings show that axonal conduction persists, and the compound action potential largely maintains its shape and amplitude, during the period when the morphological changes are prominent (Fig.2G).
Figure 5. Expansion of the nodal gap and paranodal herniation in stimulated axons.
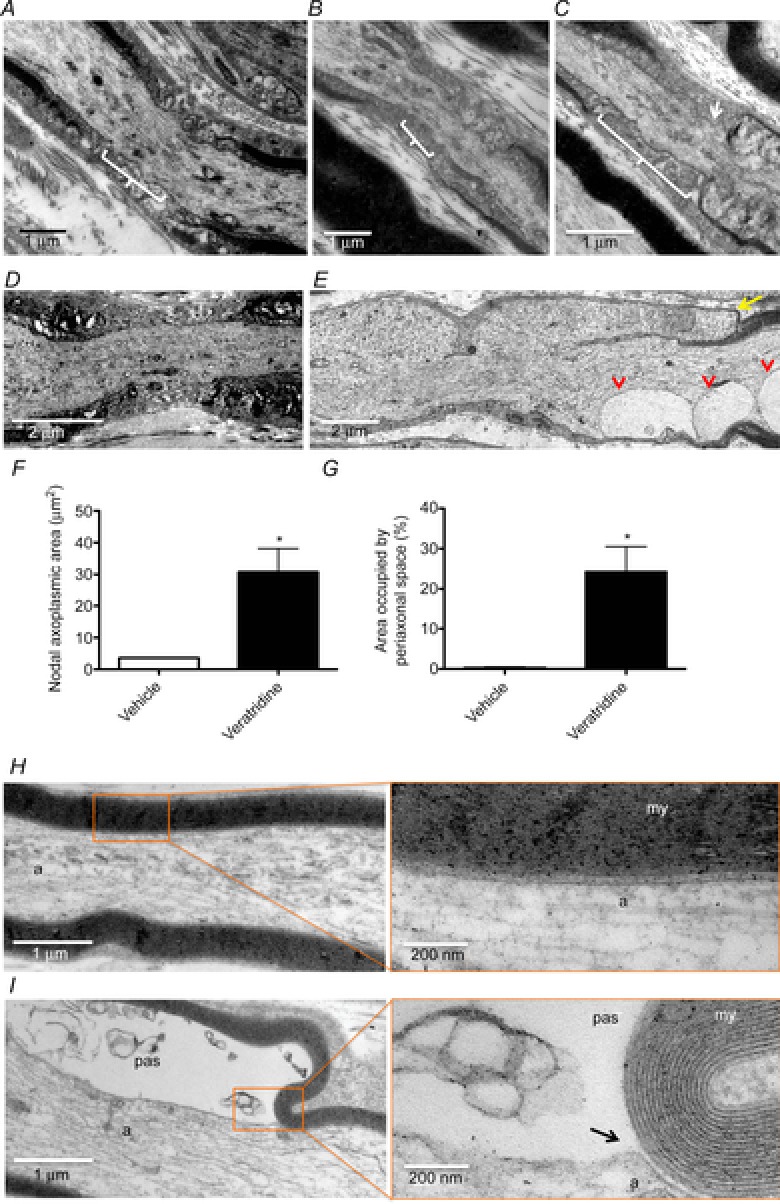
Electron micrographs showing longitudinal sections of saphenous nerves of mice fixed in vivo 6 h after being sham operated (A) or stimulated for 2 h with 20 (B) or 100 Hz (C) or after treatment with either vehicle (D and H) or veratridine (E and I), embedded in resin and stained for electron microscopy. Axons stimulated at 100 Hz for 2 h exhibited a longer nodal gap and a swelling of the paranodes (C, arrow). Axons treated with veratridine show an increased separation of the paranodes, with a swelling of the nodal axoplasm, which becomes diverted back over the former internode (arrow, quantified as the longitudinal nodal axoplasmic area in F, 30.71 ± 7.416 μm2 in veratridine-treated axons compared with 3.635 ± 0.1698 μm2 in vehicle-treated axons). Vesicle-like structures are also present in the paranodal region, seemingly resulting from the expansion of the periaxonal space loops (arrowheads; quantified as the proportion of transverse area occupied by periaxonal space in G). Axons treated with veratridine also show an expansion of the periaxonal space (pas) that compresses the axoplasm (a; 24.23 ± 6.259%), absent in vehicle-treated axons (0.3269 ± 0.1854%). It can be seen that the cell membrane separates from the myelin (my) where the periaxonal space starts to expand (black arrow). At least 10 (F) or five axons (G) were imaged and quantified from each of at least three animals per condition. Data are presented with the SEM. *P < 0.05.
The expansion of the periaxonal space is correlated with the total number of impulses conducted by the axons, because halving the number of impulses by reducing the stimulating period from 2 to 1 h, while maintaining the same frequency of stimulation, decreased the percentage by which the axoplasm was compressed after stimulation, as observed by light microscopy in high-resolution ‘plastic’ sections (Fig.2H and I).
The morphological changes described above appeared to be entirely reversible, because stimulated axons showed no gross nodal abnormalities compared with control axons when imaged 24 h after stimulation, and likewise, the expansion of the periaxonal space diminished over the next few days, so that it had entirely resolved 2 weeks after stimulation (Fig.3B). This recovery was confirmed by measuring the axoplasmic volume of ‘z-stacks’ of all the imaged YFP-positive axons at different time points after electrical stimulation (Fig.3C). Thus, the compression of the internode after stimulation caused a decrease in axoplasmic volume when compared with control nerves, but thereafter it started to recover its original dimensions. Notably, the morphological changes did not result in any demyelination or degeneration detectable either by confocal imaging or by subsequent examination of fixed tissue using light or electron microscopy, at any time points examined (up to 7 days) after electrical stimulation at 100 Hz (Fig.3D).
Figure 3. Evolution of the expansion of the periaxonal space over time.
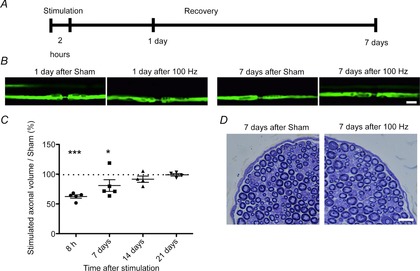
A, not to scale, in different preparations, animals were subjected to stimulation as previously described and allowed to recover for either 1 or 7 days before being imaged again. B, control nerves (submitted to sham surgery but no stimulation) exhibit axons of normal appearance both 24 h and 7 days after surgery. In other preparations, 24 h after electrical stimulation at 100 Hz, some axons exhibit constrictions in the internodal axoplasm, whereas 7 days after electrical stimulation at 100 Hz, in a different preparation, the appearance of the axons recovered to appear similar to control nerves. Scale bar is 10 μm. C shows the change in volume of axons over time, following stimulation for 2 h at 100 Hz, expressed as a percentage of the mean volume of control axons (dotted line). The volume is significantly reduced in comparison with control nerves at 8 h following stimulation, but the normal volume was partly restored by 7 days and fully restored by 2 and 3 weeks. The images analysed were z-stacks (0.3 μm slice thickness) obtained with confocal microscopy, and quantification was performed for the whole portion of the axon imaged. *P < 0.05, ***P < 0.001. Each dot represents at least nine axons from each of at least four animals/condition. Data are presented with the SEM. D, histological examination of transverse sections at high resolution (‘resin’ sections) through saphenous nerves 7 days following control or actual stimulation (2 h at 100 Hz), stained with Toluidine Blue, revealed that the stimulated nerves appeared similar to control nerves, with no evidence of axonal degeneration, demyelination or remyelination. Scale bar is 10 μm.
Chemical stimulation in vivo replicates the results of electrical stimulation
Having established that axons can undergo profound, but reversible, morphological changes in response to sustained electrical activity, we have studied these alterations further by increasing sodium channel opening using the topical application of veratridine. Exposure to vehicle caused no morphological changes during the period of observation (up to 7 h), but application of veratridine (100 μm for 10 min) caused a series of events that was indistinguishable from that observed following electrical stimulation, except that the changes tended to have a faster tempo and to be more exaggerated (Fig.4D and E). Thus, veratridine exposure caused an expansion of the periaxonal space, which became organized into a series of droplets, within only 1 h in some axons (Fig.4D; Supplementary video 4), and continuing throughout the observation period. As before, the droplets appeared to travel towards the nodes, where they disappeared from view, presumably releasing their content to the nodal gap. Meanwhile, the juxtaparanodal axoplasm became inflated so that the normal ‘fluted’ appearance was lost, and soon thereafter the nodal gap started to widen (Fig.4D; Supplementary video 5). The widening heralded the incipient semi-symmetrical herniation of the axoplasm at the nodal–paranodal junctions on either side of the nodal axolemma, which occurred as early as 1 h following veratridine application in some axons. The apparent release of the periaxonal droplets at the paranodes seemed to facilitate the initiation of recovery of the normal nodal/paranodal structure. As with electrically stimulated axons, the morphological alterations were entirely reversible, because confocal imaging a week after topical application of veratridine revealed that both the nodal changes and the expansion of the periaxonal space had reversed back to the control appearance (Fig.4G).
Figure 4. Expansion of the periaxonal space and swelling of the paranode in axons treated with veratridine.
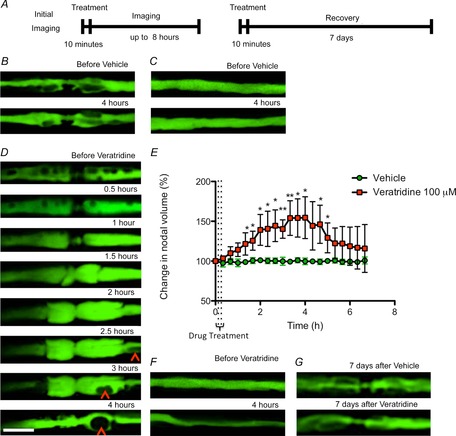
In vivo confocal imaging of YFP-positive axons in mouse saphenous nerve immediately before (time zero) and up to 8 h (B, C, D and E) or 7 days (F) after exposure to veratridine or vehicle for 10 min (A, not to scale). In control nerves, the axoplasm of the node of Ranvier (B) and internode (C) of YFP-positive axons did not change during an observation period of 4 h before and after treatment, However, exposure to veratridine for 10 min resulted in an inflation of the juxtaparanodes around 1 h after treatment, at which point a mushroom-like herniation started to expand from the paranodes, reaching a maximal bi-lobed volume 2–4 h after treatment. D, quantified in E, similar to the appearance observed following high-frequency stimulation, we noted the movement of droplets that appeared to travel along the internodes to reach the paranodes (arrowheads), coinciding with the swelling of the paranodes. The expanded node/paranode seemed to start recovering after the droplets reached the paranodal region. Treatment with veratridine also resulted in a constriction of the axoplasm along the internode that, in some cases, reduced the axoplasm to a thin line within 4 h of treatment. F, control axons remain unaffected, but axons swollen by veratridine treatment regain control appearance within 7 days (G). Different axons were imaged in F and G because it was not possible to relocate the original nodes due to scar formation following the initial incision. Nine axons were imaged from at least three animals per condition. The images analysed were z-stacks (0.3 μm slice thickness) obtained with confocal microscopy, and quantification was performed for the region of the axon between the two paranodes (an extension of approximately 30 μm centred in the node of Ranvier). Nine axons were imaged and quantified from each of at least three animals per condition. Data are presented with the SEM. *P < 0.05, **P < 0.01. Scale bar is 10 μm.
Electron microscopic examination
Electron microscopic examination of nerves following confocal imaging, and of non-imaged nerves that were prepared in a similar manner, confirmed the impressions of expansion of the periaxonal space and herniation of the paranodes in stimulated axons gained from the observations conducted in vivo (Fig.5). Within the internode, there was a marked expansion of the periaxonal space, with preservation of the axonal and Schwann cell plasma membranes. The paranodal loops appeared to become everted, with the axoplasm doubling back around the loops, causing the mushroom-like structure observed with confocal imaging. The nodal axolemma remained distinguishable, and there was a marked expansion of the periaxonal space. Droplets were bound by the axonal and Schwann cell membranes, which appeared to become re-apposed on either side of the individual droplets. The droplets therefore had the appearance of an extracellular, membrane-bound compartment. The internodal myelin appeared normal, as did the Schmidt-Lanterman incisures. At nodes of Ranvier, there was a striking herniation of the axoplasm, which remained bound by an intact axolemma. The herniations were deflected back over the original axon, away from the nodal gap, as if deflected by the basal lamina. Typically, there were two herniations at affected nodes, one on either side of the original node. The contents of the herniated axoplasm appeared disorganized, mostly containing a series of membrane-bound vesicles/membranous whorls. Mitochondria were absent from the herniations, as were recognizable microtubules and neurofilaments, which retained their normal course across the disrupted node. Typically, the terminal loops of myelin were relatively intact (accepting that these structures are inherently vulnerable to fixation artefact), but displaced laterally by the mushrooming herniated axoplasm so that the nodal gap was greatly expanded (>2 μm, up to 6 μm). The nodal axolemma typically remained recognizable, retaining its constricted appearance and normal dark undercoating, at or near the centre of the disrupted nodes. The morphological changes occurred in virtually all myelinated axons, while unmyelinated axons appeared unaffected.
Pharmacological examination of mechanisms
Having established that the morphological alterations observed following electrical stimulation could also be induced using veratridine, we aimed to use this drug in pharmacological experiments designed to explore the mechanisms involved. As the pharmacological agents cannot be administered systemically, we adopted an ex vivo approach, and we examined spinal roots rather than saphenous nerves because roots provide an opportunity to distinguish motor and sensory axons, and there are multiple roots in one animal, allowing more observations. The images of axons in spinal roots tended to be at a lower resolution because of the necessary use of water-dipping objectives, which have a lower numerical aperture than the oil-immersion objective used for imaging with a coverslip in vivo.
Confocal imaging of excised YFP-positive spinal roots revealed that the axons had a similar appearance to the normal saphenous nerve axons described above (Fig. 1). No gross alterations to the morphology of the axon occurred over an imaging period extending up to 3 h (Fig.6A), nor after treatment with vehicle (0.67% DMSO in saline, applied for 10 min; Fig.6B). Treatment with veratridine (100 μm, 10 min) caused the same changes in spinal root axons that we had observed in saphenous nerves imaged in vivo or in vitro, namely expansion of the periaxonal space and herniation of the axoplasm at the paranodes (Fig.6C). These morphological changes were prevented by exposure to the sodium channel blocking agent, lidocaine (500 μm, for the duration of the experiment; Fig.6D and E).
Figure 6. Swelling of the paranodes in excised spinal roots treated with veratridine.
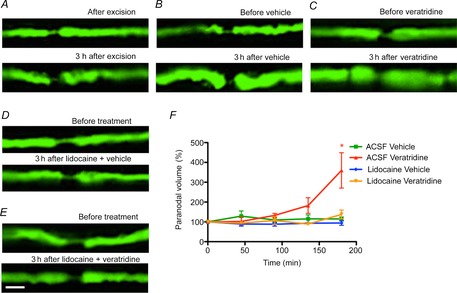
Ex vivo confocal imaging of YFP-positive axons in the mouse saphenous nerve immediately (top panel) and 3 h after being excised (bottom panel). The images from these ex vivo preparations are of lower quality than the in vivo images due to the use of water-dipping objectives with lower numerical aperture. The spinal roots in vivo appear to be under slight tension, and they shorten slightly and fatten over time when excised and placed in vitro, in both untreated (A) and vehicle-treated axons (B). These changes were still easily distinguished from the nodal herniations resulting from vertatridine treatment (C). It was possible to relocate individual nodes, but their appearance was less consistent over time than in vivo, in both control and drug-treated preparations. Aside from these subtle changes, there were no obvious axoplasmic alterations in control tissue over the observation period of 3 h. In contrast, spinal roots treated with veratridine (C) exhibited paranodal herniations, which were prevented by exposure to lidocaine (D and E; quantified in F). Scale bar is 10 μm. Data are presented with the SEM. Five nodes were imaged and quantified from four animals per condition. Student’s unpaired t test with two-tailed distribution, two-sample equal variance. *P < 0.05. Abbreviation: ACSF, artificial cerebrospinal fluid.
The expansion of the periaxonal space and the paranodal herniation due to veratridine were also prevented by co-exposure to ouabain, which blocks the Na+–K+-ATPase (Fig.7). To explore whether the presence of the ouabain might simply be depolarizing the axons, and so reducing the entry of sodium ions, we returned to the original model of sustained in vivo electrical stimulation. In this model, we determined whether ouabain would still prevent the expansion of the periaxonal space and the herniation at the nodes if it was applied to the nerve after the axons were stimulated (100 Hz for 2 h), and thereby, already loaded with sodium. When applied this protocol, ouabain again entirely prevented the herniation at the paranodes (Fig.7B and C) and the expansion of the periaxonal space (Fig.7E and F).
Figure 7. Prevention of the paranodal swelling in axons treated with ouabain.
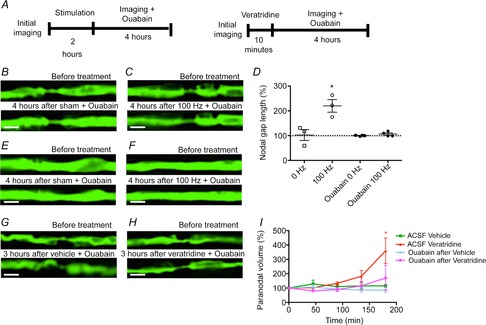
In vivo confocal imaging of YFP-positive axons in the mouse saphenous nerve before and up to 4 h after electrical stimulation and exposure to ouabain (B–F) or of excised spinal roots before and up to 3 h after exposure to veratridine and ouabain (G–I). Treatment with ouabain caused no morphological alterations either when applied alone (B, paranode and E, internode) or following electrical stimulation (C, paranode and F, internode), preventing the paranodal herniation observed when normal nerves were stimulated. D shows that the increase in nodal gap length observed in electrically stimulated axons 4 h after stimulation, compared with the values before stimulation, is prevented by ouabain. The incubation of excised spinal roots with ouabain alone did not cause any morphological alterations (G), and incubation with ouabain after veratridine blocked the swelling of the paranodes observed in spinal roots treated only with veratridine (H, quantified in I). Scale bar is 4 μm in images B, C, E and F and 10 μm in images G and H. Data are presented with the SEM. The statistical test used was Student’s unpaired t test with two-tailed distribution, two sample equal variance. *P < 0.05. n = 9 nodes from each of three or four animals in C and n = 5 nodes from each of four animals in H.
The possibility that the morphological alterations were caused by osmotic forces was assessed by modulating the osmolarity of the ACSF bathing the spinal roots (Fig.8). When incubated with hyperosmotic ACSF (200% osmolarity for 3 h), the spinal roots showed no morphological alterations. Likewise, no morphological changes were detected upon incubation in mild hyposmotic solutions (90 and 75% osmolarity). However, incubation in 50% hyposmotic ACSF caused a herniation of the axoplasm at the node–paranode junction, as observed previously in vivo with sustained stimulation or veratridine treatment. The herniation due to immersion in hyposmotic medium occurred during the 3 h incubation. With hyposmotic treatment, the axoplasmic herniation was not preceded by an expansion of the periaxonal space.
Figure 8. Swelling of the paranodes in axons incubated in hyposmotic ACSF.
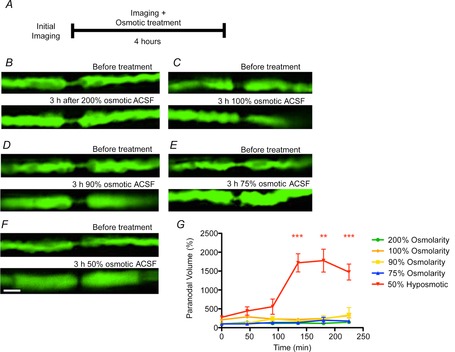
Ex vivo confocal imaging of YFP-positive axons in the mouse spinal roots before (top panel) and 3 h after being incubated with different osmolarities of ACSF (bottom panel). The incubation of the spinal roots with ACSF with an osmolarity of 200 (B), 100 (C), 90 (D) or 75% dilution (E) of ACSF alone did not cause any morphological alterations. However, the incubation of spinal roots with ACSF with a 50% osmolarity caused axoplasmic herniation at the paranodes (F, quantified in G). Scale bar is 10 μm. Data are presented with the SEM. The statistical test used was Student’s unpaired t test with two-tailed distribution, two-sample equal variance. **P < 0.01, ***P < 0.001. n = 5 nodes from each of three or four animals.
Discussion
We have studied the morphological consequences of sustained impulse activity at physiological frequencies in peripheral nerve fibres. The findings reveal a hitherto unrecognized, but profound sequence of morphological changes that includes an expansion of the periaxonal space associated with herniation of the axoplasm at the paranodes, greatly expanding the nodal gap. The fluid in the periaxonal space accumulates into droplets that travel down towards the paranode, apparently escaping to the extracellular space by parting the attachment of the paranodal loops. The morphological changes occur in virtually all axons (verified using electron microscopy) and are also initiated by a pharmacological agent that opens sodium channels. Blockade of either the sodium channels or the Na+–K+-ATPase prevents all the morphological changes. Herniation of the axon at the node is also induced by incubation in a hypotonic solution. The morphological changes reveal a surprising level of structural resilience. Thus, the changes appear to be entirely and spontaneously reversible, without any residual damage; there is no axonal degeneration, and impulse conduction persists successfully throughout. The fact that these reversible morphological changes are triggered by a physiological phenomenon suggests that they are part of the normal repertoire of axonal function.
We suggest that the morphological events may illuminate the mystery surrounding the return pathway of sodium ions after they have entered the axon as part of impulse conduction, and we discuss below the underlying evidence. The evidence is based on our interpretation that the morphological changes are caused by an osmotic imbalance associated with the increase in ionic circulation. The cause of nodal herniation appears to be an increase in axoplasmic pressure due to compression by the expansion of the periaxonal space within what appears to be a relatively rigid tube formed by the myelin bounded by the basal lamina. The pressure causing the herniation appears to be relieved, at least in part, by the gradual escape of the periaxonal fluid as it forms droplets that travel to the node and escape.
We suspect that sodium ions play a key role in the morphological changes because both electrical activity and veratridine, a drug that persistently opens sodium channels (Wang & Wang, 2003), have the same morphological consequences. We have considered whether the nodal herniation might result from swelling due to a local rise in axoplasmic osmotic pressure arising from the entry of sodium ions at the nodal axolemma, but at least two observations argue against this possibility. First, the nodal herniation was delayed following the electrical stimulation, occurring in some nodes only 4–6 h after the stimulation (and sodium accumulation) had been terminated. Indeed, the herniation only peaked in most nodes about 4 h after stimulation, and we reason that osmotic swelling in response to Na+ accumulation would probably occur more rapidly, as it did following immersion in hyposmotic solution. Second, the herniation was prevented by inhibition of the Na+–K+-ATPase, whereas such inhibition would be expected to exacerbate herniation due to axoplasmic osmotic swelling as it would delay the removal of the axoplasmic sodium. What else might cause the herniation?
The morphological changes occurred in sequence, over hours, suggesting that the changes may be causally related. The changes appear to be cumulative with increasing impulse activity, as shown by the significant decrease in the expansion of the periaxonal space in axons stimulated for only 1 h compared with axons stimulated for 2 h. The known events in order are as follows: (1) opening of sodium channels; (2) expansion of the periaxonal space along the internode; (3) swelling and herniation of the paranodal axoplasm; (4) droplet formation and migration; and (5) recovery to baseline. The fact that the swelling was delayed, rather than coincident with the stimulation, and that the Na+–K+-ATPase is located along the internodal axolemma indicates that events related to activity of the Na+–K+-ATPase are a possible explanation, especially given that the timing of the alterations matches the activity period of the pump (Bostock & Bergmans, 1994). Thus, one explanation that fits the observations arises from the fact that the opening of sodium channels will inevitably raise the intra-axonal concentration of sodium ions, and this will predictably activate the Na+–K+-ATPase (Glynn & Karlish, 1975). This enzyme appears to be located along the internodal axolemma (Young et al. 2008), which means that the sodium ions will be extruded into the periaxonal space beneath the myelin, rather than into the endoneurial space from which they originated. Potassium ions are transported in the opposite direction, but the exchange of ions is not balanced. Rather, three sodium ions are pumped out of the axon, but only two potassium ions are pumped in (Rakowski, 1989), resulting in a net gain of one ion in the periaxonal space for every cycle of the pump. This fact will contribute to a gradual rise in osmotic pressure within the periaxonal space, although it is likely that other movements of ions, particularly potassium ions, will also occur. We predict, however, that the net result of the ion movements will nonetheless be an increase in osmotic pressure within the periaxonal space, and that because this space is effectively surrounded by semi-permeable membranes (formed by the axolemma on one side and the Schwann cell on the other) there will be a net flow of water into the periaxonal space. The raised activity of the Na+–K+-ATPase persists for hours following sustained impulse activity (Bostock & Bergmans, 1994), which can account for the delay in the expansion of the periaxonal space and the herniation. The raised hydrostatic pressure will force apart the two membranes, but these are normally held in close apposition by cell-adhesion molecules, such as nectin-like proteins (Maurel et al. 2007). Rather than parting readily along their length, the cell adhesion molecules retain the membranes in close apposition at most locations, simply relieving the stress by parting at limited regions, resulting in the ‘balloons’ that project into the axoplasm. We suspect that the pressure in the periaxonal space is relieved by squashing the axon rather than squashing the Schwann cell, because the myelin, and particularly the basal lamina, are probably less deformable than the axoplasm. The rise in axonal hydrostatic pressure due to internodal compression will be transmitted to the node, where a seeming inherent weakness (revealed by incubation in hyposmotic fluid) results in herniation of the axoplasm at the junction between the nodal axolemma and the paranode, rather like squeezing toothpaste from a tube. Over time, the fluid enclosed within the periaxonal space forms into droplets, which appear to travel down a mild pressure gradient towards the node, where they presumably escape to the nodal gap by parting the attachment of the paranodal loops of myelin to the axolemma. It is not yet clear whether the observations indicate the normal pathway taken by sodium ions to return to the extracellular milieu (first to the periaxonal space, then beneath the paranodal folds of myelin) or a ‘storm overflow’ pathway activated when impulse activity is excessive.
It is worth noting that although impulse activity and incubation in a hyposmotic medium both cause nodal herniation, the mechanism is probably different in the two cases. We suggest that the herniation due to impulse activity arises from osmotic expansion of the periaxonal space and thereby compression of the internodal axoplasm, whereas the herniation due to a hyposmotic environment is likely to be due to osmotic swelling of the axoplasm.
Although the morphological changes are dramatic, they are, surprisingly, fully reversible over time. Indeed, the nodal changes resolve over hours/days, and the periaxonal space returns to normal over days/weeks. Apart from these changes, other components appeared unaffected. Thus, the mitochondria in both the paranodal Schwann cytoplasm and throughout the axoplasm appeared morphologically normal, and the Schmidt-Lanterman incisures and internodal myelin appeared unaffected, as we have previously shown (Sajic et al. 2013). There was no obvious disturbance of the endoneurium or perineurium, such as oedema, and no degeneration or demyelination were detected; the axons continued conducting throughout. These observations, together with the fact that the changes result from physiological levels of impulse activity, suggest that the changes may be part of the normal axonal repertoire. If so, the observations reveal that axons have an extraordinary degree of morphological plasticity. In this respect, the changes we have observed are distinct from more pathological situations, in which internodal vacuolization has been described, accompanied by gross myelin deformation (Sturrock, 1987; Ochs & Jersild, 1990).
The swelling of the paranodes and widening of the nodal gap following sustained stimulation is somewhat reminiscent of the changes observed following treatment with venoms that promote opening of sodium channels, such as batrachotoxin (Moore et al. 1986), ciguatoxin-1b (Bennett et al. 1997) and the venoms of the scorpions Leirurus quinquestriatus and Centruroides sculpturatus and the spider Phoneutria nigriventer (Baker et al. 1985; Love & Cruz-Höfling, 1986; Mattiello-Sverzuta et al. 1998; Mattiello-Sverzuta & da Cruz-Höfling, 2000). The possibility that the changes observed in these studies were due to a rise in intra-axonal pressure was considered, including the possibility that the swelling specifically at the nodal–paranodal junction was partly due to the reinforcement of the nodal axolemma by its electron-dense undercoat and a network of circumferentially oriented fine filaments (Ellisman & Porter, 1980). In this case, the paranodes would provide the plasticity to cope with volume alterations. It has previously been shown that externally applied pressure can cause profound morphological alterations to the nodal region in peripheral nerve fibres (Ochoa et al. 1972); however, these were shown to be irreversible and to cause demyelination and conduction block.
The morphological changes were induced by stimulation at 100 Hz. Sustained firing at this frequency is within the physiological range of at least some axons, and recordings from hamstring afferents in freely moving cats have revealed average firing rates of 100 Hz or more during normal stepping (Prochazka & Gorassini, 1998). Furthermore, we have found that axons in rat dorsal roots in vivo can faithfully conduct impulses continuously at 50 or 100 Hz for periods up to 5 or 6 h (Smith et al. 2001). The stimulation used in the present study is therefore likely to be within the physiological experience of at least some of the axons studied, and so it is significant that virtually all of the axons showed the morphological changes described. We conclude that the changes may therefore sometimes occur during normal life, and that they are a hitherto-unrecognized part of the normal repertoire of axons.
If the morphological changes may arise during normal life, it is interesting to consider whether they may sometimes contribute to axonal pathology even if they are typically reversible as we have shown. Indeed, preliminary studies seem to suggest that the morphological changes are promoted by pathological conditions, mimicked by partial ischaemia and exposure to nitric oxide, a feature of neuroinflammatory lesions (data not shown). The nodal/paranodal/juxtaparanodal axolemma has a rich and highly segregated complement of proteins, including channels, pumps and cell adhesion molecules, as well as other molecules, such as gangliosides. Of these, the only ones normally exposed are those in the nodal axolemma, and even these are normally ‘buried’ beneath the Schwann cell microvilli and the nodal gap substance. It seems likely that the herniated axolemma will expose to the surface a number of complex molecules usually sequestered beneath other structures, in which case these may now become involved in novel chemical and cellular interactions. Notably, some exposed molecules may be newly exposed to immune surveillance, with potential innate and acquired immune consequences, including with regard to autoimmune diseases, such as Guillain–Barré syndrome. It also seems reasonable to believe that morphologically stressed axons may be more vulnerable to degeneration in adverse conditions that may be tolerated by normal axons. In this case, the observations made here may contribute to our understanding of why axons degenerate in neurological disease.
Acknowledgments
The authors thank Dr Daniel Morrison for expert technical assistance with histology. We acknowledge the work of Dr Karen Stevens who, in our laboratory using rat tissue, made initial observations on the expansion of the periaxonal space with veratridine, upon which some of the current findings are based.
Glossary
Abbreviations
- ACSF
artificial cerebrospinal fluid
- YFP
yellow fluorescent protein
Additional information
Competing interests
None declared.
Author contributions
D.T.: design of the experiments, collection, analysis and interpretation of data, drafting and revising the manuscript. K.J.S.: conception and design of the experiments, interpretation of the data, drafting and revising the manuscript.
Funding
This work was supported by a Portuguese Foundation for Science and Technology PhD studentship (SFRH/BD/33546/2008) to D.T., and grants from the MRC and Multiple Sclerosis Society of Great Britain & Northern Ireland to K.J.S.
Supporting Information
Disclaimer: Supporting information has been peer-reviewed but not copyedited.
Supplementary video 1. Illustrates a ‘z-stack’ and derived 3D reconstruction of a normal YFP-positive axon imaged in vivo.
Supplementary video 2. Morphological alterations in axons stimulated at high frequency.
Supplementary video 3. Resorbtion of the paranodal herniation to restore the normal axonal appearance following stimulation at high frequency.
Supplementary video 4. Expansion of the periaxonal space in an axon treated with veratridine.
Supplementary video 5. Swelling and herniation of the paranodal axoplasm in an axon treated with veratridine.
References
- Alberti S, Gregório EA, Spadella CT. Cojocel C. Localization and irregular distribution of Na,K-ATPase in myelin sheath from rat sciatic nerve. Tissue Cell. 2007;39:195–201. doi: 10.1016/j.tice.2007.03.004. [DOI] [PubMed] [Google Scholar]
- Baker M, Bostock H, Brook GA. Love S. Phoneutria and leiurus venoms induce spontaneous compound action potentials in rat spinal roots. J Physiol 369. 1985:63P. [Google Scholar]
- Bennett V, Lambert S, Davis JQ. Zhang X. Molecular architecture of the specialized axonal membrane at the node of Ranvier. Soc Gen Physiol Ser. 1997;52:107–120. [PubMed] [Google Scholar]
- Bostock H. Bergmans J. Post-tetanic excitability changes and ectopic discharges in a human motor axon. Brain. 1994;117:913–928. doi: 10.1093/brain/117.5.913. [DOI] [PubMed] [Google Scholar]
- Brown ER. Abbott NJ. Ultrastructure and permeability of the Schwann cell layer surrounding the giant axon of the squid. J Neurocytol. 1993;22:283–298. doi: 10.1007/BF01187127. [DOI] [PubMed] [Google Scholar]
- Bunge RP. Glial cells and the central myelin sheath. Physiol Rev. 1968;48:197–251. doi: 10.1152/physrev.1968.48.1.197. [DOI] [PubMed] [Google Scholar]
- Culp WJ. Ochoa JL. Abnormal Nerves and Muscles as Impulse Generator. Oxford, UK: Oxford University Press; 1982. [Google Scholar]
- Ellisman MH. Porter KR. Microtrabecular structure of the axoplasmic matrix: visualization of cross-linking structures and their distribution. J Cell Biol. 1980;87:464–479. doi: 10.1083/jcb.87.2.464. [DOI] [PMC free article] [PubMed] [Google Scholar]
- Feng G, Mellor RH, Bernstein M, Keller-Peck C, Nguyen QT, Wallace M, Nerbonne JM, Lichtman JW. Sanes JR. Imaging neuronal subsets in transgenic mice expressing multiple spectral variants of GFP. Neuron. 2000;28:41–51. doi: 10.1016/s0896-6273(00)00084-2. [DOI] [PubMed] [Google Scholar]
- Frankenhauser B. Hodgkin AL. The after-effects of impulses in the giant nerve fibres of Loligo. J Physiol. 1956;131:341–376. doi: 10.1113/jphysiol.1956.sp005467. [DOI] [PMC free article] [PubMed] [Google Scholar]
- Glynn IM. Karlish SJ. The sodium pump. Annu Rev Physiol. 1975;37:13–55. doi: 10.1146/annurev.ph.37.030175.000305. [DOI] [PubMed] [Google Scholar]
- Hall SM. Williams PL. The distribution of electron-dense tracers in peripheral nerve fibres. J Cell Sci. 1971;8:541–555. doi: 10.1242/jcs.8.2.541. [DOI] [PubMed] [Google Scholar]
- Hirano A. Dembitzer HM. The transverse bands as a means of access to the periaxonal space of the central myelinated nerve fiber. J Ultrastruct Res. 1969;28:141–149. doi: 10.1016/s0022-5320(69)90012-4. [DOI] [PubMed] [Google Scholar]
- Iitake K, Kimura T, Ota K, Shoji M, Ohta M, Sato K, Yamamoto T, Yasujima M. Abe K. Responses of vasopressin, atrial natriuretic peptide, and blood pressure to central osmotic stimulation. Am J Physiol Endocrinol Metab. 1989;257:E611–E616. doi: 10.1152/ajpendo.1989.257.4.E611. [DOI] [PubMed] [Google Scholar]
- Koester J. Siegelbaum SA. Membrane potential. In: Kandel ER, Schwartz JH, Jessell TM, editors. Principles of Neural Science. Columbus, OH, USA: McGraw-Hill; 1991. pp. 81–94. [Google Scholar]
- Love S. Cruz-Höfling MA. Acute swelling of nodes of Ranvier caused by venoms which slow inactivation of sodium channels. Acta Neuropathol. 1986;70:1–9. doi: 10.1007/BF00689507. [DOI] [PubMed] [Google Scholar]
- McGrail KM, Phillips JM. Sweadner KJ. Immunofluorescent localization of three Na,K-ATPase isozymes in the rat central nervous system: both neurons and glia can express more than one Na,K-ATPase. J Neurosci. 1991;11:381–391. doi: 10.1523/JNEUROSCI.11-02-00381.1991. [DOI] [PMC free article] [PubMed] [Google Scholar]
- Mata M, Fink DJ, Ernst SA. Siegel GJ. Immunocytochemical demonstration of Na+,K+-ATPase in internodal axolemma of myelinated fibers of rat sciatic and optic nerves. J Neurochem. 1991;57:184–192. doi: 10.1111/j.1471-4159.1991.tb02114.x. [DOI] [PubMed] [Google Scholar]
- Mattiello-Sverzuta AC. da Cruz-Höfling MA. Toxin 2 (PhTx2), a neurotoxic fraction from Phoneutria nigriventer spider venom, causes acute morphological changes in mouse skeletal muscle. Toxicon. 2000;38:793–812. doi: 10.1016/s0041-0101(99)00188-9. [DOI] [PubMed] [Google Scholar]
- Mattiello-Sverzut AC, Fontana MD, Diniz CR. da Cruz-Höfling MA. Pathological changes induced by PhTx1 from Phoneutria nigriventer spider venom in mouse skeletal muscle in vitro. Toxicon. 1998;36:1349–1361. doi: 10.1016/s0041-0101(98)00012-9. [DOI] [PubMed] [Google Scholar]
- Maurel P, Einheber S, Galinska J, Thaker P, Lam I, Rubin MB, Scherer SS, Murakami Y, Gutmann DH. Salzer JL. Nectin-like proteins mediate axon Schwann cell interactions along the internode and are essential for myelination. J Cell Biol. 2007;178:861–874. doi: 10.1083/jcb.200705132. [DOI] [PMC free article] [PubMed] [Google Scholar]
- Mierzwa A, Arevalo J-C, Schiff R, Chao MV. Rosenbluth J. Role of transverse bands in maintaining paranodal structure and axolemmal domain organization in myelinated nerve fibers: effect on longevity in dysmyelinated mutant mice. J Comp Neurol. 2010a;518:2841–2853. doi: 10.1002/cne.22367. [DOI] [PMC free article] [PubMed] [Google Scholar]
- Mierzwa A, Shroff S. Rosenbluth J. Permeability of the paranodal junction of myelinated nerve fibers. J Neurosci. 2010b;30:15962–15968. doi: 10.1523/JNEUROSCI.4047-10.2010. [DOI] [PMC free article] [PubMed] [Google Scholar]
- Ochoa J, Fowler TJ. Gilliatt RW. Anatomical changes in peripheral nerves compressed by a pneumatic tourniquet. J Anat. 1972;113:433–455. [PMC free article] [PubMed] [Google Scholar]
- Ochs S. Jersild RA., Jr Myelin intrusions in beaded nerve fibers. Neuroscience. 1990;36:553–567. doi: 10.1016/0306-4522(90)90445-a. [DOI] [PubMed] [Google Scholar]
- Peles E. Salzer JL. Molecular domains of myelinated axons. Curr Opin Neurobiol. 2000;10:558–565. doi: 10.1016/s0959-4388(00)00122-7. [DOI] [PubMed] [Google Scholar]
- Prochazka A. Gorassini M. Ensemble firing of muscle afferents recorded during normal locomotion in cats. J Physiol. 1998;507:293–304. doi: 10.1111/j.1469-7793.1998.293bu.x. [DOI] [PMC free article] [PubMed] [Google Scholar]
- Rakowski RF. Simultaneous measurement of changes in current and tracer flux in voltage-clamped squid giant axon. Biophys J. 1989;55:663–671. doi: 10.1016/S0006-3495(89)82864-4. [DOI] [PMC free article] [PubMed] [Google Scholar]
- Rosenbluth J. Multiple functions of the paranodal junction of myelinated nerve fibers. J Neurosci Res. 2009;87:3250–3258. doi: 10.1002/jnr.22013. [DOI] [PubMed] [Google Scholar]
- Rosenbluth J, Mierzwa A. Shroff S. Molecular architecture of myelinated nerve fibers: leaky paranodal junctions and paranodal dysmyelination. Neuroscientist. 2013;19:1–14. doi: 10.1177/1073858413504627. [DOI] [PubMed] [Google Scholar]
- Sajic M, Mastrolia V, Lee CY, Trigo D, Sadeghian M, Mosley AJ, Gregson NA, Duchen MR. Smith KJ. Impulse conduction increases mitochondrial transport in adult mammalian peripheral nerves in vivo. PLoS Biol. 2013;11:e1001754. doi: 10.1371/journal.pbio.1001754. [DOI] [PMC free article] [PubMed] [Google Scholar]
- Scherer SS, Deschênes SM, Xu YT, Grinspan JB, Fischbeck KH. Paul DL. Connexin32 is a myelin-related protein in the PNS and CNS. J Neurosci. 1995;15:8281–8294. doi: 10.1523/JNEUROSCI.15-12-08281.1995. [DOI] [PMC free article] [PubMed] [Google Scholar]
- Skou JC. The influence of some cations on an adenosine triphosphatase from peripheral nerves. Biochim Biophys Acta. 1957;23:394–401. doi: 10.1016/0006-3002(57)90343-8. [DOI] [PubMed] [Google Scholar]
- Smith KJ, Kapoor R, Hall SM. Davies M. Electrically active axons degenerate when exposed to nitric oxide. Ann Neurol. 2001;49:470–476. [PubMed] [Google Scholar]
- Sturrock RR. Age-related changes in the number of myelinated axons and glial cells in the anterior and posterior limbs of the mouse anterior commissure. J Anat. 1987;150:111–127. [PMC free article] [PubMed] [Google Scholar]
- Wang S-Y. Wang GK. Voltage-gated sodium channels as primary targets of diverse lipid-soluble neurotoxins. Cell Signal. 2003;15:151–159. doi: 10.1016/s0898-6568(02)00085-2. [DOI] [PubMed] [Google Scholar]
- Young EA, Fowler CD, Kidd GJ, Chang A, Rudick R, Fisher E. Trapp BD. Imaging correlates of decreased axonal Na+/K+ ATPase in chronic multiple sclerosis lesions. Ann Neurol. 2008;63:428–435. doi: 10.1002/ana.21381. [DOI] [PubMed] [Google Scholar]
Associated Data
This section collects any data citations, data availability statements, or supplementary materials included in this article.
Supplementary Materials
Supplementary video 1. Illustrates a ‘z-stack’ and derived 3D reconstruction of a normal YFP-positive axon imaged in vivo.
Supplementary video 2. Morphological alterations in axons stimulated at high frequency.
Supplementary video 3. Resorbtion of the paranodal herniation to restore the normal axonal appearance following stimulation at high frequency.
Supplementary video 4. Expansion of the periaxonal space in an axon treated with veratridine.
Supplementary video 5. Swelling and herniation of the paranodal axoplasm in an axon treated with veratridine.