

Abstract
Leukemias expressing the constitutively activated tyrosine kinases (TKs) BCR-ABL1 and FLT3/ITD activate signaling pathways that increase genomic instability through generation of reactive oxygen species (ROS), DNA double-strand breaks (DSBs) and error-prone repair. The non-homologous end-joining (NHEJ) pathway is a major pathway for DSB repair and is highly aberrant in TK-activated-leukemias; an alternative form of NHEJ (ALT-NHEJ) predominates, evidenced by increased expression of DNA ligase IIIα (LIG3) and poly (ADP-ribose) polymerase (PARP1), increased frequency of large genomic deletions, and repair using DNA sequence microhomologies. This study, for the first time, demonstrates that the TK target c-MYC plays a role in transcriptional activation and subsequent expression of LIG3 and PARP1 and contributes to the increased error-prone repair observed in TK-activated leukemias. c-MYC negatively regulates microRNAs miR-150 and miR-22 which demonstrate an inverse correlation with LIG3 and PARP1 expression in primary and cultured leukemia cells and chronic myelogenous leukemia (CML) human patient samples. Notably, inhibition of c-MYC and overexpression of miR-150 and -22 decreases ALT-NHEJ activity. Thus, BCR-ABL1 or FLT3/ITD induces c-MYC expression leads to genomic instability via augmented expression of ALT-NHEJ repair factors that generate repair errors.
Keywords: c-MYC, ALT-NHEJ, BCR-ABL1, FLT3/ITD, genomic instability
Introduction
Constitutively activated tyrosine kinases (TKs) BCR-ABL1 and FLT3/ITD generate increased levels of reactive oxygen species (ROS), DNA damage including double-strand breaks (DSBs), and abnormal repair that is highly error-prone. Together, these features result in acquisition of genomic alterations which have the potential to drive disease progression and resistance to therapy(1, 2). DSBs are repaired by two pathways, homologous recombination (HR) and non-homologous end-joining (NHEJ)(3–5). The classic NHEJ (c-NHEJ) pathway frequently causes small alterations in DNA sequences around the break site, but rarely joins previously unlinked DNA ends(6). However, there is an alternative (ALT) version of NHEJ that results in larger deletions and chromosomal translocations where DNA ends are joined at regions of DNA sequence microhomology(6, 7). Notably, ALT-NHEJ activity is increased when the c-NHEJ pathway is down-regulated(6, 7). Expression of both BCR-ABL1 and FLT3/ITD significantly alters the expression of key DSB repair components at both the mRNA and protein levels(8) and increases the frequency of repair errors(9–12). These cells also demonstrate increased in ALT-NHEJ activity characterized by large DNA deletions and repair using DNA sequence microhomologies(8, 13, 14). Notably, treatment of BCR-ABL1- and FLT3/ITD-positive cells with TK inhibitors (TKIs) leads to decreased expression of ALT-NHEJ components LIG3 and PARP1(8, 13, 14) and decreased DSB repair errors, indicating that altered DNA repair is due to one or more effectors of these signaling pathways(12). However, the mechanisms responsible for this repair dysregulation were unknown.
There are several routes through which mammalian cells regulate gene expression, with transcriptional regulation being the most common mechanism. Both FLT3/ITD and BCR-ABL1-activated leukemias exhibit induction of the oncogenic transcription factor c-MYC(15, 16). In turn, many downstream targets of c-MYC are transcriptionally activated, and this increased signaling that may result in enhanced survival and genomic instability (17). In fact, c-MYC interacts with and regulates the promoters of DSB repair genes in several cancer cell lines (18). While, the functional significance of this regulation remains unclear, these studies suggest that c-MYC might contribute to the DNA repair abnormalities observed in AML and CML cells with BCR-ABL1 and FLT3-ITD mutations. In addition, c-MYC has been shown to negatively regulate specific miRNAs, with c-MYC induction leading to repression of multiple miRNAs and miRNA clusters(19).
In this study, we investigated the role of c-MYC in error-prone repair through increased expression of ALT-NHEJ factors LIG3 and PARP1 in cell lines and primary myeloid malignancies, and demonstrated that both c-MYC and c-MYC-regulated miRNAs, miR-150 and miR-22, contribute to increased levels of LIG3 and PARP1 expression, and consequently, ALT-NHEJ activity.
Materials and Methods
Patient samples
Frozen mononuclear cells (MNC) from Bone marrow (BM) and peripheral blood (PB) samples were obtained from CML patients [chronic-phase (CP) n=15, accelerated-phase (AP) n=1, blast crisis (BC) n=14] at the Marlene and Stewart Greenebaum Cancer Center and at the University of Milano-Bicocca on protocols approved by the Institutional Review Board. BM MNC from healthy donors (HD) (Lonza) were used as controls for the patient samples.
Cell lines and Culture
The murine myeloid precursor cell lines 32Dcl3 and 32D-FLT3/ITD (kindly provided by Dr. Donald Small, Johns Hopkins University, Baltimore, MD), the human megakaryocytic cell lines MO7e and MO7e-BCR-ABL1 (kindly provided by Dr. Richard van Etten, Tufts University, Boston, MA), the human AML cell line MOLM14 (expressing FLT3/ITD), the human leukemia cell line REH (expressing wild-type FLT3), and the human CML cell line K562 (established from a patient in blast crisis(20)) were grown as previously described.(11, 14). 293Thuman embryonic kidney cells were grown in DMEM supplemented with 10% fetal bovine serum.
Plasmids
The c-MYC expression vectors pBABEpuro-myc-ER (plasmid 19128) and pcDNA3-cmyc (plasmid 16011) were obtained from Addgene (Cambridge, MA) and described in Ricci et al (21). The luciferase expression vector pGL4.10 was obtained from Promega (Madison, WI). To construct the LIG3 promoter-reporter construct (pGL4.10-LIG3p), we cloned the LIG3 promoter from BAC clone 3143J8 (Invitrogen, Grand Island, NY) using Forward-AACCCTAACACCTCCTCTTCCTCT and Reverse- TGATCAAGGCTCCCTGAGTCCCA primers (IDT Technologies, Des Moines, IA). The cloned promoter was digested with NheI and EcoRV restriction enzymes (New England Biolabs, Ipswich, MA) and inserted into a digested pGL4.10 vector using a T4 ligase kit (Promega) according to the manufacturer’s instructions. The PARP1 promoter-reporter construct was obtained from Switch Gear Genomics (Carlsbad, CA). The CAD promoter was cloned from genomic DNA isolated from normal human bone marrow (Lonza) using Forward-TGGGAGCCACCACTCTAT and Reverse-CGCATCACAGAGTGGGATAA primers, then digested with SacI restriction enzyme and cloned into pGL4.10 using T4 ligase kit. For site-directed mutagenesis of the c-MYC binding sites within the constructs above, we used the Q5 Site-Directed Mutagenesis kit (New England Biolabs) according to the manufacturer’s instructions. All promoter-reporter reporter constructs were sequenced to confirm correct orientation and sequence of promoters, as well as success of site-directed mutagenesis. A GFP-expressing plasmid, pmaxGFP (Lonza), was used throughout the study to control for transfection efficiency. pEF1alpha-DsRed-Express 2 vector (Clontech) was used as a transfection efficiency control for experiments using pEGFP-Pem1-Ad2 vector.
Western blotting
Western blot analysis was performed as previously described(14). c-MYC and Ku70 (Santa Cruz Biotechnology, Dallas, TX) antibodies were used at 1:500 and 1:1000, respectively. Anti-LIG3 (clone 7, BD Biosciences, San Jose, CA) and anti-PARP1 (Cell Signaling Technologies, Danvers, MA) were used at 1:3000. Anti-LIG4 (GeneTex) was used at 1:1000. Anti-GRB2 (Cell Signaling Technology) was used at 1:1000. Anti-actin antibody (Sigma, St Louis, MO) was used as a loading control at 1:10,000. Secondary antibodies conjugated to HRP (KPL, Gaitherburg, MD) were added at a 1:10,000 dilution. Signal was detected using ECL (GE Healthcare, Pittsburgh, PA). Bands were quantified with ImageQuant software (Bio-Rad, Hercules, CA).
Quantitative PCR
RNA isolation for real-time PCR of c-MYC, LIG3 and PARP1 transcripts was performed using the RNAspin mini-kit (GE Healthcare). Quantitect Primers (Qiagen, Germantown, MD) were used for each target, with GAPDH as housekeeping gene. Power SYBR® Green RT-PCR Mastermix (Applied Biosystems, Foster City, CA) was used for reactions carried out in triplicates using a Mastercycler ep® (Eppendorf, Hauppauge, NY). Relative quantification was determined using Eppendorf’s realplex software according to the ΔΔCT method. For ChIP-qPCR, we used HotStart-IT SYBR Green qPCR 2X Mastermix (Affymetrix) per manufacturer’s instructions.
Nanosting microRNA analysis
Paired CML-CP (n=5), CML-BC (n=5) and from HD (n=3) MNCs were processed using Ficoll-Paque plus (GE Healthcare Life Sciences). Total RNA was extracted with Trizol (Invitrogen) per manufacturer’s instructions, and 100ng/sample was used to assess differences in miRNA expression using multiplexed NanoString enzyme-independent probe-based quantification system that allows digital counting of individual miRNA molecules (nCounter; NanoString Technologies, Seattle, WA), as previously described (22). NanoString assays were performed at the Ohio State University Comprehensive Cancer Center Microarray Facility (Columbus, OH). Heat map analysis was performed using Z-score.
siRNA knockdown
Cells (2×10⁶, 0.5×10⁶ per mL) were washed in Opti-MEM medium (Invitrogen) and transfected with SMARTpool siRNA (Thermo Scientific Dharmacon, Pittsburgh, PA) using the Amaxa Nucleofection System (Lonza) as previously described(14).
MiRNAs
Total RNA was isolated using miRNeasy kit (Qiagen) per manufacturer’s instructions. Levels of miRNAs were determined by Q-PCR using a TaqMan qRT-PCR kit (Life Technologies), with U18 serving as the housekeeping miRNA. miRNA expression and microarray analyses were carried out as previously described (23). For miRNA-overexpression experiments, K562, MO7e-BCR/ABL1, and MOLM-14 cells were transfected with 50nM miR-34a, -22, -150, or a combination of miR-22 and -150 (Thermo Scientific-Dharmacon), and harvested for Western blot and NHEJ repair analyses at 24, 48, or 72hrs post transfection.
Chromatin Immunoprecipitation (ChIP)
ChIP was performed according to Luoto et al(18), with the following modifications. Lysates were sonicated on ice 10 times using a Branson 450 Sonifier (Danbury, CT) for 10 seconds each time, at 40% output control and 2.5 duty-cycle, with 30-second refractory periods between sonications. ChIP products were purified using a Qiaquick kit (Qiagen) followed by q-PCR using the following primer sets:
LIG3(forward) 5′-AACTACTCCCAAACATCACAGG-3′
LIG3(reverse) 5′-CTTTAAATCCGGGTCCTAGAGC-3′
PARP1(forward) 5′-GGTCTCAAACTCCTGCTACAA-3′
PARP1(reverse) 5′-AGGACACACTTAAGAGTTTGGG-3′
CAD(forward) 5′- TAGCCACGTGGACCGACT-3′
CAD(reverse) 5′- TACGGAGAAGCGGGAAGGA-3′
Ch22(forward) 5′- GGATGACAGGCATGAGGAATTA-3′
Ch22(reverse) 5′- TGCTGCTTACTTGGGATATGAG-3′
Luciferase assays
32D-FLT3/ITD and MO7e-BCR-ABL1 cells were transfected with control or c-MYC-targeting siRNA as described above. Transfected cells were incubated for 48 hours, then harvested for transfection with luciferase constructs pGL4.10 (promoterless control, Promega) or pGL4.10-LIG3p and pGL4.10-PARP1p (luciferase vectors containing LIG3 and PARP1 promoters, respectively). Transfection efficiency was determined by co-transfection with pRL-TK vector (Promega) containing HSV thymidine kinase promoter. Measurement of luciferase activity was performed with Dual Luciferase Reporter Assay System (Promega) using an HT Synergy plate reader (Bio-TEK, Winooski, VT).
In vivo NHEJ Assay
The in vivo NHEJ assay was performed as previously described(14). Briefly, 0.2μg of linearized pUC18 plasmid was transfected into 2 million cells 48 hours post-transfection with siRNA against c-MYC or miR-22/150 combination, respectively. Repaired plasmid clones were sequenced at the repair junction, and sequences were analyzed using BioEdit sequence alignment editor (http://www.mbio.ncsu.edu/bioedit/bioedit.html). Three independent c-MYC-knockdown or miRNA-overexpression experiments, followed by three independent in vivo NHEJ assays were performed to confirm results. To determine the relative end-joining efficiency post siRNA knockdown, we utilized the GFP-based end-joining assay described by Fattah et al {Fattah, 2010 #11559}. Briefly, cells were transfected with siRNA for 48hrs, followed by transfection with HindIII-linearized pEGFP-Pem1-Ad2. 24 hours later the cells were analyzed by flow cytometry for GFP. For this assay, a DsRed expression plasmid (pEF1alpha-DsRed-Express 2) was used to normalize for any variations in transfection efficiency.
Statistical Analysis
Statistical analysis comparing experimental and control groups was performed using the Student’s t-test and z-test (for differences in frequencies of microhomology-mediated repair and proportions of patient samples). The correlation coefficient (Pearson’s R) was used to determine positive or negative correlations.
Results
c-MYC expression are elevated in TK-activated myeloid leukemias and correlate with LIG3 and PARP1 expression levels
Our previous studies showed that TK-activated leukemias had increased steady state levels of PARP1 and LIG3 mRNA and protein (24), suggesting that they are transcriptionally regulated. Following database analysis (using Matinspector from (Genomatix, Munich, Germany) and TF Search (Parallel Application TRC Laboratory, Japan) of promoter regions of these genes, c-MYC binding sites were revealed and thus c-MYC was investigated as a candidate in transcriptional regulation of these genes.
To determine whether c-MYC plays a role in regulating expression of LIG3 and PARP1, we initially examined microarray data for multiple myeloid leukemia cell lines and primary cells, to correlate mRNA expression levels of c-MYC with either LIG3 and PARP1 mRNA expression levels. Analysis of acute myeloid leukemia (AML) cell lines (HL60, Kasumi1, KG1a, ML2, Mo7e, and U937), the BCR-ABL1+ CML cell line in BC K562, and primary AML patient samples (n=18; Table S1) revealed that endogenous levels of c-MYC showed a significant positive correlation, with levels of LIG3 (Pearson’s R = 0.6492, Fig. 1A) and PARP1 (Pearson’s R = 0.8422, Fig. 1B).
Figure 1. c-MYC expression levels correlate with LIG3 and PARP1 levels in myeloid leukemias and are elevated in TK-positive leukemias compared to controls.

Graphs of correlations between endogenous expression levels of (A) c-MYC and LIG3 or (B) c-MYC and PARP1 from microarray data of mRNAs from AML cell lines (n=7) and AML primary samples (n=18). Pearson’s (r) value denotes the strength of the correlation. (C) Left, upper panel, Western blot analysis of basal protein levels for c-MYC, LIG3, and PARP1 in TK-positive cell lines and TK-negative controls (shown in pairs): REH vs MOLM14, 32D vs 32D/ITD, Mo7e vs K562, Mo7e vs MO7eBCR-ABL (MBA). Left, lower panel, Basal protein expression for c-MYC positive control, Cyclin A and, GRB2, reported not to be regulated by c-MYC. Actin was used as a loading control. Right panel, graphical representation of protein expression relative to control in three independent Western blots. Error bars represent the standard deviations. Statistical significance was determined using the student’s t-test. (D and E) siRNA-mediated knockdown of c-MYC and si-MYC controls in TK-activated cell lines and examination LIG3 and PARP1 expression levels in (D) extracted mRNA by PCR in (left panel) 32D-FLT3/ITD and (right panel) MO7e-BCR-ABL1 cell lines. Columns represent the average fold-decrease in mRNA expression relative to each control, and error bars denote the standard deviations (E) (Left panel) Representative Western blot analysis of c-MYC, LIG3 and PARP1 proteins. Right panel, graphical representation of three independent experiments. Columns represent the average of 3 different experiments. Error bar represents the standard deviation. Statistical significance was determined using the student’s t-test.
Given the strong correlation of c-MYC mRNA levels with LIG3 and PARP1 mRNA levels in AML, we hypothesized that increased c-MYC expression may augment expression of LIG3 and PARP1 in TK-activated leukemias, in which c-MYC is a known to be expressed at high levels (15, 16). We first assessed protein levels of c-MYC, LIG3, and PARP1 in cell extracts from hematopoietic cell lines that stably express of BCR-ABL1 (MO7e-BCR-ABL1) or FLT3/ITD (32D-FLT3/ITD) and their respective parental controls (MO7e and 32Dcl3). In addition, leukemia cell lines endogenous protein levels were compared in FLT3/ITD-positive MOLM14 vs wild-type FLT3 REH and BCR-ABL1-positive K562 vs BCR-ABL1-negative MO7e leukemia cell lines. Fig. 1C shows that cells expressing TKs have an approximately two-fold increase in steady-state protein levels of c-MYC, LIG3 and PARP1 compared with controls (p < 0.05). Additionally, c-MYC-positive control Cyclin A (CCNA2) shows an approximately 2-fold increase in TK-activated cells, whereas GRB2, which has been reported not to be controlled by c-MYC (25), is not significantly altered (Fig 1C, lower panel).
c-MYC inhibition results in decreased LIG3 and PARP1 levels in FLT3/ITD- and BCR-ABL1-positive cells
Next, to determine whether depletion of endogenous c-MYC results in decreased levels of LIG3 and PARP1 transcripts and proteins, siRNA-mediated knockdown of c-MYC was performed in MO7e-BCR-ABL1 and 32D-FLT3/ITD, followed by Q-PCR and Western blotting analysis of mRNA and protein levels, respectively. To ensure that observed effects of siRNA-mediated c-MYC knockdown were not due to cell death, we performed experiments over a 48-hour period and confirmed cell viability by trypan blue dye exclusion as well as by MTS-based viability assays (Supplementary Fig. S1A and B). SiRNA-mediated knockdown, using pooled oligonucleotides of c-MYC (>50%) led to a significant reduction (p< 0.01) in both mRNA and protein levels of LIG3 and PARP1 (Fig. 1D,E). Similar results were observed upon c-MYC knockdown in the FLT3/ITD-positive cell line MOLM14 (Supplementary Fig. S1C). SiRNA-mediated c-MYC knockdown, using single oligonucleotides yielded similar results to experiments using pooled oligonucleotides (Supplementary Fig. S1D). Furthermore, chemical inhibition of c-MYC (10058-F4 [selleckchem.com]) which inhibits MYC-MAX binding and prevents transcriptional activation of c-MYC targets (26), resulted in a significant reduction of LIG3 and PARP1 transcripts (Supplemetary Fig. S1E).
c-MYC induces the transcription of LIG3 and PARP1 in FLT3/ITD- and BCR-ABL1-positive cells
Database searches using Matinspector from (Genomatix, Munich, Germany) and TF Search (Parallel Application TRC Laboratory, Japan) revealed several predicted c-MYC binding sites (E-box motifs) within the defined PARP1 and LIG3 promoter regions (Fig. 2A). In addition, ChIP-seq data from ENCODE (UCSC Genome Browser) revealed the increased binding of c-MYC to several DSB repair gene promoters, including PARP1 and LIG3 in the BCR-ABL1-positive cell line K562, similar to well established c-MYC targets, CAD and CCNA2 (Fig. 2B). In addition, genes reported not to be controlled by c-MYC, such as GRB2 (25) or immediate early gene FOS (27) had relatively little c-MYC binding (Fig. 2B). To determine the significance of c-MYC binding to the promoters of ALT-NHEJ genes, the promoter regions of LIG3 and PARP1 (containing the putative c-MYC binding sites) were cloned into pGL4.10 luciferase expression plasmids. Plasmid constructs were transfected into 32D/ITD and MO7e-BCR-ABL1 cells, and induction of luciferase expression via endogenous c-MYC was determined by luciferase assay (methods). Cells transfected with a plasmid containing either the LIG3 or PARP1 promoter, compared to a promoterless control vector, induced luciferase expression 4- to 25-fold (Fig. S2A). Fig. 2C shows that baseline LIG3 and PARP1 promoter induction of luciferase expression in MO7e-BCR-ABL1 and 32D/ITD cells was approximately 3-fold higher (p<0.01) compared to that in parental control cells. Importantly, c-MYC knockdown in 32D/ITD and MO7e-BCR-ABL1 cells resulted in a significant reduction (p<0.05) in promoter activity as shown in Fig. 2C.
Figure 2. c-MYC induces the transcription of LIG3 and PARP1 in FLT3/ITD- and BCR-ABL1-positive cells.

(A) Schematic diagram of PARP1 and LIG3 promoters cloned into pGL4.10 luciferase construct. Black inverted triangles represent the putative c-MYC binding sites within each cloned promoter, and empty triangles represent c-MYC binding sties that were mutated by site-directed mutagenesis (B) ChIP-Seq data in K562 cells obtained from ENCODE shows c-MYC binding to the promoters of several DSB repair genes, c-MYC targets and genes not regulated by c-MYC. Peak heights represent the signal strength, with LIG3 and PARP1 (rectangle) exhibiting high levels of c-MYC binding similar to positive controls, CAD and CCNA2. Negative controls Fos and GRB2 are also shown. (C) Luciferase assays conducted in 32D, 32D/ITD, MO7e and MO7e-BCR/ABL (MBA) cells transfected with either siRNAs against MYC (siMYC) or controls siRNA (siCtrl) and co-transfected with the LIG3 or PARP1 promoter constructs. Values shown are relative luciferase activity (FF) normalized to Renilla (RL) that served as a control for transfection efficiency. Columns represent the average of three independent assays and the error bar represents the standard deviation. (D) c-MYC induction by Q-PCR analysis of mRNA from MO7e-BCR-ABL1 cells transfected with pBABE-puro-mycER and treated with either 300nM 4-OHT or ethanol (vehicle control) for the indicated times (x-axis). mRNA expression levels of LIG3, PARP1 and positive control CCDN2 (y-axis) are shown for 4-OHT treated cells relative to vehicle controls. The inset below the graph is a representative Western blot showing expression of mycER (~97kDa). Molecular weight (kDa) markers are shown. (E) Luciferase activity of transfected LIG3 and PARP1 wild-type (luc-WT) and mutant (luc-mut) promoter constructs in 293T cells co-transfected with either control pcDNA3 or pcDNA3-cmyc. The error bar represents the standard deviation. Statistical significance was determined using the Student’s t-test. (F) Chromatin immunoprecipitation (ChIP) of LIG3 and PARP1 in MO7e-BCR-ABL1 cells. Q PCR analysis of mRNA from cells immunoprecipitated with myc antibody (N-262), positive control CAD, or negative control chromosome 22 region (Ch22) or IgG antibody. Graphical representation of fold enrichment relative to IgG controls from three independent ChIP assays. The error bar represents the standard deviation. Statistical significance (p<0.05) was determined using the Student’s t-test.
To further confirm that c-MYC induces the transcription of the LIG3 and PARP1 genes, we utilized two c-MYC expression vectors described by Ricci et al (21). First, pBABE-puro-mycER was transfected into MO7e-BCR-ABL1 cells which were subsequently treated with either vehicle (ethanol) or 300nM 4-hydroxytamoxifen (4-OHT). 4-OHT induces translocation of mycER from the cytoplasm to the nucleus and activation of c-MYC-mediated transcription. Induction of c-MYC resulted in approximately a 1.7-fold (p=0.014) increase in LIG3 mRNA and a 2.5-fold (p=0.005) increase in PARP1 mRNA levels at 12 hours post induction with 4-OHT. Cyclin D2 (CCND2) mRNA, which was induced approximately 2-fold (p= 0.01) by mycER, was used as a positive control, as cyclin D2 was previously shown to be a downstream target of mycER-induced transcription (28). MycER protein expression was also verified by Western blot analysis (Fig. 2D). We also used a well-established c-MYC overexpression model (21) in which the c-MYC expression vector, pcDNA3-cmyc, is co-transfected into 293T cells along with PARP1 and LIG3 promoter luciferase constructs and luciferase activity is measured in comparison to empty vector pcDNA3 controls. C-MYC over-expression (Fig. 2E) resulted in 2.5-fold (p=0.013) and 1.8-fold (p=0.005) increase in LIG3 and PARP1 promoter activities, respectively. Notably, when compared to parental controls, LIG3 and PARP1 luciferase activity levels were similar to those in TK-positive cells (2- to 3-fold increase, Fig. 2C). Furthermore, site-directed mutagenesis of the highest-probability c-MYC binding sites (as determined by Genomatix software) within the LIG3 and PARP1 promoter-reporter constructs (Fig. 2A), resulted in a significant decrease in LIG3 (40%; p= 0.02) and PARP1 (30%; p= 0.004) promoter activities, compared to cells transfected with wild-type promoter-reporter vectors (Fig. 2E). Importantly, cells transfected with the mutant promoter-reporter constructs showed significantly decreased luciferase activity, compared to controls (Fig. 2E). We obtained similar results as above using a promoter-reporter vector of carbamoyl-phosphate synthase 2 (CAD), a well-established target of c-MYC-induced transcription (29), as a positive control (Fig. S2B).
To determine whether c-MYC actually binds to the promoters of the LIG3 and PARP1 genes and to confirm the ChIP-seq data (from ENCODE) observed in K562 cells (Fig 2B), we performed chromatin immunoprecipitation (ChIP) in extracts from MO7e-BCR-ABL1-positive (Fig. 2F) and FLT3/ITD-positive MOLM14 cells (data not shown), followed by PCR-amplification of LIG3 and PARP1 promoter regions spanning the putative c-MYC binding sites. Q-PCR analysis of ChIP products confirmed c-MYC binding to the LIG3 and PARP1 promoters, compared with positive (CAD), negative (Ch22) and IgG controls (Fig. 2F).
c-MYC regulation of LIG3 and PARP1 expression is dependent on expression of FLT3/ITD- and BCR-ABL1
Given that c-MYC is a downstream target of the FLT3/ITD and BCR-ABL1 TKs (15, 30) we sought to investigate whether c-MYC regulation of LIG3 and PARP1 is dependent on the activities of these TKs. Therefore, FLT3/ITD-positive MOLM14 and MO7e-BCR-ABL1 cells were treated with TKIs (50nM of the FLT3 inhibitor CEP701 or 5uM of the BCR-ABL1 inhibitor imatinib, respectively) or DMSO. Thereafter, Q-PCR analysis of mRNA and Western blot analysis of protein levels were performed. FLT3/ITD inhibition resulted in greater than 75% (p<0.005) decrease in c-MYC, LIG3, and PARP1 mRNA levels (Fig. 3A and B). Imatinib treatment of MO7e-BCR-ABL1 cells resulted in smaller (20–30%) yet significant decrease (p<0.04) in mRNA and protein levels of c-MYC, LIG3 and PARP1 (Fig. 3A and B). As seen in Fig. 3C, TKI treatment of MOLM14 and MO7e-BCR-ABL1 resulted in similar effects on the protein levels of LIG3 and PARP1 as was observed for mRNA levels (Fig. 3A and B). Of note, we did not observe the presence of cleaved PARP1 band (Fig. 3C), suggesting that the downregulation observed was not a result of the cells undergoing apoptosis. To ensure that PARP1 can undergo cleavage at this time point, we treated cells with 50nM (MOLM14) or 1uM (MO7e-BCR-ABL1) etoposide and demonstrated PARP1 cleavage (Fig. 3D). Given that c-MYC phosphorylation at Serine 62 (Ser62) is an indication of its signaling activity (31), we performed Western blotting analysis for this c-MYC phosphorylation site following treatment with the TKIs described above and showed that phospho-Ser62 is decreased significantly following treatment in both cell lines (Fig. 3E).
Figure. 3. Treatment with TKIs reduces levels of PARP1 and LIG3 in AML and CML cell lines.
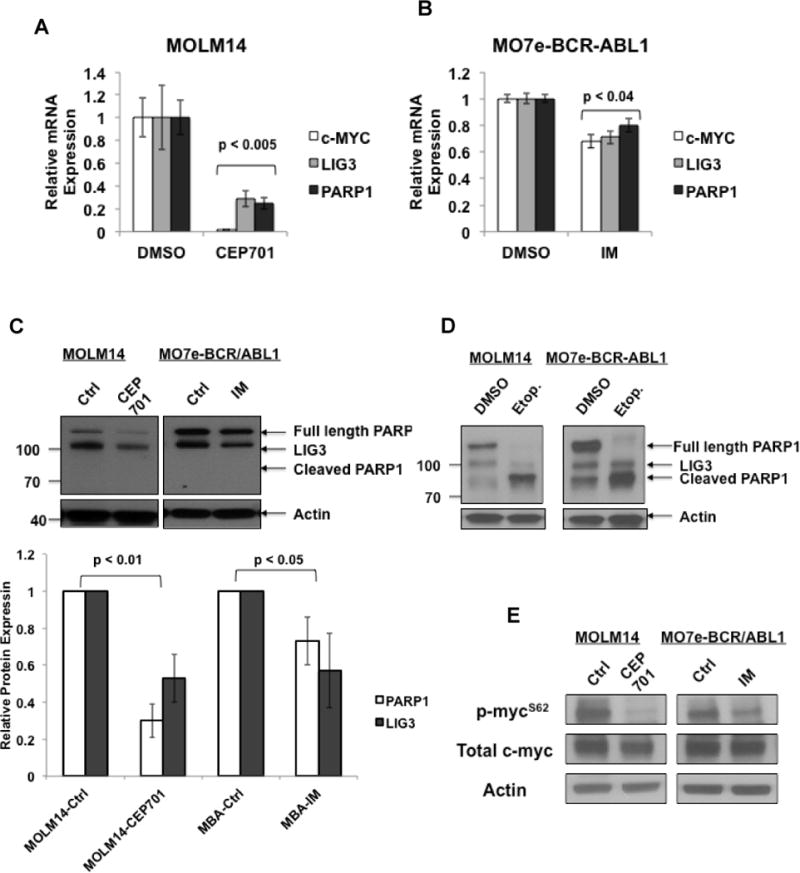
Expression levels of c-MYC, LIG3 and PARP1 in TK-activated cell lines treated with treated 50nM CEP701 or DMSO 5uM imatinib (IM) or DMSO (controls) followed by mRNA extraction and Q-PCR analysis. Relative expression of mRNA in (A) MOLM14 cells (B) MO7e-BCR-ABL1. The error bar represents the standard deviation. Statistical significance was determined using the student’s t-test. (C) Upper panel, Representative Western blot of LIG3 and PARP1 proteins. Lower panel, graph representation of relative protein expression levels from three independent experiments. (D) Western blot analysis for PARP cleavage following treatment with etoposide (E) Western blot analysis for c-MYC phosphorylation at serine 62 (p-mycS62) and total c-MYC. Actin was used as a loading control in C, D and E.
c-MYC-negatively-regulated miRNAs decrease LIG3 and PARP1 expression in FLT3/ITD- and BCR-ABL1-positive cells
C-MYC is known to specifically regulate expression of multiple miRNAs, the majority of which undergo negative regulation by this transcription factor(19). To determine whether c-MYC-mediated decrease in miRNAs levels in leukemia cells may be an additional mechanism of LIG3 and PARP1 regulation, we examined the 3′-UTR and coding sequences of LIG3 and PARP1 for potential c-MYC-regulated miRNA binding sites (Table S2). LIG3 and PARP1 are predicted targets of multiple c-MYC-regulated miRNAs, including miR-22, miR-27a, miR-34a, and miR-150. In our initial studies, we used microarray analysis of mRNA expression and mature miRNA levels from multiple AML cell lines and primary samples (Table S1) shown in Fig. 1 A and B, to to look for a correlative relationship between LIG3 or PARP1 and the above miRNAs. There was a significant inverse correlation between LIG3 and miR-22 and -150 (Pearson r < −0.3, Fig. 4A); similarly, there is a significant inverse correlation between PARP1 and miR-22 and -150 (Pearson r < −0.3, Fig. 4B). Not surprisingly, there was a significant inverse correlation between c-MYC and miR-22 and -150 (Pearson’s r < −0.3, Fig. 4C). In contrast, miR-34a showed neither a positive nor inverse correlation with either LIG3 or PARP1 (Fig. S3A). While miR-27a demonstrated an inverse correlation with PARP1, it did not significantly correlate with LIG3 (Fig. S3B). Accordingly, we focused on miR-22 and miR-150 for the remainder of this study.
Figure 4. c-MYC-repressed miRNAs are inversely correlated with levels of c-MYC, LIG3, and PARP1.

Graphs of correlations between endogenous mRNA expression levels of (A) LIG3 and miR-22 (left panel) or miR-150 (right panel) (B) PARP1 and miR-22 (left panel) or miR-150 (right panel) (C) c-MYC and miR-22 (left panel) or miR-150 (right panel). Pearsons coefficient (r) values are shown. (D and E) Representative Western blots in TK-activated cell lines (D) MOLM14 and (E) MO7e-BCR-ABL1, overexpressing a combination of miR-22 and -150 combination. Left panel, representative Western blot of PARP1 and LIG3 proteins. Molecular weight (kDa) markers are indicated. Right panel, graphical representation of four independent experiments with error bars denoting the standard deviation. Statistical significance was determined using the student’s t-test.
First, we sought to confirm c-MYC repression of miR-22 and -150 in our cell lines. We performed siRNA-mediated knockdown of c-MYC in three different cell lines (MOLM14, K562, and MO7e-BCR-ABL1) followed by qRT-PCR analysis of miR-22 and -150 levels. There was a significant increase in levels of miR-22 and/or -150 in cells transfected with siRNA targeting c-MYC, compared to cells transfected with control siRNA (Fig. S3C). To confirm that miR-22 and miR-150 are involved in regulating the expression of LIG3 and PARP1 in TK-activated leukemias, we transiently transfected a combination of miR-22 and miR-150 mimics (50nM each) into MOLM14 and MO7e-BCR/ABL cells, and assessed LIG3 and PARP1 protein levels at 72 hours post-transfection. We verified the transfection efficiency and confirmed high levels of miRs by Q-PCR in several cell lines (Fig. S3D). Transfection of a combination of miR-22 and -150 produced an approximately 35–40% decrease in LIG3 (p<0.05) and PARP1 (p<0.05) protein levels, compared to MOLM14, and MO7e-BCR-ABL1 cells transfected with a non-specific control (NSC) miRNA (Fig. 4D, E).
Depletion of c-MYC and overexpression of c-MYC-regulated miR-150 and miR-22 decrease ALT-NHEJ activity in FLT3/ITD- and BCR-ABL1-positive cells
To determine whether c-MYC regulation of key ALT-NHEJ components in TK-activated leukemias also plays a role in ALT-NHEJ repair activity, we performed an established in vivo plasmid-based end-joining assay (11, 12, 32, 33) following chemical and siRNA inhibition of c-MYC. In this assay (Fig. 5A), pUC18 plasmid is linearized by restriction-enzyme digestion to simulate a DSB, then transfected into cells. The repaired plasmid is isolated from cells and transformed into DH5α bacteria, which are then plated on agar plates. Colonies (representing clones of one repaired plasmid) are picked for plasmid isolation and sequencing of repair junctions. C-MYC was inhibited in MOLM14 and MO7e-BCR/ABL1 using chemical inhibition (10058-F4) or siRNA technology, followed by the above end-joining assays. c-MYC knockdown and consequent decrease in LIG3 and PARP1 levels were confirmed by Western blot analysis (Fig. S4A and B). We also verified that the transfection efficiency of the linearized pUC18 plasmid was not affected by c-MYC knockdown by co-transfection with a GFP-expressing vector (Fig. S4C). Approximately 30 colonies from three independent experiments were analyzed by colony PCR and sequencing of the region that encompasses the repaired DSB. MOLM14 cells depleted of c-MYC by chemical inhibition had a general reduction in the size of DNA deletions when compared to DMSO-treated cells (Fig. 5B, p<0.015). Similar results were obtained following siRNA-mediated knockdown of c-MYC in MO7e-BCR-ABL1 cells (Figure 5C, p<0.05). Importantly, repair assays performed with linearized pUC18 DNA controls showed very few colonies (Fig S4D). In addition, we analyzed the data for the proportion of large deletions (>20bps) vs small deletions (<20bps) that are characteristic of c-NHEJ (Fig. S4E). Approximately 50% of DSBs are repaired in Tk-activated cell lines MOLM14 and MO7e-BCR-ABL1 with small deletions occurring at the repair junctions. Following, siRNA knockdown of c-MYC, the fraction of small deletions actually increases significantly (Fig. S4E). In fact, siRNA knockdown of c-MYC results in a slight but insignificant increase in NHEJ efficiency using a different NHEJ reporter (pEGFP-Pem1-Ad2) assay {Fattah, 2010 #11559}. In contrast, knockdown of control c-NHEJ factor, LIG4, reduces NHEJ efficiency significantly (Fig S4F, G). This suggests that c-MYC may not contribute significantly to c-NHEJ activity.
Figure 5. c-MYC inhibition and miR-22/150 overexpression results in deceased ALT-NHEJ activity in TK-positive cell lines.

(A) Schematic diagram of the NHEJ assay. A DSB is created with a restriction-enzyme (EcoRI) digest of pUC18 plasmid. The linearized plasmid is transfected into treated cells to allow repair. After 24 hours, the repaired plasmids are harvested and transformed in E. coli and plated on LB agar plates. Clones are isolated for plasmid DNA extraction and sequencing of repair junctions. (B) NHEJ assay in MOLM14 cells treated with either DMSO or 30uM c-MYC inhibitor 10058-F4 (MYCi). Upper panel, representative agarose gel of PCR products of plasmid DNA isolated from DMSO- or 10058-F4 (MYCi)-treated cells. Lower panel, graphical representation of the size of deletions determined by sequencing of the repair junctions in individual plasmid DNAs represented by symbols. The average size of deletion (in bp) is indicated by a horizontal black line. (C – F) End-joining experiments in MO7e-BCR-ABL1 cells depleted of c-MYC by siRNA technology or using siRNA controls (C–D) or overexpressing a combination of miR-22 and miR150 (E-F). (C and E) Graphical representation of deletion sizes determined by sequencing of the repair junctions. Individual sequenced plasmid DNAs are represented by symbols. The average size of deletion (in bp) is indicated by a horizontal black line. (D and F). Plasmids sequences analyzed for DNA sequence Microhomology and graphed as fractions of DNA sequences that exhibited microhomologies (>2bp) (Microhom) or no microhomology-mediated repair (No Microhom). The table below the graph summarizes plasmid sequences analyzed from experiment and control groups, according to the lengths of microhomologies
Moreover, c-MYC depletion decreased the frequency of microhomology-mediated repair (Fig. 5D, p<0.05). Notably, overexpression of miR-150 and miR-22 in MO7e-BCR-ABL1 cells produced the same results seen with c-MYC inhibition (Fig. 5E and 5F). The reduction in LIG3 and PARP1 protein levels post miR overexpression was confirmed by Western blot analysis (Fig. S4H).
c-MYC mRNA levels correlate with LIG3 and PARP1 mRNA and inversely correlate with miR-22 and -150 in primary samples from CML patients
To determine whether primary CML samples demonstrated increased expression levels of c-MYC and decreased levels of miR-150 and -22, we first examined mRNA samples from 21 CML patients (Table 1) and compared transcript levels of c-MYC, LIG3 and PARP1 in peripheral blood (PB) and bone marrow (BM) mononuclear cells (MNC) samples with those of normal bone marrow (BM) controls. As seen in Fig. 6A and B, there was a strong positive correlation between c-MYC mRNA levels and LIG3 (Pearson’s r = 0.88, p<0.001) and PARP1 (Pearson’s r = 0.84, p<0.001) mRNA levels. c-MYC expression was increased in twelve of twenty-one (57%), compared with normal controls, Of the twelve CML samples with increased c-MYC levels, nine (75%) also had increased levels of LIG3 and PARP1 (Table 1). In these samples with increased levels of c-MYC, PARP1 and LIG3, there was there was no bias towards a particular disease phase, or response to TKIs. Interestingly, however, two of three TKI-resistant CML patients (Table 1, PT #8, and #16) with T315I-BCR-ABL1 mutations (34, 35) had increased levels of c-MYC, LIG3 and PARP1.
Table 1.
Clinical and Molecular Features of CML Patients
| Patient | Phase | Mutations | IM Status | LIG3 up | PARP1 up | c-MYC up |
|---|---|---|---|---|---|---|
| 1 | Chronic | None | Senstitive | Y | Y | Y |
| 2 | Chronic | None | Senstitive | Y | Y | N |
| 3 | Chronic | None | Resistant | Y | Y | Y |
| 4 | Chronic | None | Senstitive | Y | N | N |
| 5 | Chronic | None | Senstitive | N | N | N |
| 6* | Blast Crisis | None | Resistant | Y | Y | Y |
| 7 | Blast Crisis | None | Resistant | N | N | N |
| 8* | Blast Crisis | T315l | Resistant | Y | Y | Y |
| 9 | Accelerated | None | Resistant | N | N | N |
| 10 | Unknown | Unknown | Unknown | N | Y | Y |
| 11 | Chronic | None | Resistant | Y | Y | Y |
| 12 | Chronic | None | Resistant | Y | Y | Y |
| 13* | Chronic | None | Sensitive | Y | Y | Y |
| 14 | Chronic | None | Sensitive | Y | Y | Y |
| 15 | Blast Crisis | None | Resistant | N | Y | N |
| 16 | Blast Crisis | T315l | Resistant | Y | Y | Y |
| 17* | Blast Crisis | None | Sensitive | N | N | N |
| 18* | Blast Crisis | None | Resistant | N | N | N |
| 19* | Chronic | None | Sensitive | N | N | Y |
| 20* | Blast Crisis | None | Resistant | N | N | N |
| 21* | Blast Crisis | T315l | Resistant | N | N | Y |
Abbreviations: IM= imatinib, Increased LIG3, PARP1 and c-MYC expression relative to normal control BMMNC and based on p<0.05 by TTEST, Y=yes, N=no.
denote patient samples used for miRNA analysis.
Figure 6. c-MYC levels strongly correlate with LIG3 and PARP1 levels, and miR-22 and miR-150 are reduced in primary CML patient samples.

Graphical representation of correlations between mRNA expression levels of (A) c-MYC (X-axis) and LIG3 (Y-axis) and (B) c-MYC (X-axis) and PARP1(Y-axis) in 21 CML patient samples (Table 1). Pearson’s correlation values are shown (r). (C) Relative expression levels of miR-150 from CML patient samples (n=10) and normal bone marrow (NBM1 and NBM2) from healthy individuals. Error bars represent the standard deviations from three independent PCR analyses. Statistical significance was determined using the student’s t-test. (D) Average expression levels of miR-22 in CML patient samples by phase of disease: chronic phase and blast crisis (E) Expression levels of miR- 22, 27a and 150 in MNC from 5 matched CML patient samples in chronic phase (CP) and blast crisis (BC), compared to 3 healthy donors (HD) using Nanostring Technologies and nCounter Analysis. Upper panel, relative mRNA expression represented as fold changes compared to HD. CP (Grey bars), BC (White bars), expression levels HD (Black bars) expression levels +/− SD (error bars). * p<0.005 based on Student’s t-test. Lower panel, heat map for miR-150 in 5 CP, 5 BC and 3 HD samples. Z score was used to determine relative colors (green= low expression; black= no difference; red= high expression) for each sample in the heat map.
CML patient samples were next evaluated for expression of c-MYC-regulated miRs. We first examined mRNA for miR-150 in a sub-set of the above-described patient samples (n=8; Table 1, PT #6, #8, #13, #17, #18, #20, #21) for which mRNA was available and 2 additionally acquired CML patients (Table S3; #22 in chronic phase and #23 in blast crisis) by miRNA Q-PCR analysis and compared results to normal bone marrow cells (NBMC) (n=2). There was a significant decrease (p<0.05) in c-MYC-repressed miR-150 levels in all CML samples, compared to NBMC (Fig. 6C). We next examined miR-22 expression levels in CML patient samples in chronic phase (N=4; Table S3; PT #13, #24, #25, and #26) vs those in in blast crisis (N=4; Table S3; #8, #18, #20, and #23). In contrast to results with miR-150, miR-22 expression levels appear to be decreased significantly (p<0.01) in CML-BC patients when compared to CML-CP patients (Fig. 6D). To confirm these data, we analyzed NanoString mIR expression arrays from a separate cohort of CML patient mRNAs from paired MNC samples of CML-CP (n=5) and -BC (n=5) patients and HD (healthy donors, n=3) controls. As expected from the earlier correlation studies (Fig. S3B), miR-27a showed no significant differences in expression between CML patient samples and HD controls (Fig. 6E). In contrast, and as seen in the first cohort of CML patient samples (Fig. 6C), levels of miR-150 were significantly decreased in both CP and BC compared to HD, and there were no significant expression differences between CP and BC in the 5 paired patient samples examined (Fig. 6E). Similar to the above results (Fig. 6D), compared with HD controls, miR-22 expression was decreased significantly only in BC, compared with HD controls (Fig. 6E).
Discussion
Leukemia cells expressing constitutively activated BCR-ABL1 or FLT3/ITD TKs are characterized by a highly error-prone and alternative form of NHEJ (ALT-NHEJ) involving increased expression of LIG3 and PARP1, that is likely responsible for much of the error-prone end-joining repair (12, 14). To date, the mechanism through which TKs activate ALT-NHEJ factors had not been elucidated. Our studies have, for the first time, linked c-MYC, a key downstream target of both BCR-ABL1 and FLT3/ITD to increased expression of the ALT-NHEJ factors LIG3 and PARP1 and increased ALT NHEJ repair activity.
While elevated expression of c-MYC occurs frequently in human cancers and is associated with tumor progression and poor clinical outcome (36), the effect of high levels of c-MYC on global gene regulation is poorly understood. Recent studies suggest that high levels of c-MYC accumulate in the promoter regions of active genes and cause transcriptional amplification, producing increased levels of transcripts within the cell’s gene expression program (37). Our studies demonstrate that c-MYC binds to the promoter regions of both LIG3 and PARP1, thereby increasing transcriptional activity, leading to increased ALT-NHEJ in TK-activated cells. Thus, ALT-NHEJ activity, which is present at low levels in normal cells (11), is increased through transcriptional activity of the key pathway components LIG3 and PARP1, likely leading to acquisition of genomic alterations. Given c-MYC’s role in cell cycle progression, the possibility exists that the expression of PARP1 and LIG3 and therefore ALT NHEJ may be influenced by the cell cycle. Studies performed in cells enriched for particular phases of the cell cycle should clarify this question. Given that c-MYC is known to bind several DSB repair genes (18), increased expression of LIG3 and PARP1 may be part of a dysregulated expression program involving abnormal DSB repair that leads to genomic instability. Therefore similar studies are merited for other DSB repair genes. Thus, while increased ALT NHEJ activity may be a plausible mechanism for genomic instability, and studies that measure actual chromosomal instability are warranted (38).
The most extensively utilized point of gene regulation is at the level of transcription, while miRNAs are thought to be involved in “fine-tuning” gene regulation. miRNAs are involved in the regulation of many cancer-specific signaling pathways in hematopoiesis, and are aberrantly expressed in hematologic malignancies (39). c-MYC is known to negatively regulate a group of miRNAs, which is thought to contribute to tumorigenesis (19). In the context of LIG3 and PARP1 regulation, we propose in addition to its transcriptional regulation of these genes, c-MYC also represses miRNAs (miR-22 and miR-150) that target LIG3 and PARP1 transcripts. Indeed, this dual regulation by c-MYC was previously reported; c-MYC was shown to regulate the transcription factor E2F1 through direct transcription and activation of miRNAs that target E2F1 (40). Another group showed that expression of EZH2, a protein involved in regulation of gene expression, was amplified as a result of c-MYC-mediated repression of miR-26a, which targets EZH2 (41).
We previously reported that treatment of BCR-ABL1- and FLT3/ITD-positive cells with TK inhibitors (TKIs) leads to decreased expression of the ALT-NHEJ components LIG3 and PARP1 (8, 13, 14) and decreased DSB repair errors, indicating that the altered DNA repair is due to one or more of the effectors of these signaling pathways (12). Our studies here show that the downstream TK target c-MYC mediates expression of the ALT NHEJ factors PARP1 and LIG3 that is dependent on BCR-ABL1 or FLT3/ITD. Furthermore, our studies demonstrate that the TKI CEP-701 strongly downregulates expression of c-MYC, LIG3, and PARP1 in FLT3/ITD-positive cells, compared with a weaker effect of imatinib in BCR-ABL1-positive cells. One explanation is that the mechanisms of drug action of the specific inhibitors may differ. Whereas imatinib targets BCR-ABL1 activity, studies have shown that CEP701 inhibits FLT3 and Jak2 (42), both of which are important for c-MYC activity (15, 30). Another explanation may be that the mechanisms of c-MYC activation may differ in the two models of TK-activated leukemia. In Bcr-Abl1-positive leukemias, Jak2 mediates the increase c-MYC RNA expression but also interferes with proteasome-dependent degradation of c-Myc protein. (30, 43). In contrast to studies in BCR-ABL1-positive cells, while gene expression induced by FLT3/ITD or constitutively activated wild-type FLT3 signaling induces high expression levels of c-MYC(15), few mechanistic studies have been reported to elucidate how c-MYC is regulated by FLT3/ITD.
Previous studies demonstrate that c-MYC expression increases as CML progresses to blast crisis, and this overexpression induces aberrant DNA synthesis, suggesting a role for c-MYC in disease progression through promoting genomic instability (44). Our studies shows that in the majority (75%) of CML patient samples (irrespective of disease stage) with increased c-MYC expression, also demonstrate increased LIG3 and PARP1 expression. This suggests that increased ALT NHEJ is promoted throughout the course of CML disease. However, in a minority (25%) of primary CML samples c-MYC expression is not correlated with LIG3 and PARP1 expression, suggesting that additional molecular mechanisms may be involved in regulating LIG3 and PARP1 and ALT NHEJ. Expression of miR-150 which is negatively regulated by c-MYC was significantly decreased (compared to normal BM) in all CML patient samples tested, regardless of disease stage, suggesting that miR-150 is repressed in a BCR-ABL1-dependent manner (45). In contrast, miR-22 appears to be preferentially decreased in CML-BC patients. One study (46) demonstrated a role for miR-22 in inducing cellular senescence, thereby preventing cancer progression. Considering that one of the hallmarks of BC is increased genomic instability, it is tempting to speculate that miR-22 suppression in BC may override DNA damage-induced senescence, leading to promotion of genomic instability. Studies into the exact function of miR-22 in BC with respect to genomic instability would be of particular interest.
Published studies also demonstrate higher c-MYC expression in samples from patients not responding to imatinib therapy, compared to those responding to therapy (44). Interestingly, 2 of 3 BM samples with T315I mutations, connoting the greatest resistance to TKIs showed elevated steady-state levels of c-MYC, LIG3 and PARP1. Therefore, increased ALT-NHEJ may exist in a cellular milieu of increased c-MYC activity in which multiple aberrant repair pathways are active, leading to acquisition of TKI-resistant BCR-ABL1 mutations.
From a therapeutic standpoint, targeting c-MYC in leukemia may not be a viable option, considering the myriad of roles c-MYC plays in normal cells. However, the identification of other “drugable” downstream targets of c-MYC may be considered. With respect to our current study, PARP1 represents an attractive target for therapy, as PARP1 inhibitors are currently used in the clinic, and new ones are being investigated in clinical trials. In fact, a recent study by our collaborators demonstrated that PARP1 inhibition is synthetically lethal in TK-driven leukemias that exhibit defects in the HR pathway (47). Therefore, given that DSBs are lethal if not repaired, the c-MYC downstream targets LIG3 and PARP1 and other DSB repair factors may be attractive targets for therapy (48).
Supplementary Material
Implications.
In the context of TK-activated leukemias c-MYC contributes to aberrant DNA repair through downstream targets LIG3 and PARP1, which represent viable and attractive therapeutic targets.
Acknowledgments
We thank Jason G. Harb, Paolo Neviani and Justin Ellis (Ohio State University, Columbus OH) for scientific and technical assistance with the NanoString array preparation and data analysis.
Financial Support: This work was supported by Cigarette restitution funds of Maryland (F.R.), NIH grants CA095512 (D.P) and CA163800 (D.P.), by The CARIPLO Foundation Biomedical Scientific Research (C.G-P and D.P.), MSCRF (K.C. and S.K.) and by NCI Cancer Center Grant P30 CA134274.
Footnotes
Conflict of Interest
The authors report no conflict of interest.
References
- 1.Sallmyr A, Fan J, Rassool FV. Genomic instability in myeloid malignancies: increased reactive oxygen species (ROS), DNA double strand breaks (DSBs) and error-prone repair. Cancer Lett. 2008;270:1–9. doi: 10.1016/j.canlet.2008.03.036. [DOI] [PubMed] [Google Scholar]
- 2.Muvarak N, Nagaria P, Rassool FV. Genomic instability in chronic myeloid leukemia: targets for therapy? Current hematologic malignancy reports. 2012;7:94–102. doi: 10.1007/s11899-012-0119-0. [DOI] [PubMed] [Google Scholar]
- 3.Hartlerode AJ, Scully R. Mechanisms of double-strand break repair in somatic mammalian cells. Biochem J. 2009;423:157–68. doi: 10.1042/BJ20090942. [DOI] [PMC free article] [PubMed] [Google Scholar]
- 4.Khanna KK, Jackson SP. DNA double-strand breaks: signaling, repair and the cancer connection. Nat Genet. 2001;27:247–54. doi: 10.1038/85798. [DOI] [PubMed] [Google Scholar]
- 5.Lieber MR. The mechanism of human nonhomologous DNA end joining. J Biol Chem. 2008;283:1–5. doi: 10.1074/jbc.R700039200. [DOI] [PubMed] [Google Scholar]
- 6.Nussenzweig A, Nussenzweig MC. A backup DNA repair pathway moves to the forefront. Cell. 2007;131:223–5. doi: 10.1016/j.cell.2007.10.005. [DOI] [PubMed] [Google Scholar]
- 7.Iliakis G. Backup pathways of NHEJ in cells of higher eukaryotes: Cell cycle dependence. Radiother Oncol. 2009;92:310–15. doi: 10.1016/j.radonc.2009.06.024. [DOI] [PubMed] [Google Scholar]
- 8.Li L, Zhang L, Fan J, Greenberg K, Desiderio S, Rassool FV, et al. Defective nonhomologous end joining blocks B-cell development in FLT3/ITD mice. Blood. 2011;117:3131–9. doi: 10.1182/blood-2010-05-286070. [DOI] [PMC free article] [PubMed] [Google Scholar]
- 9.Slupianek A, Schmutte C, Tombline G, Nieborowska-Skorska M, Hoser G, Nowicki MO, et al. BCR/ABL regulates mammalian RecA homologs, resulting in drug resistance. Mol Cell. 2001;8:795–806. doi: 10.1016/s1097-2765(01)00357-4. [DOI] [PubMed] [Google Scholar]
- 10.Seedhouse CH, Hunter HM, Lloyd-Lewis B, Massip AM, Pallis M, Carter GI, et al. DNA repair contributes to the drug-resistant phenotype of primary acute myeloid leukaemia cells with FLT3 internal tandem duplications and is reversed by the FLT3 inhibitor PKC412. Leukemia. 2006;20:2130–6. doi: 10.1038/sj.leu.2404439. [DOI] [PubMed] [Google Scholar]
- 11.Sallmyr A, Tomkinson AE, Rassool FV. Up-regulation of WRN and DNA ligase IIIalpha in chronic myeloid leukemia: consequences for the repair of DNA double-strand breaks. Blood. 2008;112:1413–23. doi: 10.1182/blood-2007-07-104257. [DOI] [PMC free article] [PubMed] [Google Scholar]
- 12.Tobin LA, Robert C, Rapoport AP, Gojo I, Baer MR, Tomkinson AE, et al. Targeting abnormal DNA double-strand break repair in tyrosine kinase inhibitor-resistant chronic myeloid leukemias. Oncogene. 2012 doi: 10.1038/onc.2012.203. [DOI] [PMC free article] [PubMed] [Google Scholar]
- 13.Li L, Robert C, Rassool FV. The Role of Error-Prone Alternative Non-Homologous End-Joining in Genomic Instability in Cancer. 2011 chapter 4. [Google Scholar]
- 14.Fan J, Li L, Small D, Rassool F. Cells expressing FLT3/ITD mutations exhibit elevated repair errors generated through alternative NHEJ pathways: implications for genomic instability and therapy. Blood. 2010;116:5298–305. doi: 10.1182/blood-2010-03-272591. [DOI] [PMC free article] [PubMed] [Google Scholar]
- 15.Kim KT, Baird K, Davis S, Piloto O, Levis M, Li L, et al. Constitutive Fms-like tyrosine kinase 3 activation results in specific changes in gene expression in myeloid leukaemic cells. Br J Haematol. 2007;138:603–15. doi: 10.1111/j.1365-2141.2007.06696.x. [DOI] [PubMed] [Google Scholar]
- 16.Sawyers CL. Molecular consequences of the BCR-ABL translocation in chronic myelogenous leukemia. Leuk Lymphoma. 1993;11(Suppl 2):101–3. doi: 10.3109/10428199309064268. [DOI] [PubMed] [Google Scholar]
- 17.Delgado MD, Leon J. Myc roles in hematopoiesis and leukemia. Genes Cancer. 2010;1:605–16. doi: 10.1177/1947601910377495. [DOI] [PMC free article] [PubMed] [Google Scholar]
- 18.Luoto KR, Meng AX, Wasylishen AR, Zhao H, Coackley CL, Penn LZ, et al. Tumor cell kill by c-MYC depletion: role of MYC-regulated genes that control DNA double-strand break repair. Cancer Res. 2010;70:8748–59. doi: 10.1158/0008-5472.CAN-10-0944. [DOI] [PubMed] [Google Scholar]
- 19.Chang TC, Yu D, Lee YS, Wentzel EA, Arking DE, West KM, et al. Widespread microRNA repression by Myc contributes to tumorigenesis. Nat Genet. 2008;40:43–50. doi: 10.1038/ng.2007.30. [DOI] [PMC free article] [PubMed] [Google Scholar]
- 20.Lozzio CB, Lozzio BB, Feliu AS, Bamberger EG. Human myeloid cell lines. Blood. 1981;57:979–80. [PubMed] [Google Scholar]
- 21.Ricci MS, Jin Z, Dews M, Yu D, Thomas-Tikhonenko A, Dicker DT, et al. Direct repression of FLIP expression by c-myc is a major determinant of TRAIL sensitivity. Mol Cell Biol. 2004;24:8541–55. doi: 10.1128/MCB.24.19.8541-8555.2004. [DOI] [PMC free article] [PubMed] [Google Scholar]
- 22.Geiss GK, Bumgarner RE, Birditt B, Dahl T, Dowidar N, Dunaway DL, et al. Direct multiplexed measurement of gene expression with color-coded probe pairs. Nat Biotechnol. 2008;26:317–25. doi: 10.1038/nbt1385. [DOI] [PubMed] [Google Scholar]
- 23.Scheibner KA, Teaboldt B, Hauer MC, Chen X, Cherukuri S, Guo Y, et al. MiR-27a Functions as a Tumor Suppressor in Acute Leukemia by Regulating 14-3-3theta. PLoS One. 2012;7:e50895. doi: 10.1371/journal.pone.0050895. [DOI] [PMC free article] [PubMed] [Google Scholar]
- 24.Tobin LA, Robert C, Rapoport AP, Gojo I, Baer MR, Tomkinson AE, et al. Targeting abnormal DNA double-strand break repair in tyrosine kinase inhibitor-resistant chronic myeloid leukemias. Oncogene. 2013;32:1784–93. doi: 10.1038/onc.2012.203. [DOI] [PMC free article] [PubMed] [Google Scholar]
- 25.Notari M, Neviani P, Santhanam R, Blaser BW, Chang JS, Galietta A, et al. A MAPK/HNRPK pathway controls BCR/ABL oncogenic potential by regulating MYC mRNA translation. Blood. 2006;107:2507–16. doi: 10.1182/blood-2005-09-3732. [DOI] [PMC free article] [PubMed] [Google Scholar]
- 26.Loven J, Orlando DA, Sigova AA, Lin CY, Rahl PB, Burge CB, et al. Revisiting global gene expression analysis. Cell. 2012;151:476–82. doi: 10.1016/j.cell.2012.10.012. [DOI] [PMC free article] [PubMed] [Google Scholar]
- 27.Nie Z, Hu G, Wei G, Cui K, Yamane A, Resch W, et al. c-Myc is a universal amplifier of expressed genes in lymphocytes and embryonic stem cells. Cell. 2012;151:68–79. doi: 10.1016/j.cell.2012.08.033. [DOI] [PMC free article] [PubMed] [Google Scholar]
- 28.Vafa O, Wade M, Kern S, Beeche M, Pandita TK, Hampton GM, et al. c-Myc can induce DNA damage, increase reactive oxygen species, and mitigate p53 function: a mechanism for oncogene-induced genetic instability. Mol Cell. 2002;9:1031–44. doi: 10.1016/s1097-2765(02)00520-8. [DOI] [PubMed] [Google Scholar]
- 29.Boyd KE, Farnham PJ. Coexamination of site-specific transcription factor binding and promoter activity in living cells. Mol Cell Biol. 1999;19:8393–9. doi: 10.1128/mcb.19.12.8393. [DOI] [PMC free article] [PubMed] [Google Scholar]
- 30.Xie S, Lin H, Sun T, Arlinghaus RB. Jak2 is involved in c-Myc induction by Bcr-Abl. Oncogene. 2002;21:7137–46. doi: 10.1038/sj.onc.1205942. [DOI] [PubMed] [Google Scholar]
- 31.Wang X, Cunningham M, Zhang X, Tokarz S, Laraway B, Troxell M, et al. Phosphorylation regulates c-Myc’s oncogenic activity in the mammary gland. Cancer Res. 2011;71:925–36. doi: 10.1158/0008-5472.CAN-10-1032. [DOI] [PMC free article] [PubMed] [Google Scholar]
- 32.Hentges P, Ahnesorg P, Pitcher RS, Bruce CK, Kysela B, Green AJ, et al. Evolutionary and functional conservation of the DNA non-homologous end-joining protein, XLF/Cernunnos. J Biol Chem. 2006;281:37517–26. doi: 10.1074/jbc.M608727200. [DOI] [PubMed] [Google Scholar]
- 33.Hahnel PS, Enders B, Sasca D, Roos WP, Kaina B, Bullinger L, et al. Targeting components of the alternative NHEJ pathway sensitizes KRAS mutant leukemic cells to chemotherapy. Blood. 2014;123:2355–66. doi: 10.1182/blood-2013-01-477620. [DOI] [PubMed] [Google Scholar]
- 34.Hehlmann R, Jung-Munkwitz S, Saussele S. Treatment of chronic myeloid leukemia when imatinib fails. Expert Opin Pharmacother. 2011;12:269–83. doi: 10.1517/14656566.2011.533169. [DOI] [PubMed] [Google Scholar]
- 35.Jabbour E, Cortes J, Kantarjian H. Long-term outcomes in the second-line treatment of chronic myeloid leukemia: a review of tyrosine kinase inhibitors. Cancer. 2011;117:897–906. doi: 10.1002/cncr.25656. [DOI] [PMC free article] [PubMed] [Google Scholar]
- 36.Dang NH, Singla AK, Mackay EM, Jirik FR, Weljie AM. Targeted cancer therapeutics: biosynthetic and energetic pathways characterized by metabolomics and the interplay with key cancer regulatory factors. Curr Pharm Des. 2014;20:2637–47. doi: 10.2174/13816128113199990489. [DOI] [PubMed] [Google Scholar]
- 37.Lin CY, Loven J, Rahl PB, Paranal RM, Burge CB, Bradner JE, et al. Transcriptional amplification in tumor cells with elevated c-Myc. Cell. 2012;151:56–67. doi: 10.1016/j.cell.2012.08.026. [DOI] [PMC free article] [PubMed] [Google Scholar]
- 38.Byrne M, Wray J, Reinert B, Wu Y, Nickoloff J, Lee SH, et al. Mechanisms of oncogenic chromosomal translocations. Ann N Y Acad Sci. 2014;1310:89–97. doi: 10.1111/nyas.12370. [DOI] [PubMed] [Google Scholar]
- 39.Fatica A, Fazi F. MicroRNA-regulated pathways in hematological malignancies: how to avoid cells playing out of tune. International journal of molecular sciences. 2013;14:20930–53. doi: 10.3390/ijms141020930. [DOI] [PMC free article] [PubMed] [Google Scholar]
- 40.O’Donnell KA, Wentzel EA, Zeller KI, Dang CV, Mendell JT. c-Myc-regulated microRNAs modulate E2F1 expression. Nature. 2005;435:839–43. doi: 10.1038/nature03677. [DOI] [PubMed] [Google Scholar]
- 41.Sander S, Bullinger L, Klapproth K, Fiedler K, Kestler HA, Barth TF, et al. MYC stimulates EZH2 expression by repression of its negative regulator miR-26a. Blood. 2008;112:4202–12. doi: 10.1182/blood-2008-03-147645. [DOI] [PubMed] [Google Scholar]
- 42.Santos FP, Kantarjian HM, Jain N, Manshouri T, Thomas DA, Garcia-Manero G, et al. Phase 2 study of CEP-701, an orally available JAK2 inhibitor, in patients with primary or post-polycythemia vera/essential thrombocythemia myelofibrosis. Blood. 2010;115:1131–6. doi: 10.1182/blood-2009-10-246363. [DOI] [PMC free article] [PubMed] [Google Scholar]
- 43.Arlinghaus RB. The involvement of Bcr in leukemias with the Philadelphia chromosome. Crit Rev Oncog. 1998;9:1–18. doi: 10.1615/critrevoncog.v9.i1.10. [DOI] [PubMed] [Google Scholar]
- 44.Albajar M, Gomez-Casares MT, Llorca J, Mauleon I, Vaque JP, Acosta JC, et al. MYC in chronic myeloid leukemia: induction of aberrant DNA synthesis and association with poor response to imatinib. Mol Cancer Res. 2011;9:564–76. doi: 10.1158/1541-7786.MCR-10-0356. [DOI] [PubMed] [Google Scholar]
- 45.Agirre X, Jimenez-Velasco A, San Jose-Eneriz E, Garate L, Bandres E, Cordeu L, et al. Down-regulation of hsa-miR-10a in chronic myeloid leukemia CD34+ cells increases USF2-mediated cell growth. Mol Cancer Res. 2008;6:1830–40. doi: 10.1158/1541-7786.MCR-08-0167. [DOI] [PubMed] [Google Scholar]
- 46.Xu D, Takeshita F, Hino Y, Fukunaga S, Kudo Y, Tamaki A, et al. miR-22 represses cancer progression by inducing cellular senescence. J Cell Biol. 2011;193:409–24. doi: 10.1083/jcb.201010100. [DOI] [PMC free article] [PubMed] [Google Scholar]
- 47.Cramer-Morales K, Nieborowska-Skorska M, Scheibner K, Padget M, Irvine DA, Sliwinski T, et al. Personalized synthetic lethality induced by targeting RAD52 in leukemias identified by gene mutation and expression profile. Blood. 2013 doi: 10.1182/blood-2013-05-501072. [DOI] [PMC free article] [PubMed] [Google Scholar]
- 48.Rassool FV, Tomkinson AE. Targeting abnormal DNA double strand break repair in cancer. Cell Mol Life Sci. 2010;67:3699–710. doi: 10.1007/s00018-010-0493-5. [DOI] [PMC free article] [PubMed] [Google Scholar]
Associated Data
This section collects any data citations, data availability statements, or supplementary materials included in this article.