

Abstract
Autophagy is a mechanism by which cells degrade cellular material to provide nutrients and energy for survival during stress. The autophagy is thought to be a critical process for cancer stem (CSC) or tumor initiating cell maintenance but the mechanisms by which autophagy supports survival of CSCs remain poorly understood. In this study, inhibition of autophagy by knockdown of ATG7 or BECN1 modified the CD44+/CD24low/− population in breast cancer cells by regulating CD24 and IL6 secretion. In a breast cancer cell line that is independent of autophagy for survival, autophagy inhibition increased IL6 secretion to the media. On the other hand, in an autophagy-dependent cell line, autophagy inhibition decreased IL6 secretion, cell survival and mammosphere formation. In these cells, IL6 treatment or conditioned media from autophagy-competent cells rescued the deficiency in mammosphere formation induced by autophagy inhibition. These results reveal that autophagy regulates breast CSC maintenance in autophagy-dependent breast cancer cells by modulating IL6 secretion implicating autophagy as a potential therapeutic target in breast cancer.
Keywords: autophagy, breast cancer, cancer stem cells, IL6, mammosphere
Introduction
Macroautophagy (hereafter autophagy), from the Greek “self-eating” refers to the process by which cells turn over cytoplasmic components, proteins and organelles by delivering them into lysosomes via a double membrane vesicle called the autophagosome. The ATG (autophagy-related) proteins mediate the biogenesis of autophagosomes both in basal conditions and to a higher degree following autophagy induction by starvation or other types of stress. Autophagy thus promotes cellular fitness, prevents tissue damage and allows cells to sustain homeostasis in stressful situations (1, 2). Alterations in the autophagic pathway have been associated with diverse diseases including cancer. Recent studies have described important roles for autophagy during cancer development, progression and therapy (3, 4). During tumor initiation, autophagy can act as a tumor suppressor mechanism since it has been shown to limit known promoters of cancer initiation like inflammation, tissue damage and genome instability by degrading damaged mitochondria and reducing cellular oxidative stress. On the other hand, in later stages of cancer development, when tumor cells are exposed to stresses encountered during progression, metastasis and cancer therapy, autophagy is thought to be tumor promoting by enabling survival of tumor cells (4, 5) and supporting more malignant tumor types (6, 7). More recently, autophagy has also been related to CSC maintenance.
The CSC theory proposes that heterogeneity within a tumor is driven by a small population of cells which have self-renewal, tumorigenic capacities and pluripotency (8). Breast cancer follows this model since it has been shown that the CD44+/CD24low/− phenotype of cell surface markers, also found in normal stem cells in the breast, have an increased ability to form tumors in immunosuppressed mice than the bulk of the tumor cells (9). Important features of normal stem cells and CSCs include: capacity for self-renewal, ability to differentiate, active telomerase and anti-apoptotic pathways, increased membrane transporter activity, anchorage independence and ability to migrate (10). Due to all these characteristics, together with their relatively long life, it has been predicted that a quality control mechanism like autophagy is important for maintaining normal and cancer stem cell homeostasis (11).
We have previously reported that a subset of breast cancer cell lines enriched in the triple negative type is particularly dependent on autophagy for survival, even in nutrient rich conditions. We found that in these cells, autophagy regulates survival through modulation of STAT3 activity, which is often activated in TNBC (12). The IL6/ STAT3 pathway has been shown to be important for TNBC xenograft growth and breast CSC maintenance (13, 14), STAT3 activity is known to be regulated by IL-6 paracrine signaling in breast cancer cell lines (15) and autophagy was recently shown to modulate cytokine secretion and invasion in RAS-transformed breast cancer cells (16). Here, we found that gene-set enrichment analysis of RNAseq data comparing autophagy-dependent and independent breast cancer cell lines revealed that the pathways most affected by autophagy inhibition were related to stem cells, secretion and epithelial to mesenchymal transition. We also show that autophagy regulates the CD44+/CD24low/− phenotype and mammosphere formation in both the MCF7 and MDA-MB-468 breast cancer cell lines. Importantly, although autophagy regulates IL6 secretion in both the autophagy dependent (MDA-MB-468) and independent (MCF7) cell lines, autophagy inhibition increased IL6 secretion in MCF7 cells while it decreased it in MDA-MB-468 cells. Decreased mammosphere formation in MDA-MB-468 cells induced by autophagy inhibition was reverted with conditioned media from autophagy proficient MDA-MB-468 cells or with IL6 treatment. This identifies a mechanism by which autophagy selectively regulates CSC maintenance in autophagy-dependent breast cancer cells.
Methods
Cell Culture
All cell lines were acquired from the University of Colorado Tissue Culture Core in 2012 and had been previously authenticated by allele testing in October, 2011. After acquisition, cells were grown, frozen and each time they were thawed, they were not used for longer than 6 months. MCF7 cells were grown in Eagle’s MEM (Cellgro) supplemented with 0.01 mg/mL insulin (Life Technologies) and 10% FBS. MDA-MB-468 cells were grown in DMEM/F12 Ham (Life Technologies) supplemented with 10% FBS (Hyclone).
For cell proliferation/ death measurements, cells were plated in 96 well plates and imaged in an Incucyte system (Essen Instruments). After the first scan, Cell Event Caspase 3/7 Green detection reagent (5 μM, Life Technologies) or YOYO3 (50 nM, Life Technologies) were added. YOYO3 was added again after 72 h in culture. The growth curves were built from percent confluency measurements and the death curves represent green/ red fluorescence percent confluency acquired every 4h using a 10X objective. To verify that percent confluency was reflecting cell number, we performed similar experiments with mcherry-NLS expressing MCF7 and MDA-MB-468 cells treated with Cell Event Caspase 3–7 Green detection reagent. For these experiments, growth curves show nuclear count and death curves represent green object count per well. To normalize for cell number, the area under the curve (AUC) for both growth and death curves was calculated using GraphPad Prism 6.04.
For single-cell mammospheres, mcherry-NLS expressing MCF7 and MDA-MB-468 cells were transduced with either non-silencing, ATG7, or BECN1 shRNAs. Cells were selected and scraped from the dish with 0.25% trypsin which was neutralized immediately with complete Mammocult medium (StemCell Technologies). Cells were then centrifuged and resuspended in flow sorting buffer (1 mM EDTA, 25mM HEPES pH 7.0, 1% FBS, PBS) and sorted in a Moflo XDP 100 cell cytometer (Beckman Coulter, Inc.) to a 96 well plate ULA (ultra-low attachment) dish (Corning) containing complete Mammocult media (Stem Cell Technologies), one cell per well. Spheres were allowed to grow for 7 days after which the number of spheres was assessed in a Zeiss Axiovert 200M fluorescence microscope. A sphere was considered as such when it contained more than three cells (with red nuclei).
For the other mammosphere experiments, cherry-NLS expressing cells were prepared similarly. After scraping, trypsin was neutralized with Mammocult media and 1,000 cells were plated per well in 24 well ultra-low attachment dishes (Corning) containing Mammocult. Plates were imaged in an Incucyte system using whole-well imaging for 72h. Results show percent confluency of red fluorescence at the indicated times. For conditioned media, MDA-MB-468 cells were plated in ULA dishes containing complete Mammocult media at a density of 10,000 cells per mL and allowed to grow for 3 days. Medium was collected, centrifuged and used for the experiments. IL6 (eBioscience) was added at a concentration of 500 pg/mL at the same time the cells were plated.
Lentiviral Transduction
shRNA pLKO.1 vectors were acquired from the Functional Genomics Facility at the University of Colorado Cancer Center. Lentiviruses were prepared according to protocols published at the RNAi Consortium webpage (http://www.broadinstitute.org/rnai/trc/lib). Briefly, HEK293FT cells were transfected with each pLKO.1 vector (Non-silencing, ATG7 TRCN0000007587 or BECN1 TRCN0000033549), pMD2.g, pRRE and pRSV packaging plasmids using TransIT-LT1 (Mirus) transfection reagent. Viruses were collected at 24 and 48h, pooled and frozen at −80 C. For transduction, cells were treated with polybrene (Sigma, 8 μg/ml) before virus addition. Cells were selected with puromycin (1 μg/mL for MCF7 and 0.5 μg/mL for MDA-MB-468 cells) according to a dose-response curve for 2–3 days, then tripsinized and used for experiments.
For mammosphere experiments, lentiviruses containing the pLJM-cherry-NLS-BSD were prepared similarly. Cells were transduced, selected with blasticidin (10 μg/mL) and sorted for the high (top 15%) fluorescent population in a Moflo XDP 100 cell cytometer (Beckman Coulter, Inc.).
RNA sequencing
Three independent samples of MCF7 and MDA-MB-468 cells were transduced with lentiviruses containing either non-silencing or ATG7 shRNAs, selected and total RNA was extracted using RNeasy kit (QIAGEN). cDNA libraries were constructed for each sample using the TruSeq mRNA sample preparation kit # RS-122-9400 (Illumina). For each cell line, the six independently and uniquely indexed libraries (three samples for non-silencing and three for ATG7 kd) were pooled and loaded onto a single lane of an Illumina HiSeq2000 flow cell yielding single-pass 100-bp reads. The resulting sequence from the 12 cDNA libraries yielded were subjected to removal of low-quality bases [Phred score <15] using a custom Python script. The remaining sequences were mapped to the human genome (hg19) using GSNAP (17, 18). After strand alignment of human sequences, the fragments per kilobase of exon per million mapped reads (FPKM; a relative expression level normalized to the sum of all sequences mapped, as well as by specific gene length) was determined using CUFFLINKS (19–22). Total raw sequence reads and mapped reads per sample are shown in Table 1. In R, FPKM values from all 12 libraries were analyzed using the statistical transformation technique of principal components analysis (PCA) to visualize the differences between samples (Supplementary Figure 2). Samples were first separated by the largest component of variance (principal component 1, PC1), followed by separation of the next largest and independent component of variance (PC2). Also in R, FPKM values were used to determine significant differential gene expression using ANOVA. Differentially expressed genes (Q <0.01) per cell line are included in Supplementary Tables 1 and 2. These genes were subsequently analyzed with Gene Set Enrichment Analysis software (Broad Institute) (23, 24) to identify pathways of interest that may have been modified. Parameters used for the analysis are as follows: c2.all.v4.0.symbols.gmt database, 1000 permutations and gene set permutation type. A complete list of gene sets with FDR <0.05 is shown in Supplementary Table 3.
Table 1.
Total raw sequence reads and mapped reads per sample for the RNA sequencing data.
| Sample | Raw sequences reads | Reads after QC (%) | Mapped reads (%) |
|---|---|---|---|
| 468A7_1 | 28583193 | 28321958.0 (99.1) | 28297704 (99.9) |
| 468A7_2 | 26906628 | 26661458.0 (99.1) | 26639471 (99.9) |
| 468A7_3 | 27070626 | 26814965.0 (99.1) | 26787969 (99.9) |
| 468NS_1 | 25370864 | 25138412.0 (99.1) | 25119692 (99.9) |
| 468NS_2 | 22875810 | 22673906.0 (99.1) | 22659670 (99.9) |
| 468NS_3 | 28920336 | 28649708.0 (99.1) | 28621453 (99.9) |
| MCFA7_1 | 17805135 | 17611407.0 (98.9) | 17581063 (99.8) |
| MCFA7_2 | 20256758 | 20058892.0 (99.0) | 20033036 (99.9) |
| MCFA7_3 | 23675350 | 23440860.0 (99.0) | 23404136 (99.8) |
| MCFNS_1 | 20816640 | 20584224.0 (98.9) | 20546133 (99.8) |
| MCFNS_2 | 21233096 | 21005714.0 (98.9) | 20961466 (99.8) |
| MCFNS_3 | 22003398 | 21801611.0 (99.1) | 21775898 (99.9) |
Flow cytometry
For autophagic flux analysis, retroviruses expressing pBabe-GFP-cherry-LC3 (construct was a gift from Dr. Debnath’s lab at UCSF) were made using GP2-293 cells transfected with pBabe GFP-cherry-LC3 and pVSV-G plasmids using TransIT-LT1 (Mirus) transfection reagent. After puromycin selection, cells were sorted in a Moflo XDP 100 cell sorter (Beckman Coulter, Inc.) for the high (top 15%) fluorescent population. Normal or GFP-cherry-LC3 expressing cells were stained with V450 mouse anti-human CD44 (BD Bioscience, 561292) or Alexa Fluor 647 mouse anti-human CD24 (BD Bioscience, 561644) or their corresponding isotypes (V450 mouse IgG2b, k Isotype control and Alexa Fuor 647 mouse IgG2a, k Isotype control (BD Biosciences, catalog numbers 560374 and 557715), washed, resuspended in 0.5% BSA/ PBS and analyzed in a Gallios 561 (Beckman Coulter) flow cytometer.
Protein Isolation and Western Blots
Cells were washed with PBS and lysed with RIPA buffer containing protease inhibitor cocktail (Roche). Protein was quantitated using Bradford reagent. 10–20 μg of protein were loaded in a SDS-PAGE and PVDF membranes were probed with anti-LC3 (Novus-Biologicals, NB100-2220), ATG7 (Cell Signaling, 2631) or actin antibodies (Sigma, A5441). Blots were developed using an Odyssey Fc Imaging System (LI-COR Biosciences) with Image Studio Ver 4.0 software.
IL6 ELISA
Medium from cells expressing non-silencing, ATG7 or BECN1 shRNAs was collected 2 days (for MDA-MB-468) or 3 days (for MCF7) after plating. 25 μL were analyzed in an IL6 High Sensitivity ELISA plate (eBioscience Cat. BMS213HS) and quantified according to an IL6 standard curve.
Statistical Analysis
Statistical differences were determined using a two-sample equal variance Student’s t-Test.
Results and Discussion
We previously showed that breast cancer cell lines display a markedly different sensitivity to inhibition of autophagy with one group of breast cancer cell lines, enriched in the triple negative type, highly dependent on autophagy for survival even in nutrient rich, unstressed conditions while other tumor lines display only modest growth delay when autophagy is inhibited in the same conditions (12). We sought to investigate more about the mechanisms related to this autophagy-dependency with two different breast cancer cell lines: MCF7 and MDA-MB-468. The former being independent of autophagy and the latter, one of the cell lines that was amongst the most dependent on autophagy for survival in the unstressed state (12).
When autophagy was inhibited in MCF7 cells with ATG7 and BECN1 shRNAs, the cells proliferated slower (when measured as percent confluency) but did not show increased cell death as measured by caspase 3/7 activity (Fig. 1A and B). On the other hand, when autophagy was inhibited in MDA-MB-468 cells, proliferation was impaired and a significant amount of cell death was observed, both when compared to their non-silencing controls (Fig. 1A) and to autophagy-impaired MCF7 cells (Fig. 1B). Since MCF7 cells are caspase 3 deficient, cell death was measured with two different methods, with a fluorogenic caspase 3–7 substrate and with YOYO3 staining, a fluorescent dye with high affinity for nucleic acids that can only enter cells with permeable plasma membranes. Both measurements showed a significantly higher amount of cell death in autophagy-impaired MDA-MB-468 when compared to MCF7 cells, supporting our previous observations that MDA-MB-468 cells are autophagy dependent and MCF7 autophagy independent. Similar results were found when using nuclear count to measure cell number in combination with the caspase 3–7 substrate (Supplementary Fig. 1).
Figure 1. RNA sequencing in autophagy-dependent and independent breast cancer cell lines.
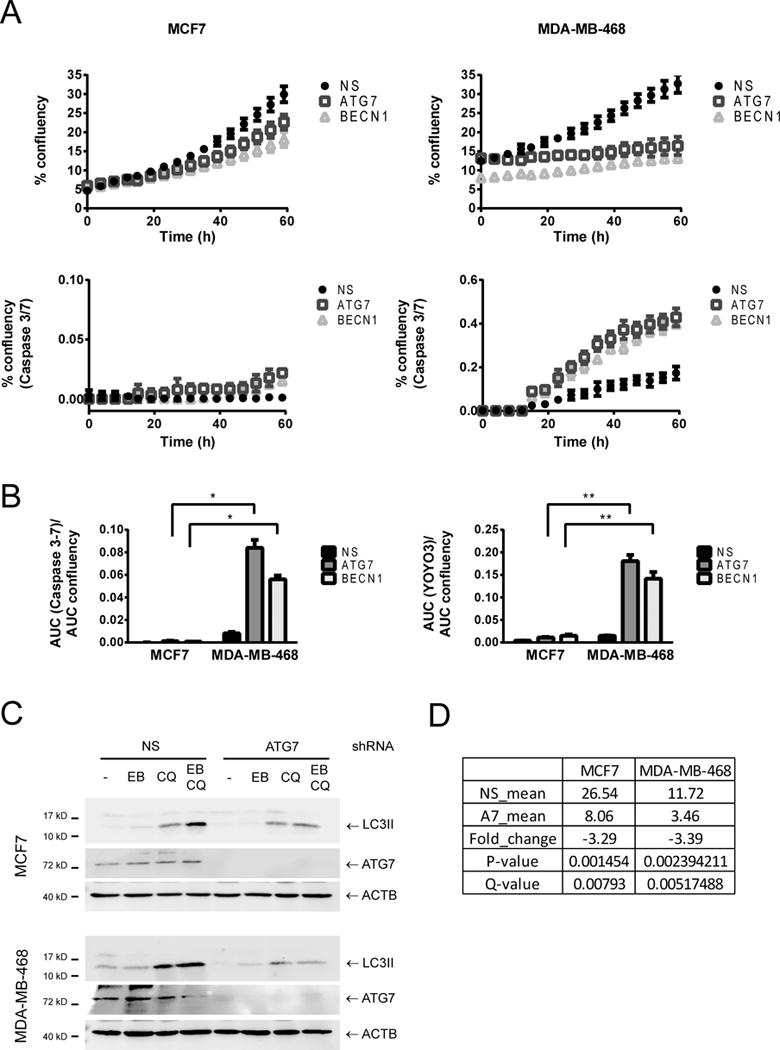
MCF7 and MDA-MB-468 cells were transduced with lentiviruses containing shRNAs for ATG7 or BECN1. Proliferation (% confluency in time lapse images), caspase activation (% confluency of a Caspase 3–7 substrate with green fluorescence) and total cell death (% confluency of YOYO3 red fluorescence in the same images) were measured in an Incucyte imaging system for 60 hours. In A, a representative curve of one out of three experiments performed in triplicate is shown. In B, the area under the curve (AUC) of either green % confluency (for caspase 3–7 activity) or red % confluency (for total cell death measured with YOYO3) was normalized to the AUC of the proliferation curve for normalization to cell number. Comparison of autophagy deficient (expressing ATG7 or BECN1 shRNAs) MDA-MB-468 cells with MCF7 cells shows a significant increase in cell death in MDA-MB-468 when compared to MCF7 cells in response to autophagy inhibition. * = p < 0.001, ** = p < 0.0001. In C, Western blot analysis of matched protein samples from the RNA samples sent for sequencing is shown. ATG7 shRNA decreased starvation-induced autophagy in both cell lines. Cells were treated with EBSS (EB), 20 μM chloroquine (CQ), or EBSS+CQ (EB CQ) for 2 h and collected for Western Blot. In D, the levels of ATG7 mRNA found in the RNA sequencing results are shown. The Table compares the mean value of the non-silencing (NS_mean) versus the ATG7 replicates (A7_mean).
To further understand the different effects of autophagy inhibition in these cells, we performed RNA sequencing in both cell lines following autophagy inhibition with ATG7 shRNA. Western blot analysis of matched protein samples showed that starvation-induced autophagy was decreased to similar levels in both cell lines (Fig. 1C). Moreover, the fold change decrease in ATG7 mRNA was similar in both sets of samples, suggesting a similar decrease in autophagy (Fig. 1D). QC results are shown in Table 1. Replicates clustered together in a principal component analysis of the RNAseq results and NS (non-silencing shRNA expressing cells) were closer to their respective A7 (ATG7 kd) samples in MCF7 than MDA-MB-468 cells, indicating a more pronounced change in gene expression in MDA-MB-468 than in MCF7 cells after autophagy inhibition (Supplementary Fig. 2). GSEA analysis of the RNA seq samples showed that many of the pathways affected after autophagy inhibition in both cell lines were related to cytokine secretion, EMT and stem cells (Supplementary Table 3).
It has been suggested that autophagy should be particularly important for the maintenance of cellular homeostasis in stem cells due to their ability to self-renew and differentiate and to their relatively long life (11). In CSCs, recent evidence suggests that autophagy does in fact have important roles in their maintenance. In breast cancer, it has been suggested that DCIS derived tumorigenic spheroids have higher levels of autophagy than epithelial cells in the same culture and treatment of DCIS culture cells with chloroquine suppressed xenograft tumor formation (25) suggesting that autophagy inhibition decreased the amount of tumor initiating cells. Another study reported that autophagy inhibition decreased the number of CD44+/CD24low/− cells in the MDAMB231 and JIMT1 breast cancer cell lines by increasing CD24 transcription (26). Finally, a recent study found increased autophagy in ALDH+ cells from mammospheres of the MCF7 cell line when compared to the bulk population of cells. In this same study, BECN 1 knockdown decreased mammosphere size and formation and decreased tumor formation of mammosphere cells from the MCF7, SKBR3 and SK-3rd breast cancer cell lines (27).
We used a flow cytometry based assay to analyze CD24 and CD44 staining in cells with different levels of autophagic flux (28) (Fig. 2A). In both MCF7 and MDA-MB-468 cell lines, the cells with low autophagic flux had decreased CD24 staining. In agreement with this observation, cells expressing a shRNA for ATG7 or BECN1 had lower levels of CD24 staining in both cell lines and no changes in CD44 were observed (Fig. 2B), indicating that cells with lower levels of autophagy also have lower levels of CD24 expression. This is in contrast to a previous report showing an increase in CD24 transcription after autophagy inhibition in the MDA-MB-231 and JIMT-1 breast cancer cell lines (26). These differences could be due to diverse effects of autophagy inhibition in different breast cancer subtypes or cell lines. In this regard, MDA-MB-231 cells have been classified as basal-like and JIMT-1 as belonging to the ERBB2 amplified and basal-like subtypes (29). Both cell lines have a high percentage of cells that belong to the CD44+/CD24low/− immunophenotype (26), reflecting more mesenchymal characteristics (30). In contrast, although both of the cell lines we studied belong to different breast cancer subtypes (MCF7 are luminal and MDA-MB-468 basal), they both express high levels of CD24 which has been associated with more differentiated epithelial features (30).
Figure 2. Autophagy inhibition changes the CD44+/CD24low/− population in breast cancer cell lines.
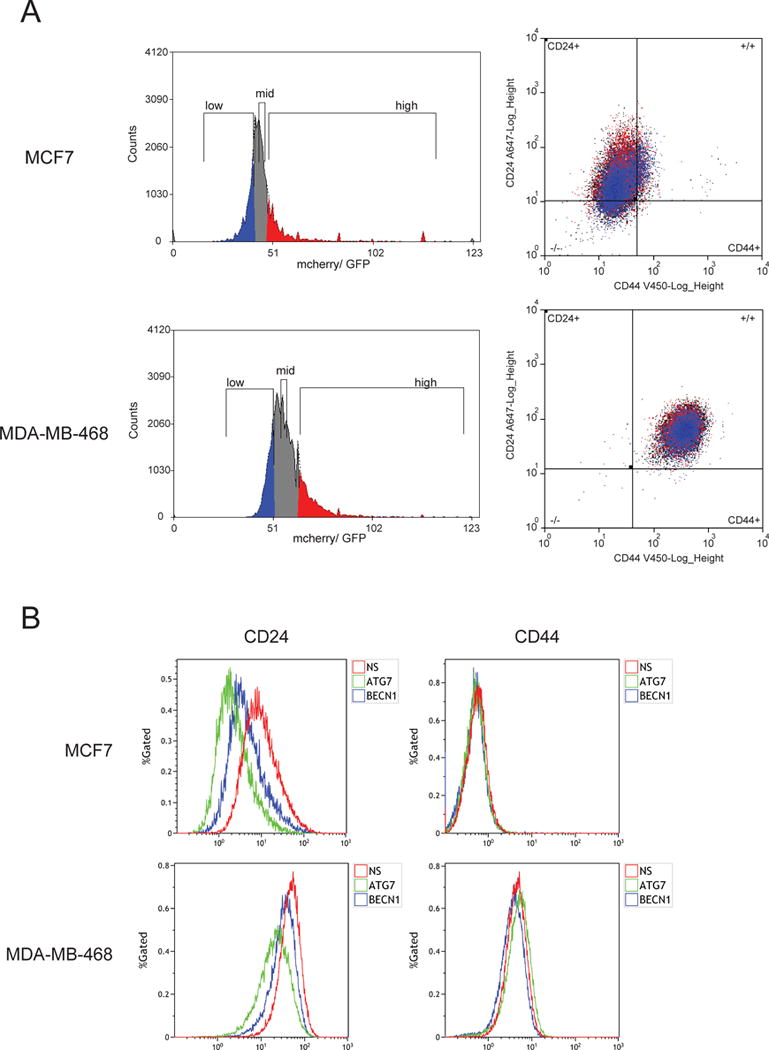
Autophagic flux was measured with a fluorescent tandem GFP-cherry-LC3 construct. Flux was determined by the mcherry/GFP ratio due to quenching of the GFP signal in the acidic lysosomal lumen. Cells with a high mcherry/GFP ratio (high number of autolysosomes, low number of autophagosomes) were gated for high autophagic flux whereas those with a low ratio (low number of autophagosomes, high number of autophagosomes) were gated for low flux. Gates were set so that they would include 20% of the population and the medium gate has the same median as the population. Cells with high and low autophagic flux show a differential distribution in the CD44/24 dot plots (A). Also, autophagy was inhibited with ATG7 or BECN1 shRNAs and CD44/24 staining was evaluated (B). NS = non-silencing shRNA. The figure shows one representative image of three independent experiments.
To determine if the decrease in CD24 staining after autophagy inhibition was associated with changes in the stem cell pool, we performed single-cell mammosphere experiments. Mammospheres are a good model for stem cell culture and maintenance since they are able to maintain mammary stem and progenitor cells in a relatively undifferentiated state (10). Both MCF7 and MDA-MB-468 cells showed decreased single cell mammosphere formation upon inhibition of autophagy with shRNAs after 7 days in culture and this decrease was more important in MDA-MB-468 cells (Fig. 3A) suggesting that autophagy is indeed important for CSC maintenance in both cell lines but it is particularly important in MDA-MB-468 cells.
Figure 3. Autophagy inhibition decreased single-cell mammosphere formation and differentially regulated IL6 secretion in breast cancer cell lines.
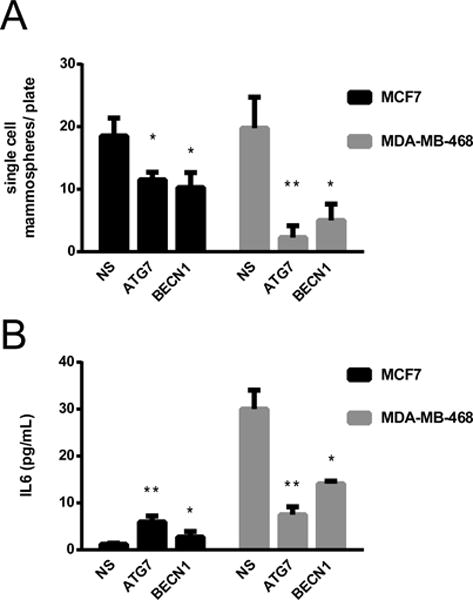
Nuclear cherry expressing cells were transduced with lentiviruses expressing non-silencing (NS), ATG7 or BECN1 shRNAs and sorted as a single cell per well in 96 well plates. Mammosphere formation was assessed in a fluorescent microscope 7 days after plating (A). In B, IL6 was evaluated in the medium of MCF7 and MDA-MB-468 cells with and without autophagy inhibition. Graphs show mean +/− SE of at least three independent experiments. * = p < 0.05, ** = p < 0.001.
Since our RNAseq results suggested that autophagy inhibition caused changes in chemokine secretion and since IL6 has been shown to be important for CSC maintenance (14), we assessed IL6 secretion in these cell lines. Autophagy inhibition with ATG7 or BECN1 shRNAs affected IL6 concentration in the media of both cell lines (Fig. 3B). Surprisingly however, autophagy inhibition induced IL6 secretion in the MCF7 cells but decreased it in the MDA-MB-468 cells. Recent evidence suggests an important role for autophagy in the regulation of cytokine production, particularly that of IL6 and IL8. In a model of oncogene-induced senescence, autophagy was necessary for efficient secretion of IL6 and IL8 and the induction of senescence (31). Also, autophagy promoted IL6 secretion and invasion in RAS-transformed breast cancer epithelial cells in 3D culture (16) and in TLR-triggered invasion of lung cancer cells (32). Finally, starvation-induced autophagy activated the JAK2/STAT3 pathway and induced IL6 secretion in HeLa cells (33). The previous studies support an important role for autophagy in the promotion of cytokine secretion. Our results extend these previous studies to show that autophagy can have opposing effects on the regulation of IL6 secretion in different cancer cells. While its inhibition increased IL6 production in one cell line, it decreased it in the other.
IL6 secretion is important for CSC maintenance and is sufficient to induce the CD44+/CD24low/− phenotype in breast cancer cell lines and tumors (14). Therefore, we studied whether autophagy-regulated IL6 secretion was responsible for the decrease in mammosphere formation in autophagy-impaired MDA-MB-468 cells. To continuously quantify mammosphere formation we used a time lapse imaging system and nuclear mcherry expressing cells. We found a similar decrease in mammosphere number in ATG7 shRNA expressing MDA-MB-468 cells with this method (Fig. 4A) than with the single-cell mammosphere experiment (Fig. 3A). IL6 treatment or conditioned media from non-transduced cells increased mammosphere confluency in autophagy-impaired MDA-MB-468 cells after 72 h in culture (Fig. 4B and Table 2). Conditioned media was better than IL6 treatment at decreasing the loss of mammospheres induced by autophagy inhibition suggesting that besides IL6, other autophagy-regulated secreted factors also contribute to mammosphere formation and CSC maintenance in breast cancer cells. Importantly, neither IL6 supplementation nor conditioned media fully reestablished mammosphere forming efficiency as seen in autophagy-competent MDA-MB-468 cells, suggesting a role for autophagy in the regulation of mammosphere formation other than the regulation of cytokine secretion. It is possible that other roles of autophagy like the regulation of protein turnover, cellular remodeling and the maintenance of cellular homeostasis are important for mammosphere maintenance due to the unique properties of stem cells (self-renewal, pluripotency, differentiation and quiescence) which have been suggested to make them particularly reliant in autophagy as an homeostatic mechanism (11).
Figure 4. Autophagy-regulated IL6 secretion facilitates mammosphere formation in the MDA-MB-468 breast cancer cell line.
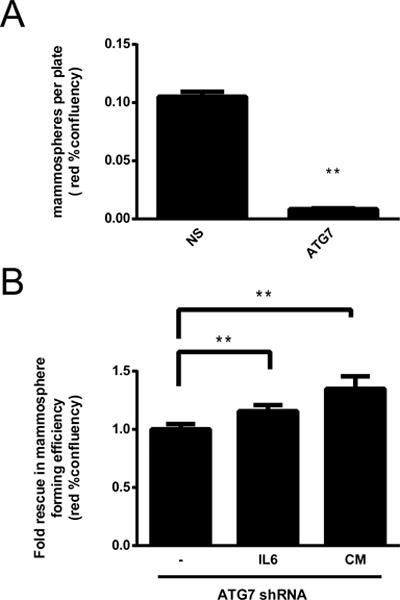
Nuclear cherry expressing MDA-MB-468 cells transduced with a non-silencing (NS) or an ATG7 shRNA were evaluated for mammosphere formation efficiency in an Incucyte system after 7 days (A) or after 48 h (B). In B, cells were treated with IL6 (500 pg/mL) at the time of plating or with conditioned media (CM) from non-transduced cells that had been previously grown as mammospheres for 3 days. Graphs in A and B show the mean +/− SE of three independent experiments, ** = p < 0.01.
Table 2.
IL6 treatment or conditioned media autophagy-competent MDA-MB-468 cells increased mammosphere formation in autophagy-impaired (ATG7 shRNA expressing) MDA-MB-468 cells after 72 h in culture. The table shows the mean +/− SE of three independent experiments.
| Atg7 shRNA | ||
|---|---|---|
| condition | IL6 | CM |
| % rescue in mammosphere formation | 15.6 +/− 5.4 | 34.8 +/− 10.7 |
| p value | 0.003 | 0.0002 |
In MCF7 cells, autophagy inhibition did not decrease mammosphere formation after 72 h in culture (Supplementary Figure 3), suggesting that autophagy inhibition does not have such an important effect on mammosphere maintenance in these cells as it does in MDA-MB-468 cells. IL6 supplementation increased mammosphere formation in autophagy-deficient MCF7 cells indicating that the increase in IL6 secretion induced by autophagy inhibition in these cells is not saturating (Supplementary Figure 3).
Our data supports and extends previous reports that have implicated autophagy as an important mechanism for the maintenance of CSCs. We identified the production of secreted factors, particularly IL6, one of the mechanisms by which autophagy supports CSCs and found that autophagy differentially regulates the secretion of this cytokine in breast cancer cell lines. While autophagy inhibition increased IL6 secretion by MCF7 cells, it decreased it in the MDA-MB-468 cell line, indicating that as with autophagy dependency itself whereby these tumor cells display markedly different effects of autophagy for survival under unstressed conditions; there is a context-dependent role for autophagy in the regulation of cytokine secretion in different tumor cells. Importantly, our data also suggest that autophagy inhibition therapy is likely to be most effective in cells like the MDA-MB-468 cell line, that are dependent on autophagy for survival and in which autophagy inhibition decreases IL6 production and mammosphere formation. On the other hand, the inhibition of autophagy could increase IL6 production and thus possibly induce undesirable effects in autophagy-independent cells like the MCF7 cell line. The first clinical trials where deliberate autophagy inhibition has been attempted in cancer patients are starting to be reported (34–39) and ongoing trials in breast cancer patients are taking place. Therefore our findings underscore the need for a thorough understanding of the effects of autophagy and its inhibition in different types of breast cancer and emphasize the need to develop a selection strategy to determine in which breast cancers autophagy should be targeted for an effective therapy and to avoid potential unwanted effects.
Supplementary Material
Implications.
Modulation of autophagy in breast cancer has different and even opposite effects, indicating the need for a selection strategy when trying to manipulate autophagy in the context of cancer therapy.
Acknowledgments
The authors appreciate the contribution to this research made by the following University of Colorado Cancer Center Research Shared Resources: Protein Production/Mab/Tissue Culture, Flow Cytometry, Bioinformatics and Microarray Cores.
Grant Support
Supported by NIH grants RO1 CA111421 and RO1CA150925 and the University of Colorado Cancer Center Shared Resources: Protein Production/Mab/Tissue Culture, Flow Cytometry, Bioinformatics and Microarray Cores that are supported by P30CA46934. PM was supported by a Cancer League of Colorado, Inc. postdoctoral fellowship.
Footnotes
The authors have no conflicts of interest to disclose.
References
- 1.Boya P, Reggiori F, Codogno P. Emerging regulation and functions of autophagy. Nat Cell Biol. 2013;15(7):713–20. doi: 10.1038/ncb2788. Epub 2013/07/03. [DOI] [PMC free article] [PubMed] [Google Scholar]
- 2.Maycotte P, Thorburn A. Targeting autophagy in breast cancer. World Journal of Clinical Oncology. 2014;5(3):224–40. doi: 10.5306/wjco.v5.i3.224. Epub 2014/08/13. [DOI] [PMC free article] [PubMed] [Google Scholar]
- 3.Thorburn A, Thamm DH, Gustafson DL. Autophagy and cancer therapy. Mol Pharmacol. 2014;85(6):830–8. doi: 10.1124/mol.114.091850. Epub 2014/02/28. [DOI] [PMC free article] [PubMed] [Google Scholar]
- 4.White E. Deconvoluting the context-dependent role for autophagy in cancer. Nat Rev Cancer. 2012 doi: 10.1038/nrc3262. Epub 2012/04/27. [DOI] [PMC free article] [PubMed] [Google Scholar]
- 5.Debnath J. The multifaceted roles of autophagy in tumors-implications for breast cancer. J Mammary Gland Biol Neoplasia. 2011;16(3):173–87. doi: 10.1007/s10911-011-9223-3. Epub 2011/07/23. [DOI] [PMC free article] [PubMed] [Google Scholar]
- 6.Guo JY, Karsli-Uzunbas G, Mathew R, Aisner SC, Kamphorst JJ, Strohecker AM, et al. Autophagy suppresses progression of K-ras-induced lung tumors to oncocytomas and maintains lipid homeostasis. Genes Dev. 2013;27(13):1447–61. doi: 10.1101/gad.219642.113. Epub 2013/07/05. [DOI] [PMC free article] [PubMed] [Google Scholar]
- 7.Strohecker AM, Guo JY, Karsli-Uzunbas G, Price SM, Chen GJ, Mathew R, et al. Autophagy Sustains Mitochondrial Glutamine Metabolism and Growth of BrafV600E-Driven Lung Tumors. Cancer Discov. 2013;3(11):1272–85. doi: 10.1158/2159-8290.CD-13-0397. Epub 2013/08/24. [DOI] [PMC free article] [PubMed] [Google Scholar]
- 8.Magee JA, Piskounova E, Morrison SJ. Cancer stem cells: impact, heterogeneity, and uncertainty. Cancer Cell. 2012;21(3):283–96. doi: 10.1016/j.ccr.2012.03.003. Epub 2012/03/24. [DOI] [PMC free article] [PubMed] [Google Scholar]
- 9.Al-Hajj M, Wicha MS, Benito-Hernandez A, Morrison SJ, Clarke MF. Prospective identification of tumorigenic breast cancer cells. Proc Natl Acad Sci U S A. 2003;100(7):3983–8. doi: 10.1073/pnas.0530291100. Epub 2003/03/12. [DOI] [PMC free article] [PubMed] [Google Scholar]
- 10.Dontu G, Al-Hajj M, Abdallah WM, Clarke MF, Wicha MS. Stem cells in normal breast development and breast cancer. Cell Prolif. 2003;36(Suppl 1):59–72. doi: 10.1046/j.1365-2184.36.s.1.6.x. Epub 2003/10/03. [DOI] [PMC free article] [PubMed] [Google Scholar]
- 11.Guan JL, Simon AK, Prescott M, Menendez JA, Liu F, Wang F, et al. Autophagy in stem cells. Autophagy. 2013;9(6):830–49. doi: 10.4161/auto.24132. Epub 2013/03/15. [DOI] [PMC free article] [PubMed] [Google Scholar]
- 12.Maycotte P, Gearheart CM, Barnard R, Aryal S, Mulcahy Levy JM, Fosmire SP, et al. STAT3-mediated autophagy dependence identifies subtypes of breast cancer where autophagy inhibition can be efficacious. Cancer Res. 2014;74(9):2579–90. doi: 10.1158/0008-5472.CAN-13-3470. Epub 2014/03/05. [DOI] [PMC free article] [PubMed] [Google Scholar]
- 13.Marotta LL, Almendro V, Marusyk A, Shipitsin M, Schemme J, Walker SR, et al. The JAK2/STAT3 signaling pathway is required for growth of CD44(+)CD24(−) stem cell-like breast cancer cells in human tumors. J Clin Invest. 2011;121(7):2723–35. doi: 10.1172/JCI44745. Epub 2011/06/03. [DOI] [PMC free article] [PubMed] [Google Scholar]
- 14.Iliopoulos D, Hirsch HA, Wang G, Struhl K. Inducible formation of breast cancer stem cells and their dynamic equilibrium with non-stem cancer cells via IL6 secretion. Proc Natl Acad Sci U S A. 2011;108(4):1397–402. doi: 10.1073/pnas.1018898108. Epub 2011/01/12. [DOI] [PMC free article] [PubMed] [Google Scholar]
- 15.Lieblein JC, Ball S, Hutzen B, Sasser AK, Lin HJ, Huang TH, et al. STAT3 can be activated through paracrine signaling in breast epithelial cells. BMC Cancer. 2008;8:302. doi: 10.1186/1471-2407-8-302. Epub 2008/10/23. [DOI] [PMC free article] [PubMed] [Google Scholar]
- 16.Lock R, Kenific CM, Leidal AM, Salas E, Debnath J. Autophagy-dependent production of secreted factors facilitates oncogenic RAS-driven invasion. Cancer Discov. 2014;4(4):466–79. doi: 10.1158/2159-8290.CD-13-0841. Epub 2014/02/12. [DOI] [PMC free article] [PubMed] [Google Scholar]
- 17.Wu TD, Watanabe CK. GMAP: a genomic mapping and alignment program for mRNA and EST sequences. Bioinformatics. 2005;21(9):1859–75. doi: 10.1093/bioinformatics/bti310. Epub 2005/02/25. [DOI] [PubMed] [Google Scholar]
- 18.Wu TD, Nacu S. Fast and SNP-tolerant detection of complex variants and splicing in short reads. Bioinformatics. 2010;26(7):873–81. doi: 10.1093/bioinformatics/btq057. Epub 2010/02/12. [DOI] [PMC free article] [PubMed] [Google Scholar]
- 19.Trapnell C, Williams BA, Pertea G, Mortazavi A, Kwan G, van Baren MJ, et al. Transcript assembly and quantification by RNA-Seq reveals unannotated transcripts and isoform switching during cell differentiation. Nat Biotechnol. 2010;28(5):511–5. doi: 10.1038/nbt.1621. Epub 2010/05/04. [DOI] [PMC free article] [PubMed] [Google Scholar]
- 20.Roberts A, Trapnell C, Donaghey J, Rinn JL, Pachter L. Improving RNA-Seq expression estimates by correcting for fragment bias. Genome Biol. 2011;12(3):R22. doi: 10.1186/gb-2011-12-3-r22. Epub 2011/03/18. [DOI] [PMC free article] [PubMed] [Google Scholar]
- 21.Roberts A, Pimentel H, Trapnell C, Pachter L. Identification of novel transcripts in annotated genomes using RNA-Seq. Bioinformatics. 2011;27(17):2325–9. doi: 10.1093/bioinformatics/btr355. Epub 2011/06/24. [DOI] [PubMed] [Google Scholar]
- 22.Trapnell C, Hendrickson DG, Sauvageau M, Goff L, Rinn JL, Pachter L. Differential analysis of gene regulation at transcript resolution with RNA-seq. Nat Biotechnol. 2013;31(1):46–53. doi: 10.1038/nbt.2450. Epub 2012/12/12. [DOI] [PMC free article] [PubMed] [Google Scholar]
- 23.Subramanian A, Tamayo P, Mootha VK, Mukherjee S, Ebert BL, Gillette MA, et al. Gene set enrichment analysis: a knowledge-based approach for interpreting genome-wide expression profiles. Proc Natl Acad Sci U S A. 2005;102(43):15545–50. doi: 10.1073/pnas.0506580102. Epub 2005/10/04. [DOI] [PMC free article] [PubMed] [Google Scholar]
- 24.Mootha VK, Lindgren CM, Eriksson KF, Subramanian A, Sihag S, Lehar J, et al. PGC-1alpha-responsive genes involved in oxidative phosphorylation are coordinately downregulated in human diabetes. Nat Genet. 2003;34(3):267–73. doi: 10.1038/ng1180. Epub 2003/06/17. [DOI] [PubMed] [Google Scholar]
- 25.Espina V, Mariani BD, Gallagher RI, Tran K, Banks S, Wiedemann J, et al. Malignant precursor cells pre-exist in human breast DCIS and require autophagy for survival. PLoS One. 2010;5(4):e10240. doi: 10.1371/journal.pone.0010240. Epub 2010/04/28. [DOI] [PMC free article] [PubMed] [Google Scholar]
- 26.Cufi S, Vazquez-Martin A, Oliveras-Ferraros C, Martin-Castillo B, Vellon L, Menendez JA. Autophagy positively regulates the CD44(+) CD24(−/low) breast cancer stem-like phenotype. Cell Cycle. 2011;10(22):3871–85. doi: 10.4161/cc.10.22.17976. Epub 2011/12/01. [DOI] [PubMed] [Google Scholar]
- 27.Gong C, Bauvy C, Tonelli G, Yue W, Delomenie C, Nicolas V, et al. Beclin 1 and autophagy are required for the tumorigenicity of breast cancer stem-like/progenitor cells. Oncogene. 2012 doi: 10.1038/onc.2012.252. Epub 2012/06/27. [DOI] [PMC free article] [PubMed] [Google Scholar]
- 28.Gump JM, Thorburn A. Sorting cells for basal and induced autophagic flux by quantitative ratiometric flow cytometry. Autophagy. 2014;10(7):1327–34. doi: 10.4161/auto.29394. Epub 2014/06/11. [DOI] [PMC free article] [PubMed] [Google Scholar]
- 29.Jonsson G, Staaf J, Olsson E, Heidenblad M, Vallon-Christersson J, Osoegawa K, et al. High-resolution genomic profiles of breast cancer cell lines assessed by tiling BAC array comparative genomic hybridization. Genes Chromosomes Cancer. 2007;46(6):543–58. doi: 10.1002/gcc.20438. Epub 2007/03/06. [DOI] [PubMed] [Google Scholar]
- 30.Ricardo S, Vieira AF, Gerhard R, Leitao D, Pinto R, Cameselle-Teijeiro JF, et al. Breast cancer stem cell markers CD44, CD24 and ALDH1: expression distribution within intrinsic molecular subtype. J Clin Pathol. 2011;64(11):937–46. doi: 10.1136/jcp.2011.090456. Epub 2011/06/18. [DOI] [PubMed] [Google Scholar]
- 31.Young AR, Narita M, Ferreira M, Kirschner K, Sadaie M, Darot JF, et al. Autophagy mediates the mitotic senescence transition. Genes Dev. 2009;23(7):798–803. doi: 10.1101/gad.519709. Epub 2009/03/13. [DOI] [PMC free article] [PubMed] [Google Scholar]
- 32.Zhan Z, Xie X, Cao H, Zhou X, Zhang XD, Fan H, et al. Autophagy facilitates TLR4- and TLR3-triggered migration and invasion of lung cancer cells through the promotion of TRAF6 ubiquitination. Autophagy. 2014;10(2):257–68. doi: 10.4161/auto.27162. Epub 2013/12/11. [DOI] [PMC free article] [PubMed] [Google Scholar]
- 33.Yoon S, Woo SU, Kang JH, Kim K, Kwon MH, Park S, et al. STAT3 transcriptional factor activated by reactive oxygen species induces IL6 in starvation-induced autophagy of cancer cells. Autophagy. 2010;6(8):1125–38. doi: 10.4161/auto.6.8.13547. Epub 2010/10/12. [DOI] [PubMed] [Google Scholar]
- 34.Rosenfeld MR, Ye X, Supko JG, Desideri S, Grossman SA, Brem S, et al. A phase I/II trial of hydroxychloroquine in conjunction with radiation therapy and concurrent and adjuvant temozolomide in patients with newly diagnosed glioblastoma multiforme. Autophagy. 2014;10(8):1359–68. doi: 10.4161/auto.28984. Epub 2014/07/06. [DOI] [PMC free article] [PubMed] [Google Scholar]
- 35.Rangwala R, Chang YC, Hu J, Algazy KM, Evans TL, Fecher LA, et al. Combined MTOR and autophagy inhibition: Phase I trial of hydroxychloroquine and temsirolimus in patients with advanced solid tumors and melanoma. Autophagy. 2014;10(8):1391–402. doi: 10.4161/auto.29119. Epub 2014/07/06. [DOI] [PMC free article] [PubMed] [Google Scholar]
- 36.Rangwala R, Leone R, Chang YC, Fecher LA, Schuchter LM, Kramer A, et al. Phase I trial of hydroxychloroquine with dose-intense temozolomide in patients with advanced solid tumors and melanoma. Autophagy. 2014;10(8):1369–79. doi: 10.4161/auto.29118. Epub 2014/07/06. [DOI] [PMC free article] [PubMed] [Google Scholar]
- 37.Vogl DT, Stadtmauer EA, Tan KS, Heitjan DF, Davis LE, Pontiggia L, et al. Combined autophagy and proteasome inhibition: A phase 1 trial of hydroxychloroquine and bortezomib in patients with relapsed/refractory myeloma. Autophagy. 2014;10(8):1380–90. doi: 10.4161/auto.29264. Epub 2014/07/06. [DOI] [PMC free article] [PubMed] [Google Scholar]
- 38.Mahalingam D, Mita M, Sarantopoulos J, Wood L, Amaravadi RK, Davis LE, et al. Combined autophagy and HDAC inhibition: A phase I safety, tolerability, pharmacokinetic, and pharmacodynamic analysis of hydroxychloroquine in combination with the HDAC inhibitor vorinostat in patients with advanced solid tumors. Autophagy. 2014;10(8):1403–14. doi: 10.4161/auto.29231. Epub 2014/07/06. [DOI] [PMC free article] [PubMed] [Google Scholar]
- 39.Barnard RA, Wittenburg LA, Amaravadi RK, Gustafson DL, Thorburn A, Thamm DH. Phase I clinical trial and pharmacodynamic evaluation of combination hydroxychloroquine and doxorubicin treatment in pet dogs treated for spontaneously occurring lymphoma. Autophagy. 2014;10(8):1415–25. doi: 10.4161/auto.29165. Epub 2014/07/06. [DOI] [PMC free article] [PubMed] [Google Scholar]
Associated Data
This section collects any data citations, data availability statements, or supplementary materials included in this article.