Abstract
Histotripsy thrombolysis is a noninvasive, drug-free and image-guided therapy that fractionates blood clots using well-controlled acoustic cavitation alone. Real-time quantitative feedback is highly desired during histotripsy thrombolysis treatment to monitor the progress of clot fractionation. Bubble-induced color Doppler (BCD) monitors the motion following cavitation generated by each histotripsy pulse, which has been shown in gel and ex vivo liver tissue to be correlated with histotripsy fractionation. In this paper we investigate the potential of BCD to quantitatively monitor histotripsy thrombolysis in real-time. To visualize clot fractionation, transparent three-layered fibrin clots were developed. Results show a coherent motion follows the cavitation generated by each histotripsy pulse with a push and rebound pattern. The temporal profile of this motion expanded and saturated as the treatment progressed. A strong correlation existed between the degree of histotripsy clot fractionation and two metrics extracted from BCD: time of peak rebound velocity (tPRV) and focal mean velocity at a fixed delay (Vf,delay). The saturation of clot fractionation (i.e., treatment completion) matched well with the saturations detected using tPRV and Vf,delay. The mean Pearson correlation coefficients between the progressions of clot fractionation and the two BCD metrics were 93.1% and 92.6% respectively. To validate the BCD feedback in in vitro clots, debris volume from histotripsy thrombolysis were obtained at different therapy doses and compared with Vf,delay. The increasing and saturation trends of debris volume and Vf,delay also had good agreement. Finally, a real-time BCD feedback algorithm to predict complete clot fractionation during histotripsy thrombolysis was developed and tested. This work demonstrated the potential of BCD to monitor histotripsy thrombolysis treatment in real-time.
Keywords: Thrombolysis, Histotripsy, Therapy Feedback, Color Doppler
Introduction
Pathological thrombosis is implicated in many cardiovascular diseases. Venous thrombi such as deep vein thrombosis (DVT) can lead to pulmonary embolism (PE) and arterial thrombi can manifest as myocardial infarction (MI) or ischemic stroke. Current clinical thrombolytic methods include the use of thrombolytic drugs (Adams et al. 1996; Bates and Ginsberg 2004; Kyrle and Eichinger 2005), catheter-based endovascular procedures (Kasirajan et al. 2001; Kim et al. 2006), or a combination of the two (Verhaeghe et al. 1997; Mewissen et al. 1999). Administering thrombolytic drugs systemically requires long treatment times and has a high risk of major bleeding. Catheter-based methods are site-specific but invasive and associated with frequent complications, such as bleeding, vessel damage, and infection.
Low intensity ultrasound has been shown to enhance the efficacy of thrombolytic agents in vitro (Pfaffenberger et al. 2003; Holland et al. 2008; Hitchcock et al. 2011), in vivo (Larsson et al. 1998), and in clinical trials (Alexandrov et al. 2004; Tsivgoulis et al. 2008; Tsivgoulis et al. 2010). There are also a number of studies that have successfully demonstrated the use of ultrasound and microbubbles to degrade clot in the presence or absence of thrombolytic agents (Datta et al. 2008; Brown et al. 2011; Culp et al. 2011). Studies using microbubbles have suggested that cavitation is correlated with significant enhancement of thrombolysis (Datta et al. 2006). High-Intensity Focused Ultrasound (HIFU) has been investigated as a stand-alone thrombolytic approach (Burgess et al. 2012; Wright et al. 2012), but the safety and efficiency of this technology still needs further investigation before clinical translation.
Histotripsy fractionates soft tissue by well-controlled acoustic cavitation using microsecond-long, high-intensity and focused ultrasound pulses (Xu et al. 2004; Xu et al. 2005; Xu et al. 2006; Xu et al. 2007; Xu et al. 2008). The feasibility of using histotripsy as a noninvasive, drug-free, and image-guided thrombolysis technique has been demonstrated previously. In vitro studies show that histotripsy can completely break down large clots (140-300 mg) within 5 min into particles no larger than 100 μm (Maxwell et al. 2009) and in vivo studies in a porcine deep vein thrombosis model, showed histotripsy therapy can re-establish blood flow and decrease thrombus burden (Maxwell et al. 2011).
Real-time quantitative feedback to monitor the progress of histotripsy clot fractionation would improve treatment efficacy and potentially minimize therapy dose, thereby improving safety. Specifically, as cavitation is known to cause hemolysis and platelet aggregation (Everbach et al. 1997; Poliachik et al. 1999; Poliachik et al. 2001; Poliachik et al. 2004), minimizing the therapy dose can mitigate these potential complications of histotripsy thrombolysis treatment. While a number of methods have been investigated to evaluate tissue damage by ultrasound thermal therapies using magnetic resonance imaging (MRI) (Vanne and Hynynen 2003; Arora et al. 2006; Jolesz 2009; Hynynen 2010) or ultrasound-based measurement of changes in tissue elasticity, sound speed or acoustic attenuation (Bush et al. 1993; Damianou et al. 1997; Souchon et al. 2003; Bercoff et al. 2004; Miller et al. 2004; Amini et al. 2005), none have been incorporated for real-time monitoring of ultrasound thrombolytic therapy.
Cavitation detection has been used to correlate stable and inertial cavitation with the effect of thrombolysis in ultrasound-enhanced thrombolysis (Datta et al. 2006). B-mode ultrasound imaging during histotripsy therapy can easily visualize cavitation due to the hyperechogenicity of the bubble cloud and provide precise targeting guidance, but its ability to serve as a quantitative therapy feedback is limited. Thus, we are investigating a modified color Doppler imaging method to monitor motion induced by histotripsy pulses as a real-time quantitative feedback for histotripsy thrombolysis. This motion is only detectable when a cavitation bubble cloud is formed, and therefore this monitoring method was termed bubble-induced color Doppler (BCD) feedback. The motion itself likely results from a net force exerted by rapid bubble expansion or collapse in the focal region and can last over 10 ms after each pulse. This force generates a variable motion response depending on mechanical properties of the tissue in the focal region. We hypothesize that as the clot is increasingly fractionated and becomes softer and eventually liquefied the change in the bubble-induced motion can be monitored and quantified using BCD feedback as a real-time measure of the degree of clot fractionation.
This study evaluates the potential of BCD feedback for histotripsy thrombolysis monitoring in four incremental steps. First, the bubble-induced motion is characterized in transparent fibrin clots using particle image velocimetry (PIV) that serves as the gold standard to compare with BCD. Second, using fibrin clots with a thin layer of embedded red blood cells, the visualized progress of histotripsy thrombolysis is quantitatively compared with its corresponding BCD feedback. Third, the correlation of BCD feedback with clot fractionation is validated in in vitro clots by comparing the BCD signal to the change of fractionated debris volume as a function of therapy dose. Finally, a real-time BCD feedback algorithm to predict complete clot fractionation during histotripsy thrombolysis is developed and tested.
Materials and Methods
Investigation of Bubble-induced Motion
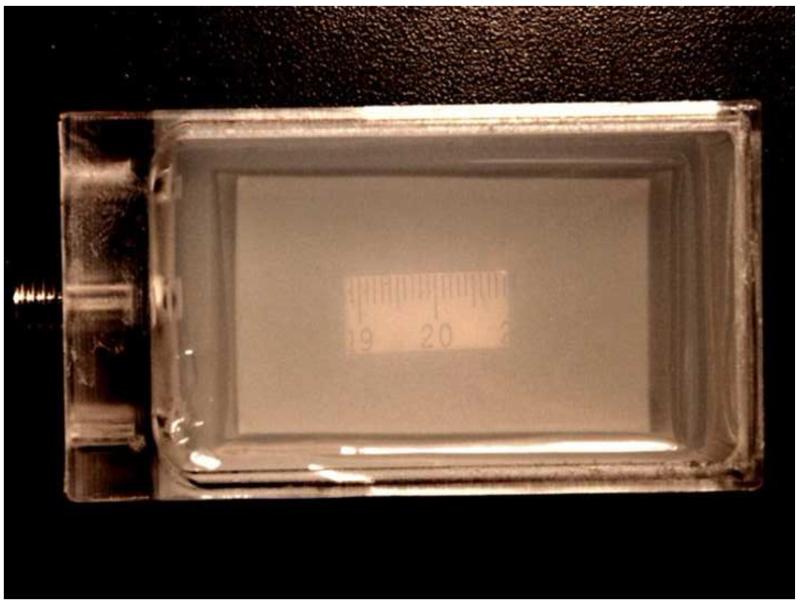
A transparent fibrin clot was developed to study the bubble-induced motion inside the clot (Figure 1). Reconstituted plasma was used to form the transparent fibrin clot, following the procedure as previously described (Janis et al. 2002). Fresh bovine blood was collected from a local abattoir. A citrate-phosphate-dextrose (CPD) solution (C7165; Sigma-Aldrich Co., St. Louis, MO, USA) was immediately added and gently mixed in the bovine blood as an anti-coagulant at a ratio of 1 mL CPD per 9 mL blood. The resulting blood sample was stored at 4°C and used within 72 hours. The blood sample was first centrifuged at a relative centrifugal force (RCF) of 1400g for 30 minutes. Then the plasma supernatant was separated from the buffy coat and red blood cell (RBC) pack, and incubated in 55°C water bath for 5 minutes to precipitate the native fibrinogen (Luo et al. 1996). The plasma solution was further centrifuged at a RCF of 1400g for 3 minutes to completely separate the precipitated fibrinogen. Bovine fibrinogen (F8630; Sigma-Aldrich Co., St. Louis, MO, USA) was then added to the processed plasma with a concentration of 400 mg/dL. To stimulate the clotting cascade, bovine thrombin (T4648; Sigma-Aldrich Co., St. Louis, MO, USA) and calcium chloride (21107; Sigma-Aldrich Co., St. Louis, MO, USA) were mixed with the reconstituted plasma to a final concentration of 1 IU/mL and 20mM/L respectively (Ryan et al. 1999; Bateman et al. 2005). The mixture was then poured into a rectangular mold and incubated in 37°C water bath for 2 hours. The m ature clot became a rectangular plate of approximately 30 mm (width) × 50 mm (length) × 5 mm (thickness) and embedded in transparent agarose hydrogel, which helped maintain the shape and position of the clot in water. The transparent fibrin clot allows for direct visualization of the cavitation microbubbles and bubble-induced motion inside the clot.
Figure 1.
Transparent fibrin clot embedded in agarose hydrogel. The clot was molded to be rectangular in shape. A ruler segment was placed under the clot to show the transparency.
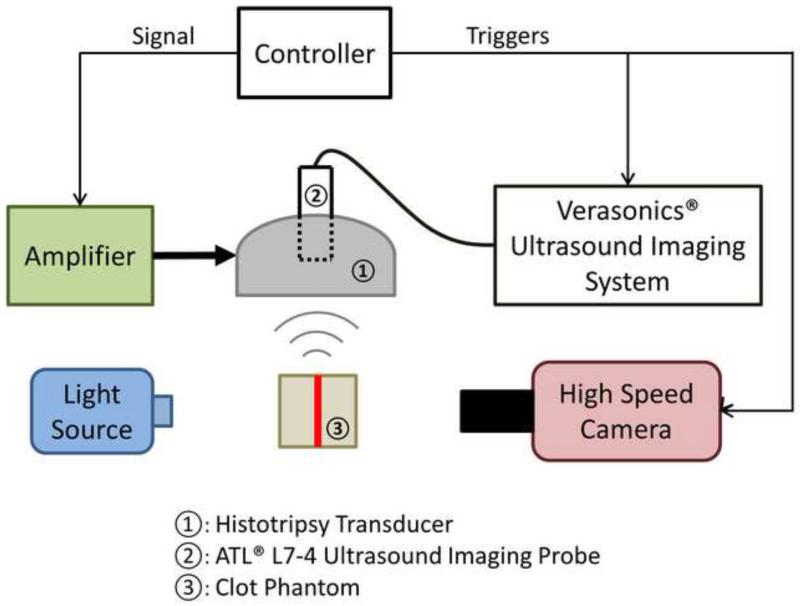
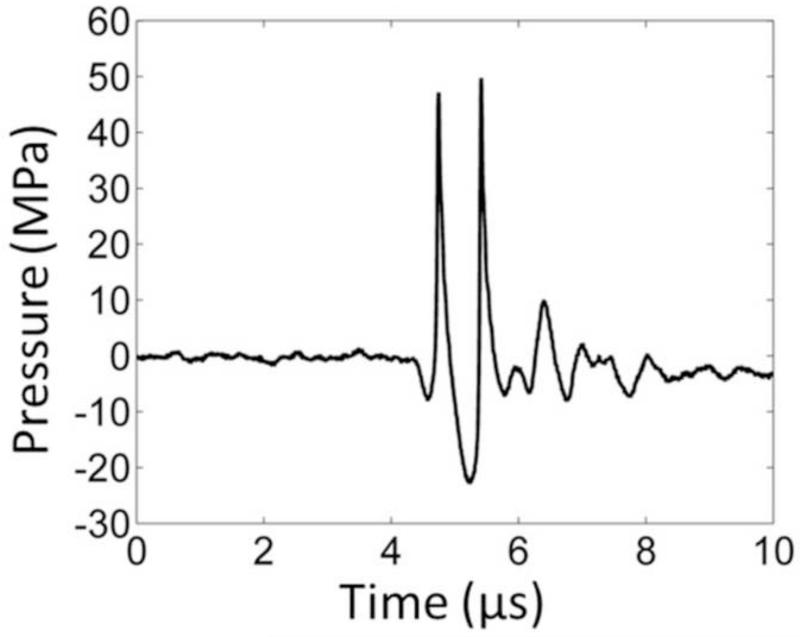
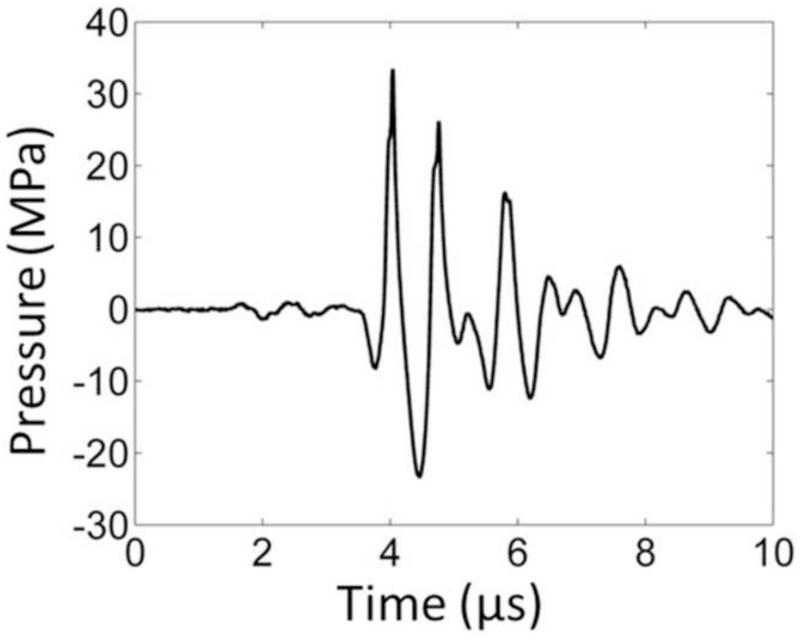
In order to capture the bubble-induced motion following each histotripsy pulse inside the fibrin clot, optical imaging for particle image velocimetry (PIV) and ultrasound imaging for bubble-induced color Doppler (BCD) were applied simultaneously during histotripsy treatment. The experimental setup is illustrated in Figure 2. The optically and acoustically transparent clot was treated by a 1.5-MHz focused ultrasound transducer with an aperture size of 7.1 cm (lateral) × 8 cm (elevational) and a focal length of 5.5 cm. In the center of the transducer housing is a 6 cm × 2.4 cm rectangular hole for the insertion of imaging probes. The transducer was calibrated using a fiber-optic probe hydrophone (FOPH) adapted from a previously published design (Parsons et al. 2006). The focal beam volume (−6 dB) of the transducer was measured to be 4.2 mm (axial) × 1.5 mm (lateral) × 1.9 mm (elevational) at a peak negative pressure of 15 MPa. The histotripsy treatment consisted of 1.5-cycle ultrasound pulses with a pulse repetition frequency (PRF) of 30 Hz, at an estimated peak negative pressure of 36 MPa and a peak positive pressure of 58 MPa at the focus. The focal pressure waveform was measured directly with FOPH up to the peak negative pressure of 25 MPa (Figure 3). At the peak negative pressure beyond 25 MPa, the pressure cannot be directly measured due to instantaneous cavitation and is estimated by summing the measurable pressure outputs from two sub-groups of the elements. The total exposure at each sample spot was 1000 pulses.
Figure 2.
A schematic illustration of the experimental setup. A 6-element 1.5-MHz histotripsy transducer was placed facing down in a water tank filled with degassed water. The transducer was driven by a high-voltage amplifier that was connected to a field-programmable gated-array (FPGA) development board specifically programmed for controlling the firing of the transducer. A 5-MHz ultrasound imaging probe was inserted in the central hole of the histotripsy transducer and connected to Verasonics® ultrasound imaging system to image at the transducer focus. A high-speed camera and a continuous-wave light source were placed on the two sides outside the water tank. The FPGA controller sent triggers to the Verasonics® system and the high-speed camera to synchronize them with therapy pulses. The therapy focus was positioned within the transparent fibrin clot phantom. The central plane of the clot plate, the ultrasound imaging plane and the focal plane of the camera were aligned to overlap with each other.
Figure 3.
A representative pressure waveform of the 6-element 1.5-MHz histotripsy transducer taken at the highest pressure (peak negative) level that could be directly measured by the fiber optical hydrophone.
For PIV analysis, optical images of the treatment focal zone were captured by a high-speed camera (Phantom V210; Vision Research, Wayne, NJ) using a 135 mm macro lens. The transparent clot phantom was illuminated by a continuous wave (CW) light source from the opposite side of the phantom from the camera. Each image (800 × 256 pixels) covered an approximately 7.3 mm × 2.3 mm field of view, allowing the observation of the full treatment zone (4.2 mm × 1.5 mm). The high-speed camera was synchronized to capture images at a frame rate (FR) of 10 kHz immediately after the delivery of a histotripsy pulse. Limited by the memory size of the high-speed camera, 100 optical images were captured after every 4th histotripsy pulse, covering the first 10 ms after the pulse. A period of 10 ms was sufficiently long to capture the most significant motion.
For BCD imaging, a 5-MHz ultrasound imaging probe (ATL L7-4, Philips, Andover, MA) was placed in the central hole of the therapy transducer and aligned with the transducer focus. The color Doppler acquisitions were realized using a Verasonics® imaging system (V-1 Data Acquisition System, Verasonics, Kirkland, WA). The color Doppler field of view was chosen to cover the whole treatment zone. Immediately after the delivery of a histotripsy pulse, the Verasonics® system started to transmit color Doppler pulses and acquire echo signals at a PRF of 10 kHz. A total of 100 Doppler acquisitions were collected per histotripsy pulse, covering the first 10 ms.
To estimate the bubble-induced motion in the treatment zone, the captured optical images were analyzed using PIV via a Matlab-based analysis tool (PIVlab, Version 1.32). Dark fragments of broken fibrin fibers resulting from histotripsy fractionation provided contrast to track the motion. Each velocity map at a certain delay after a histotripsy pulse was estimated using the image captured at that delay time and the subsequent image. The image pair was compared using a three-pass Fast Fourier Transformation (FFT) window deformation algorithm to estimate the motions. The interrogation window sizes were chosen to be 64, 32 and 16 pixels respectively, all with 50% interrogation overlap. Since there were 100 images captured after each histotripsy pulse, 99 velocity maps were generated showing velocity information at delay times ranging from 0 to 9.9 ms after the pulse.
The bubble-induced motions were also estimated using color Doppler data. The acquired color Doppler data sets were processed offline using the functions provided by Verasonics software. Each velocity map at a certain delay after a histotripsy pulse was estimated using the color Doppler data acquired at that delay time and 9 subsequent acquisitions. The ensemble length of 10 was chosen as a compromise between the accuracy and the capability of depicting fast change. By processing every set of 10 consecutive acquisitions in a rolling fashion along 100 acquisitions after each histotripsy pulse, 91 velocity maps were generated showing velocity information at different delay times ranging from 0 to 9.1 ms following the pulse.
The mean axial velocity, which was defined as velocity components on the direction of ultrasound propagation, was calculated over the region of interest on each PIV and BCD velocity map. The averaging was applied only over non-zero values within the region of interest. For each histotripsy pulse, a curve of mean axial velocity as a function of time elapsed after the pulse was formed to characterize net axial motion. A full profile of mean axial velocity throughout each treatment was generated by PIV and BCD respectively, with each vertical line representing a mean velocity curve after each pulse. An averaging effect originally existed during color Doppler processing to generate each BCD velocity map because it was estimated using 10 acquisitions collected over a period of 0.9 ms. In order to fairly compare BCD with PIV, 9-point rolling averaging was applied on the mean velocity curves of PIV to simulate the averaging effect on BCD.
Correlation of BCD Feedback and Histotripsy Thrombolysis
The correlation between the degree of histotripsy thrombolysis and the BCD feedback was investigated using a three-layer fibrin clot, which allowed the direct visualization and quantification of histotripsy fractionation progression. The three-layer fibrin clot constituted of a thin (~500 um) layer of RBC fibrin clot in the center and two thick (~3 mm) layers of transparent fibrin clot on the two sides. As the middle layer embedded with RBC is fractionated, it transitions from opaque to transparent. The degree of fractionation can be quantified as the area of the transparent region within the opaque RBC layer, which is calculated based on the light intensity change in the captured optical images. To evaluate the correlation, the progression of the degree of clot fractionation (lesion progression) in the three-layer clot was compared with two metrics extracted from the corresponding BCD feedback: time of peak rebound velocity (tPRV) and mean velocity of focal zone at a fixed delay (Vf,delay) after each pulse.
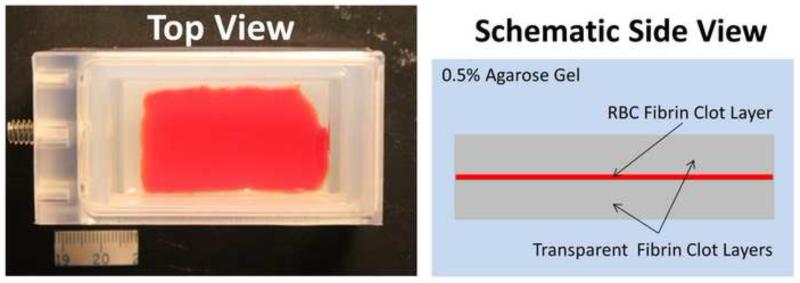
The three-layer fibrin clot (Figure 4) was developed to directly visualize the progression of histotripsy thrombolysis. To form a bottom layer (~3 mm thick) of transparent fibrin clot, the reconstituted plasma described above was poured into a rectangular mold right after stimulation and then coagulated at room temperature for 30 minutes. The solution for RBC fibrin clot was made by combining the previously separated RBC pack and the reconstituted plasma to a hematocrit of 30%. The solution was then stimulated and applied on the surface of the bottom layer using blood smearing technique (Ross et al. 1989) to make an approximate 500 μm thick RBC fibrin clot layer. At last, a top layer (3mm thick) of transparent fibrin clot was made on the coagulated RBC fibrin clot layer. The three-layer clot was then incubated in 37°C water bath for 2 hours. The mature clot was a rectangular plate of approximately 30 mm (wide) × 50 mm (long) × 6.5 mm (thick) and embedded in transparent agarose hydrogel. For all the stimulations, the same concentrations of thrombin (1 IU/mL) and calcium chloride (20 mM/L) were used. Three soft three-layer clot phantoms with a fibrinogen concentration of 400 mg/dL and two hard clot phantoms with doubled fibrinogen concentration were made. All clots were treated within one hour after incubation.
Figure 4.
Three-layer fibrin clot embedded in agarose hydrogel. (a) A picture of a three-layer fibrin clot phantom from top view. (b) A schematic of the phantom from side view.
The same setup as in the previous section was used for this experiment. The plane of the thin RBC clot layer was positioned perpendicular to the optical axis of the high-speed camera and aligned to the camera’s focal plane by visually adjusting the sharpness of the thin RBC layer on the optical images. Since the camera’s focal plane was already aligned rigidly with the histotripsy focus and the ultrasound imaging plane, this procedure aligned the thin RBC clot layer onto the therapy focus. The histotripsy treatment was performed by the same transducer and using the same treating parameters (1.5-cycle, 30 Hz PRF and 36 MPa peak negative pressure). When treating a spot, the high-speed camera captured one image of the treatment zone before each histotripsy pulse arrived to record the lesion as a function of the number of applied therapy pulses. The same color Doppler data were acquired and processed using the same settings as that in the previous section. A total of 30 spots were treated in the soft clots (10 in each of the three soft clot phantoms) and 20 spots were treated in the hard clots (10 in each of the two hard clot phantoms) by histotripsy thrombolysis.
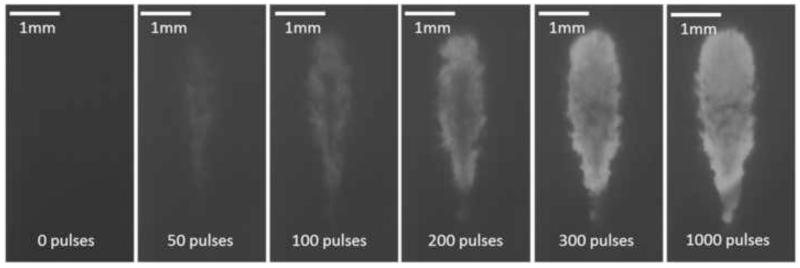
The size of the produced lesions was quantified using the acquired optical images. As the targeted volume was increasingly fractionated by the increasing number of applied histotripsy pulses, the treated region within the RBC layer changed gradually from opaque to translucent on the optical images. Since the clot phantom was back lit with CW light, the captured optical images would appear as shadow graphs in which the untreated region appeared dark and the fractionated region appeared bright (Figure 5). These optical images were analyzed by Matlab (R2012b, The MathWorks Inc., Natick, MA) using a method similar to those described in previous papers (Maxwell et al. 2010; Wang et al. 2012b; Lin et al. 2014). The lesion on each image was detected using a threshold approach. For each spot, a pixel brightness threshold was first chosen and set at 10% above the average pixel brightness of the first image where no damage was done. The grayscale images were converted into binary images using this threshold. The regions with brightness that was higher than the threshold would become 1 (white) in the binary image and be considered fractionated. In contrast, the regions with brightness less than the threshold would become 0 (black) and be considered intact. The lesion area was then plotted as a function of the number of applied therapy pulses to form the lesion progression.
Figure 5.
Representative lesion formation of a treated spot in a soft three-layer fibrin clot. The lesions at different stages (pulse 0, 50, 100, 200, 300 and 1000) are shown here. These images were taken in the axial-lateral plane of the transducer, and the histotripsy pulses propagated from the top to the bottom of the field.
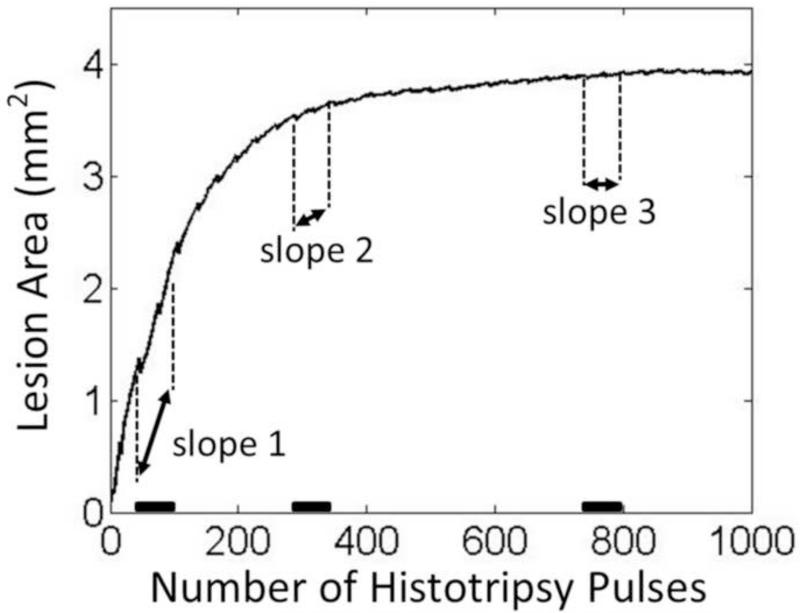
To find the saturation of lesion progression, i.e. the treatment completion, the change rate of the lesion area during each treatment was analyzed by a slope detection algorithm. The slope detection algorithm used a segment-wise approach similar to what was described in a previous study by Turner et al (Turner 2008). The mean change rate (slope) of lesion area over a certain time window (segment) was estimated by fitting a least-square linear model into all lesion area data within this window. The change rate as a function of applied histotripsy pulses during the whole treatment was generated by rolling the time window through the entire treatment period. The algorithm is illustrated in Figure 6. The saturation dose was determined when the change rate was, for the first time, smaller than 10% of the maximal change rate detected at this treating location. To investigate whether the saturation doses of the metrics extracted from BCD feedback indicate the saturation dose of its corresponding lesion progression, the same algorithm was also applied to analyze the progressions of the BCD metrics using the same parameters.
Figure 6.
The illustration of the slope detection algorithm. The lesion progression data shown here is from one treated sample. The slopes over three representative time windows are indicated. The highest change rate appears at the beginning of the treatment around the first time window (slope 1) and the saturation starts to occur around the second time window (slope 2).
Validation of BCD Feedback in In Vitro Clots
The BCD feedback was validated through histotripsy treatment of in vitro clots. The treatment focus was scanned through the length of the clot to create a channel. The volume of clot debris particles generated from histotripsy with different treatment doses was measured to evaluate the degree of clot fractionation. This metric on degree of clot fractionation was then compared with the BCD feedback.
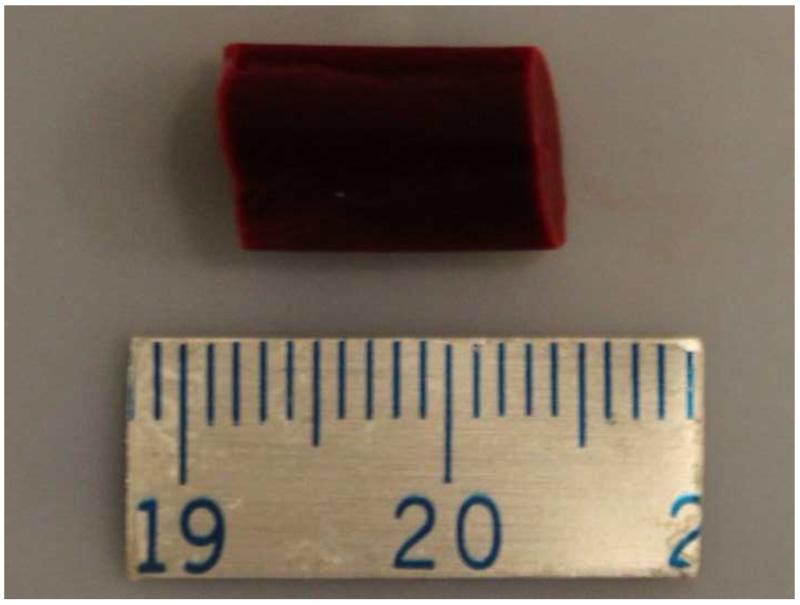
To make in vitro clots (Figure 7), the separated RBC pack and the reconstituted plasma (fibrinogen concentration: 400 mg/dL) described previously were recombined to a hematocrit of 30% (Janis et al. 2002). After stimulating with thrombin (1 IU/mL) and calcium chloride (20 mM/L), the mixture was poured into a tube and incubated in 37°C water bath for 2 hours. Each mature clot had a cylinder shape with a diameter of 6.5 mm and a length of 11 mm.
Figure 7.
RBC fibrin clot. The separation between the two adjacent tick marks on the scale ruler is 1 mm.
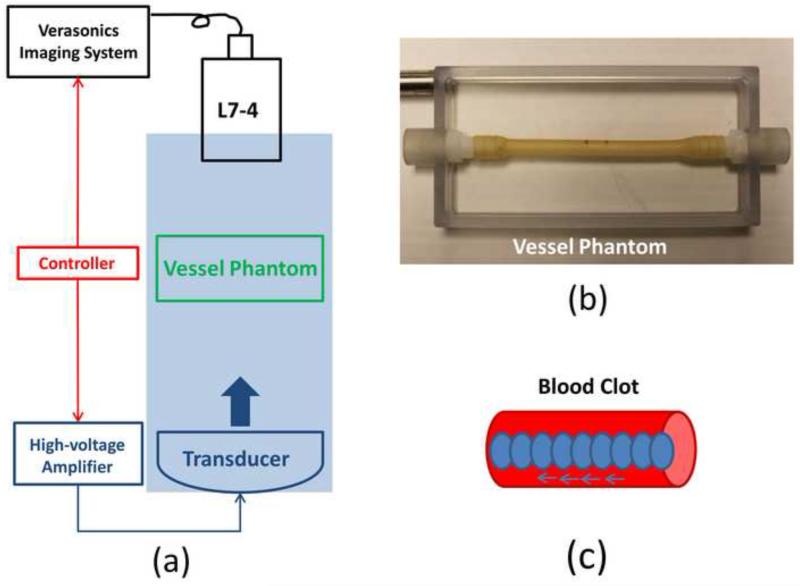
The experimental setup is illustrated in Figure 8. The histotripsy recanalization was performed using an 18-element 1.25-MHz focused transducer with an aperture size of 8 cm (lateral) × 8.3 cm (elevational) aperture size and a focal length of 6 cm. This 1.25-MHz transducer was used instead of the 1.5-MHz transducer because its longer working distance makes it easier to operate with this experimental setup and its larger focal volume fits better with the actual vessel. The same calibration method was used here as for the 1.5-MHz transducer in the previous sections. The focal volume (−6 dB beamwidth) was measured as 6.5 mm (axial) × 2 mm (lateral) × 1.5 mm (elevational) at a peak negative pressure of 15 MPa. The histotripsy treatment consists of 1.5-cycle ultrasound pulses with the same PRF (30Hz) and peak negative pressure (36MPa) as using the 1.5MHz transducer. A pressure waveform directly measured by the fiber optical hydrophone is shown in Figure 9. The same L7-4 ultrasound imaging probe as in the previous sections was placed opposite to the histotripsy transducer and aligned rigidly with the treatment focus. A vessel phantom (6.5 mm inner diameter and 0.5 mm wall thickness) was made of urethane polymer (TAP Urethane RTV, Tap Plastics Inc., San Leandro, CA) to mimic in vivo vessel (Browne et al. 2003) and placed between the transducer and imaging probe, with the treatment focus targeting at the center of the vessel lumen and the ultrasound imaging plane perpendicular to the longitudinal direction of the vessel.
Figure 8.
(a) A schematic illustration of the in vitro experiment setup. An 18-element 1.25-MHz histotripsy transducer was placed facing up in a tank filled with the degassed water. The transducer was driven by a high-voltage amplifier which was connected by an FPGA controller. A 5-MHz ultrasound imaging probe was positioned opposite to the transducer, aligned rigidly to the treatment focus and connected to the Verasonics® ultrasound imaging system. The FPGA controller sent triggers to the Verasonics® system to synchronize them with therapy pulses. Vessel phantom was placed between the transducer and the ultrasound imaging probe. (b) A picture of the vessel phantom. (c) Strategy of recanalization treatment. Each ellipse represents a treatment focal spot and after the completion of each spot treatment, the focus will move to the adjacent location with a 0.7 mm separation.
Figure 9.
A representative pressure waveform of the 1.25-MHz histotripsy transducer taken at the highest pressure (peak negative) level which can be directly measured by the fiber optical hydrophone.
RBC fibrin clot (6.5 mm in diameter and 11 mm in length) was carefully inserted into the vessel phantom. After being filled with 0.9% saline, the vessel phantom was sealed by rubber plugs. To generate a channel within the clot, the treatment focus was aligned to one end of the clot, and a certain dose of histotripsy pulses were applied at the location. The treatment focus was then moved to the adjacent location with a 0.7 mm separation along the clot length, and the same dose of treatment was conducted. This procedure continued until the focus reached the other end of the clot. Six different histotripsy doses (0, 250, 500, 1000, 1500 and 3000 pulses) were used to canalize in vitro clots. Nine clots were treated for each of these histotripsy doses. During the treatment, BCD feedback data were also acquired. An ensemble of 10 color Doppler acquisitions was collected with a PRF of 10 kHz at 0.5 ms delay after each pulse. A delay of 0.5 ms was chosen to capture the first major rebound period of the bubble-induced motion. The mean velocity of focal zone (Vf,0.5ms) was then estimated as a function of the number of applied histotripsy at each treatment location.
After a clot was treated, the fractionated clot debris was measured accordingly. The saline in the vessel phantom together with the treated clot were carefully moved to a medicine cup. The treated clot was then cut into 4 cylinder segments and the cup was gently shaken so that clot debris pieces resulting from the histotripsy fractionation could be released to the saline solution. After the large intact clot segments were carefully removed, the solution was diluted with 0.9% saline up to 20 mL. The debris size and volume of a 0.5 mL sample was then measured using a Coulter Counter (Multisizer 3, Beckman Coulter, CA, USA). For the Coulter Counter measurement, a 30-μm aperture tube was used, which allowed measurement of debris sizes between 0.6-18 μm in diameter. Any debris particles larger than 30 μm will block the tube and would be noted and recorded. For each treatment, three measurements were conducted.
Real-time monitoring of histotripsy thrombolysis using BCD feedback
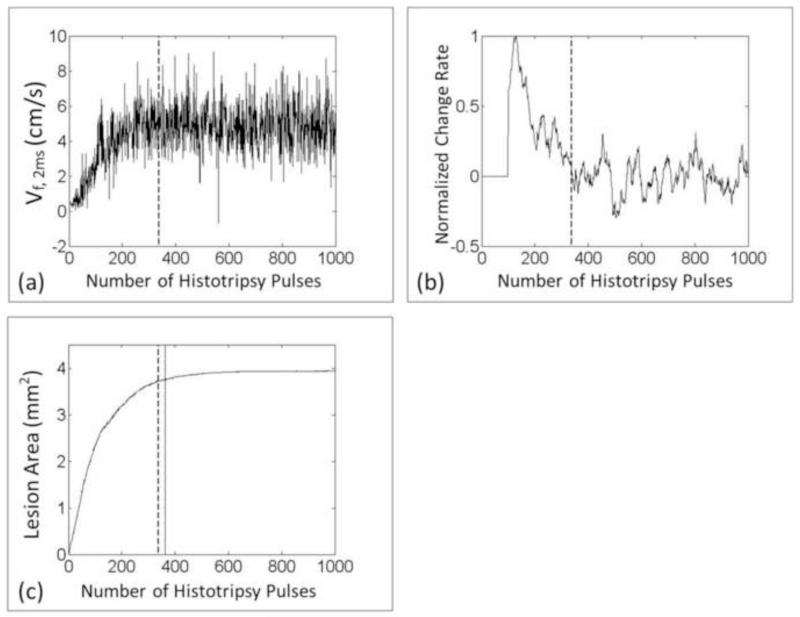
The feasibility of using the BCD feedback for real-time monitoring and detection of treatment completion of histotripsy thrombolysis was investigated. The same setup as for the three-layer fibrin clots was used. A three-layer fibrin clot was made with a fibrinogen concentration of 400 mg/dL. The fibrin clot was treated by the same 1.5-MHz transducer using the same parameters (1.5-cycle, 30 Hz PRF and 36 MPa estimated peak negative pressure). The mean velocity of bubble-induced motion within the focal zone at 2 ms delay (Vf,2ms) was collected in real time, and the slope saturation of the mean velocity was detected using the real-time version of the slope detection algorithm. A delay of 2 ms was chosen to capture the first major rebound period of the bubble-induced motion. The Verasonics® imaging system was synchronized with histotripsy pulses. Starting at 2 ms after each histotripsy pulse, an ensemble of 10 color Doppler acquisitions was captured with a PRF of 10 kHz. Vf, 2ms was estimated from the ensemble real-time and stored as a data point. Every time a new data point was collected, the latest 100 data points were fed into the slope detection function to estimate the current change rate (slope) of Vf,2ms. The saturation was detected when the current change rate was smaller than 10% of the maximal change rate that appeared previously in this spot. The system would process and determine the saturation dose in real-time but the treatment will continue until 1000 pulses in total were applied. To verify that the saturation of Vf,2ms from BCD feedback indicates treatment completion, high-speed images of the middle RBC clot layer were captured during the treatment, and the lesion progression was quantified using the method described in the previous section. The treatment completion was defined by the detected saturation of the lesion progression (in optical images) and compared with the saturation dose detected in real-time by BCD feedback. Ten locations were treated in total with the real-time BCD monitoring. The difference between real-time detected saturation dose by BCD and the treatment completion dose was calculated.
Results
Investigation of Bubble-induced Motion
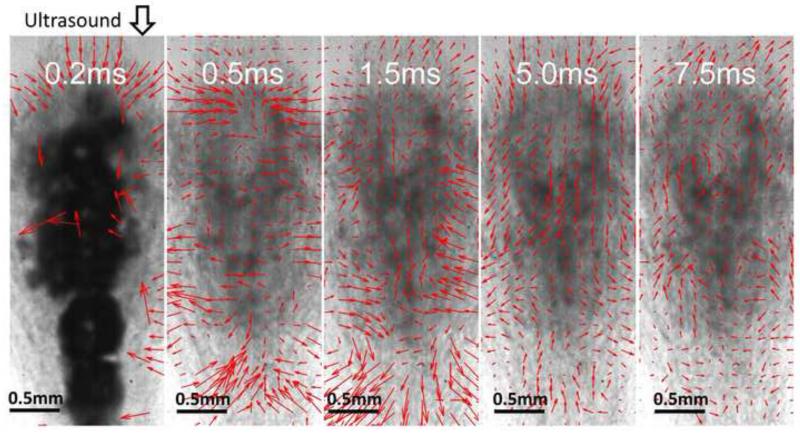
The PIV velocity estimations based on the optical images provided detailed information of bubble-induced motion within the histotripsy focal zone in the transparent fibrin clot. The behaviors of bubble-induced motions observed in all three treated locations were consistent and shared the same trend. Right after the histotripsy pulse, a bubble cloud was created, generating a short period of chaotic motion up to 300 μs. Two streams of coherent motions were formed following the chaos. In three-fourths of the focal zone proximal to the histotripsy transducer, the coherent motion was first pushing away from the therapy transducer and then rebounding back. In the rest one-fourth of the focal area distal to the therapy transducer, the coherent motion was observed to be the opposite, first moving toward the transducer and then rebounding away. The rebound oscillations continued in both the proximal and distal areas with decreasing velocity until energy was completely absorbed. The chaotic motion was very short and irregular compared to the major coherent motion. A representative series of PIV estimations on the corresponding optical images are shown in Figure 10.
Figure 10.
Representative PIV estimations overlaid with the corresponding optical images taken after the 100th histotripsy pulse. These images were taken in the axial-lateral plane of the transducer, and the histotripsy pulses propagated from the top to the bottom of the field. At 0.2 ms after the pulse, the cavitation bubbles show and no coherent motion is detected. At 0.5 ms, coherent motion is forming and pushing away from the transducer in the majority of the focal area proximal to the transducer and another stream of coherent motion at the distal side is moving towards the transducer. At 1.5 ms, the coherent motion at the proximal side is rebounding back and the coherent motion at the distal side is rebounding away. The motions repeat at 5 ms and 7.5 ms as in 0.5 and 1.5 ms.
The behavior of the bubble-induced motion estimated by BCD matched that of the proximal-side motion (in the proximal 3/4 of the focal zone) estimated by PIV in all the three treated samples. After the chaotic motion, the motion detected by BCD was coherently pushing away from the therapy transducer and then rebounding back. The same push/rebound cycle was also apparent. As the ultrasound imaging probe was positioned coaxially with the therapy transducer, ultrasound imaging of BCD and therapy beams propagate in the same direction. BCD only detected the motions at the proximal-side of the focal zone, probably because the distal-end of the focal zone was shielded by the bubbles generated in the proximal-side. When placing the ultrasound imaging probe opposite to the histotripsy transducer, the distal-side motions could be captured.
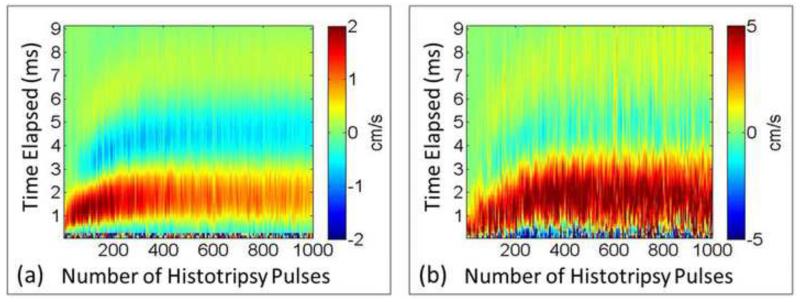
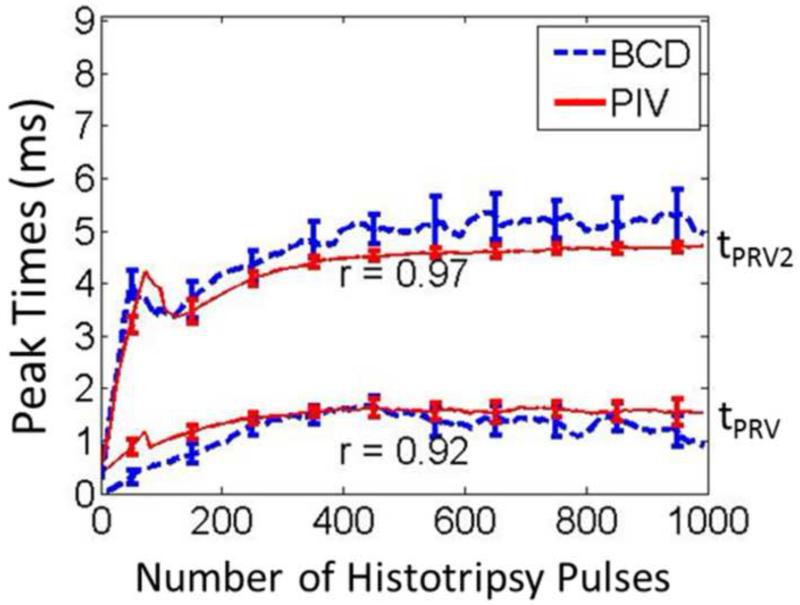
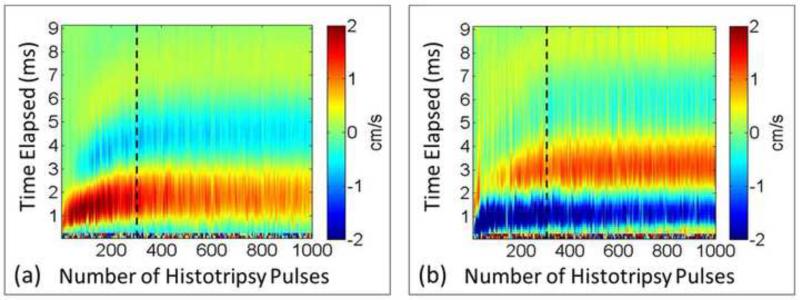
The full profiles of PIV and BCD mean velocity estimations over a representative 1000-pulse treatment are shown in Figure 11. For both PIV and BCD, the mean axial velocities were calculated over only the proximal three-fourths of the focal zone. For both estimations, the temporal profile of the bubble-induced motion expanded with the increasing number of histotripsy pulses as the clot was increasingly fractionated and saturated around 300 histotripsy pulses when the clot was likely liquefied. The raw data from the three treated samples were analyzed to assess the statistical significance of the posited increasing trend. To account for the correlated nature of the data within each of the experiments, we performed linear regression fit using generalized estimating equations, a well-established approach for repeated measures analysis (Zeger and Liang 1986). We modelled the correlation between measurements within each experiment using an auto-regressive structure, which models higher correlation between points that are temporally closer together. The BCD data was best fit by a cubic polynomial of time (BCD=0.81236+1.3356*Time-0.0395*Time2+0.0003*Time3). The linear, quadratic, and cubic terms were statistically significant with respective term p-values of < 2.0*10−16, 1.6*10−14, and 0.0028. Consistently, the PIV data was best fit by a quadratic polynomial of time (PIV=11.3329+0.275*Time-0.004*Time2). The linear and quadratic terms were statistically significant with respective p-values of 0.011 and 0.006. These analysis results (positive linear coefficients and p-values < 0.05) provide strong support that the increasing trend is statically significant. Although the velocity amplitudes estimated from PIV and BCD did not match exactly, the trend of the overall motion had a good agreement. The time period to reach the first peak rebound velocity after each histotripsy pulse increased until it plateaued at ~1.5 ms after approximately 300 pulses. The time period to the peak second rebound velocity also had the same trend. In Figure 12, the times of the peak rebound velocity (tPRV) and peak second rebound velocity (tPRV2) were extracted from the same treatment and compared between PIV and BCD estimations, the similarity of which was quantified using the Pearson linear correlation coefficient. The mean correlation coefficient was 92% over all the three treated locations.
Figure 11.
Representative full profiles of mean axial velocity at the focal zone. (a) PIV estimation (only the proximal side). (b) BCD estimation. Positive values indicate motion towards the therapy transducer and negative values indicate motion away from the transducer. The horizontal axis shows the number of applied pulses and the vertical axis shows the delay from each histotripsy pulse.
Figure 12.
The times of peak rebound velocity (tPRV) and peak second rebound velocity (tPRV2) estimeated by PIV and BCD as a function of the number of the applied hitotripsy pulses from one of the treated locations. The lower curves represent tPRV and the upper curves represent tPRV2.
Correlation of BCD Feedback and Histotripsy Thrombolysis
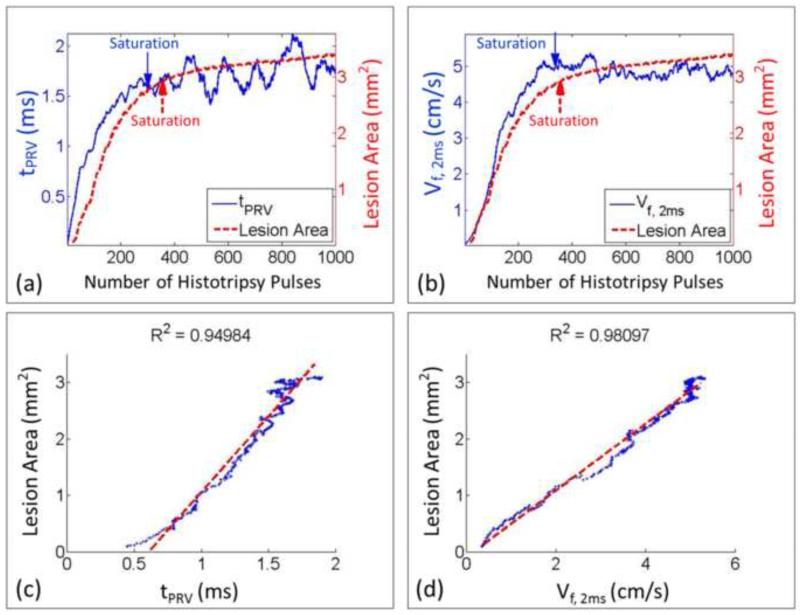
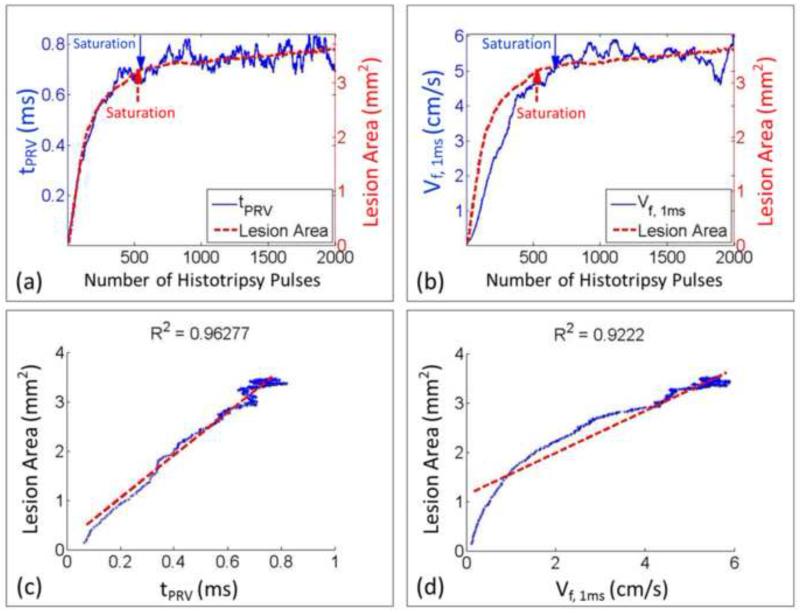
The BCD feedback was correlated with the lesion progression measured by the optical images in the three-layer fibrin clots. For each treated spot, a progression curve of lesion area as a function of the number of the applied histotripsy pulses was generated to indicate the degree of thrombolysis and compared with the progression curves (20 points running-averaging) of the two metrics extracted from BCD feedback. For each spot treated in the soft clots, the lesion area increased almost linearly at the beginning and plateaued at around 300 pulses. The progression of the corresponding two BCD feedback metrics (tPRV and Vf,delay) followed a similar trend. They increased rapidly at the beginning and saturated around the same dose. After the saturation, the two BCD metrics fluctuated around the saturation level. A comparison of the lesion progression and the progressions of two BCD metrics from a soft clot spot was illustrated in Figure 13. For the hard clots, the lesion progression had the same increase-and-saturate pattern as those in the soft clots but saturated later around 600 pulses (Figure 14). The progressions of the two BCD feedback metrics again followed the same trend.
Figure 13.
Comparison between BCD feedback and histotripsy thrombolysis from a representative treated spot in a soft fibrin clot. (a) The progression curve of lesion area is compared with the time of peak rebound velocity (tPRV) from its BCD feedback. (b) The progression curve of lesion area is compared with the mean velocity of the focal zone at 2ms delay (Vf,2ms) from its BCD feedback. (c) The Pearson linear correlation between the progressions of lesion area and tPRV. (d) The Pearson linear correlation between the progressions of lesion area and Vf,2ms. The detected saturation doses were also illustrated.
Figure 14.
Comparison between BCD feedback and histotripsy thrombolysis from a representative treated spot in a hard fibrin clot. (a) The progression curve of lesion area is compared with the time of peak rebound time (tPRV) from its BCD feedback. (b) The progression curve of lesion area is compared with the mean velocity of the focal zone at 1ms delay (Vf,1ms) from its BCD feedback. (c) The Pearson linear correlation between the progressions of lesion area and tPRV. (d) The Pearson linear correlation between the progressions of lesion area and Vf,1ms. The detected saturation doses were also illustrated.
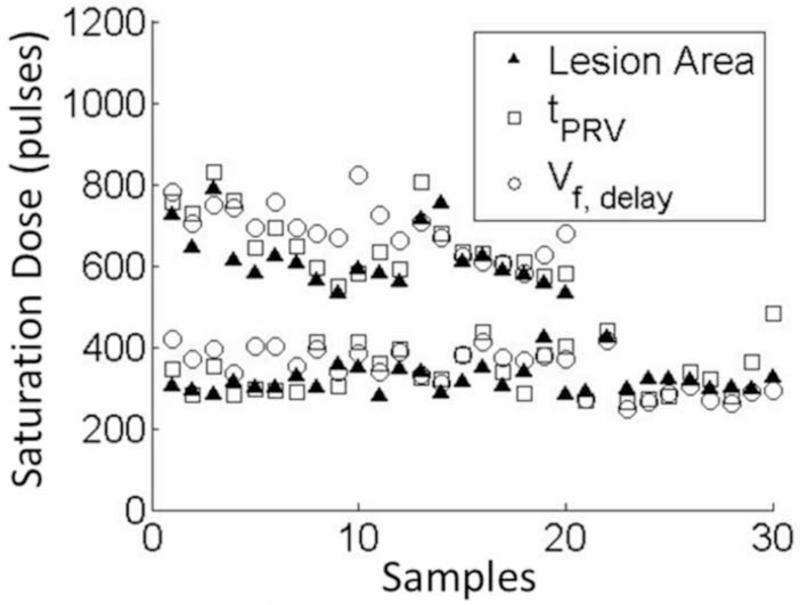
To quantitatively verify the correlation between the lesion progression and the BCD feedback for every treatment spot, their saturation doses were determined using the same slope detection algorithm described in Methods (Figure 15, Table 1). The differences of the saturation dose between the lesion progression and each of the two BCD metrics from each treatment were calculated and listed in Table 2. Using the tPRV and Vf,delay metrics, the saturation doses detected closely followed the complete clot fractionation analyzed from the lesion optical images, both in soft and hard clots. The tPRV metrics presented a slightly better accuracy than the Vf,delay. For example, in the soft clots, the mean difference between the saturation doses of tPRV and clot fractionation was 21 pulses and that of Vf,delay was 25 pulses, while it took 319 pulses (mean) to completely fractionate the clot. In the hard clots, the mean saturation difference between tPRV and clot fractionation was 38 pulses and that of Vf,delay was 71 pulses, while it took 618 pulses (mean) to completely fractionate the clot. In 17 of 50 treatments, the saturations of the BCD feedback were detected earlier (less than 40 pulses) than that of clot fractionation. The Pearson correlation coefficients among the three progression curves were also calculated. For the Pearson correlation coefficient calculation, the segments covering data points up to 100 data points after the saturation of the clot fractionation curve were first selected from the BCD tPRV and Vf,delay. These data were then compared with the clot fractionation data. The mean Pearson correlation coefficient over all the treatments (N = 50) is 93.2% for tPRV and 92.6% for Vf,delay (Table 3).
Figure 15.
The saturation doses of lesion progression, and its corresponding tPRV and Vf,delay. 50 spots were collected in total, 30 of which were in soft fibrin clots and 20 were in hard fibrin clots. The 20 spots from the hard fibrin clots are all on the top of the ones from soft fibrin clots.
Table 1.
The saturation doses (Mean ± SD)
| Progressions | Soft Clots (pulses, N=30) | Hard Clots (pulses, N=20) |
|---|---|---|
| Lesion | 319 ± 35 | 617 ± 72 |
| tPRV | 341 ± 59 | 656 ± 80 |
| Vf,delay | 344 ± 52 | 688 ± 62 |
Table 2.
The differences between the BCD detected saturation doses and the corresponding lesion saturation doses.
| BCD Metrics | Soft Clots (pulses, N=30) |
Hard Clots (pulses, N=20) |
Total (pulses, N = 50) |
|
|---|---|---|---|---|
| tPRV | Mean ± SD | 21 ± 55 | 38 ± 43 | 28 ± 51 |
| Median (25%, 75%) | 21 (−31, 66) | 32 (19, 56) | 31 (−13, 65) | |
| Vf,delay | Mean ± SD | 25 ± 53 | 71 ± 77 | 43.7 ± 67 |
| Median (25%, 75%) | 25 (−19, 67) | 80 (10, 130) | 39 (−14, 101) | |
Table 3.
The Pearson correlation coefficients (Mean ± SD) between the BCD progression curves and their corresponding lesion progression curves
| BCD Progressions | Soft Clots (N= 30) | Hard Clots (N= 30) | Total (N= 50) |
|---|---|---|---|
| tPRV | 93.7 ± 3.2% | 92.4 ± 3.8% | 93.2 ± 3.5% |
| Vf,delay | 91.7 ± 7.9% | 94.0 ± 3.3% | 92.6 ± 6.5% |
Validation of BCD feedback in in vitro clots
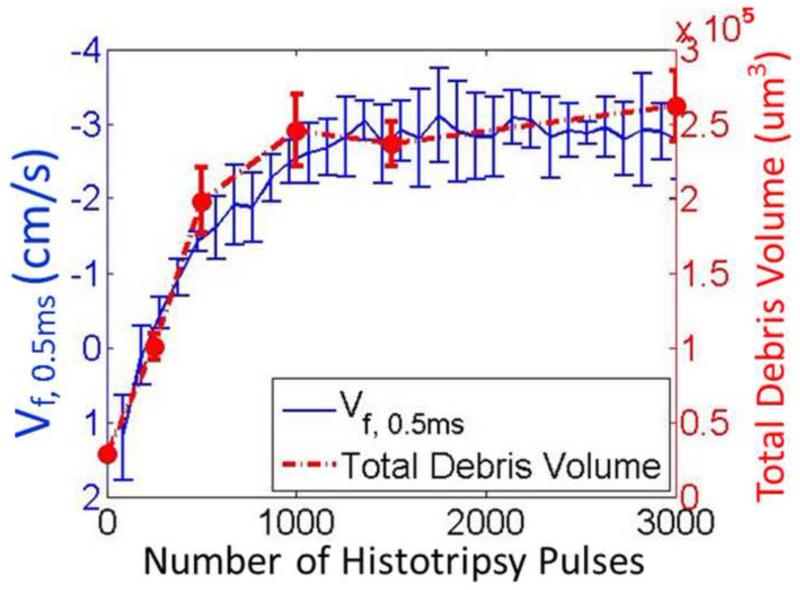
The BCD feedback was validated in in vitro clots by comparing the progressions of Vf,delay with the change of clot debris volume generated by histotripsy treatment. The increasing and saturation trend of the average BCD feedback over all the 3000-pulse treatments matched well with that of the debris volumes measured at different therapy doses. The mean velocity of focal zone at 0.5ms delay (Vf,0.5ms) from the BCD feedback was used and the total debris volume was used to characterize the debris distribution. In Figure 16, the mean of total debris volume over all samples of each dose was plotted versus its corresponding histotripsy pulses used. The mean of total debris volume kept increasing for the first 1000 pulses and remains around the same level afterwards. The mean progression of Vf,0.5ms over all the treated spots in the 3000-pulse treatments was also plotted versus the number of applied pulses in the same figure. The Vf,0.5ms saturated at 1183 pulses (calculated by the slope detection algorithm) after rapidly increasing, which matched well with the clot debris volume measurement.
Figure 16.
Comparison between the change of the fractionated debris volume and Vf,0.5ms from the BCD feedback.
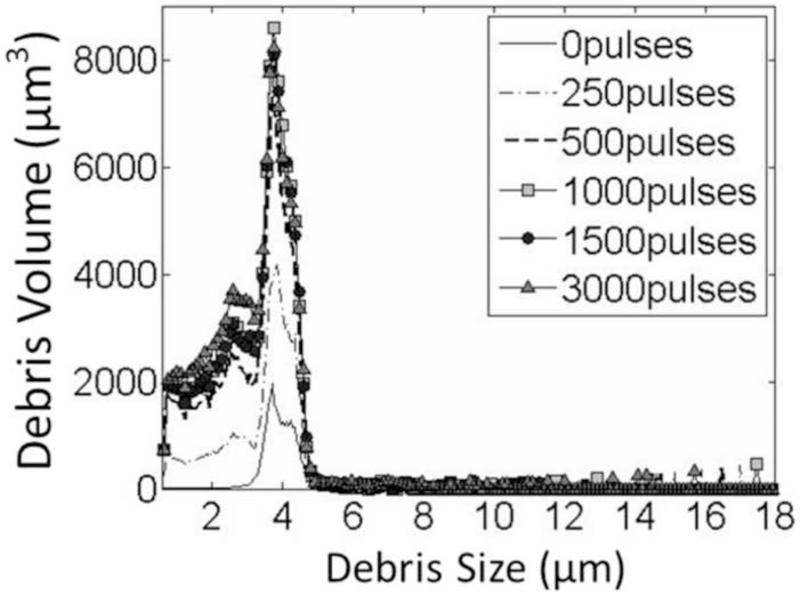
The size of the debris pieces generated by the histotripsy thrombolysis treatment was no greater than 30 μm, as no blockage was observed during all the Coulter Counter measurements. The mean debris distribution over all the measurements of each dose is shown in Figure 17. The debris mainly ranged from 2μm to 6μm and 95% of them were smaller than 10μm.
Figure 17.
The debris distributions after histotripsy treatments with different doses. The 1000-pulse, 1500-pulse and 3000-pulse lines almost overlap with each other. The debris volume of the 500-pulse one (dashed line) is a little lower than the three higher-dose groups. The size of the majority of the fractionated debris is smaller than 6 um in all cases.
Real-time monitoring of histotripsy thrombolysis using BCD feedback
The ability of real-time BCD monitoring was validated in this set of experiment. The saturation dose using BCD feedback Vf,delay was detected in real time and compared with the saturation dose of its corresponding lesion progression quantified using optical imaging in the three-layer clot. The mean saturation dose detected by the BCD Vf,2ms was only 39 pulses (N = 10) more than the saturation dose detected by the lesion progression in the clot phantom, with a standard deviation of 55 pulses. On average it took 326 pulses to completely fractionate the clot. The saturations detected by BCD were later than the saturations of the lesion progressions in 6 out of 10 treatments. In the worst case, the difference between the two saturation doses was 61 pulses. The real-time Vf,2ms and its real-time change rate (slope) data from a spot are shown in Figure 18.
Figure 18.
(a) Real-time Vf,2ms of BCD feedback from one treated spot. (b) The real-time calculated change rate of Vf,2ms. (c) The corresponding progression of the lesion area. The vertical dashed line indicates the saturation dose real-time detected by the BCD feedback and the vertical solid line indicates the true saturation dose of the lesion progression, which represents the treatment completion.
Discussion
By the results of PIV and BCD estimations, the bubble-induced motions followed the same pattern after each histotripsy pulse: push away, rebound and then repeat, no matter how many pulses have been applied. High-speed images show that this motion is only observable when a bubble cloud is generated, hence called bubble-induced motion. The amplitude mismatch between PIV and BCD estimations may be caused by their resolution difference. PIV using optical images had better resolution and sensitivity which can detect smaller velocity than BCD. Since averaging only applied over non-zero values in the region of interest, PIV with more non-zero but small values led to a smaller mean velocity than BCD.
It is most likely the echoes for BCD primarily originated from the residual bubbles left from cavitation, as bubbles are much stronger reflectors compared to RBC and fibrin fragments. In all of our experiments, a 5MHz linear ultrasound probe was used for BCD. With this imaging frequency, whole blood (bovine, swine and canine) and fibrin clot (w/o RBCs) showed very weak speckles on B-mode images. But when monitoring histotripsy treatment on B-mode using the same probe, a region much brighter than blood and clot was observed even long after the arrival of the therapy pulse, which we used for BCD analysis. This hyperechoic region is thought to be dominated by residual cavitation nuclei.
The exact mechanism behind the bubble-induced motion is still under investigation. It could be caused by asymmetric bubble expansion during the formation of the bubble cloud, violent collapse of the bubble cloud and/or acoustic radiation force. The observed motion may be the result of these factors working on the targeted medium (i.e. tissue and blood clot). And as histotripsy pulses change the mechanical property of the medium, the motion behavior (velocity amplitude, push/rebound timing and duration) is changed accordingly. An important property of the bubble-induced motion captured by both PIV and BCD is the two-stages of behavior of the coherent motions during each treatment. The first stage is characterized by a rapid changing of the motion behavior and the second stage is characterized by saturated, stable motion behavior. The BCD feedback tracks this change of the motion behavior, which is correlated to the tissue fractionation.
This two-stage phenomenon during histotripsy fractionation occurs for the motions both at the proximal side and the distal side of the focal zone. Although the motion behaviors at the two sides are different, they share the same changing trend and turn from the rapid changing stage into the stable stage at the same time (Figure 19). The results from the validation of BCD feedback in in vitro clots show that the distal-side motions can be also used to monitor the thrombolysis treatment. The distal-side motion is different from the proximal-side probably due to a counterforce formed by untreated tissue outside the distal end of the focal zone. If a larger volume (multiple treatment zones) of tissue is being fractionated simultaneously and BCD is collected only from the center of the focal zone in the absence of surrounding intact tissue, the motions at the proximal and distal sides of the focal zone will be similar in form (Miller et al. 2013).
Figure 19.
Representative full profiles of mean axial velocity of PIV estimation. (a) Proximal side (three fourths of the whole focal zone). (b) Distal side. Although the motions at the two sides are different, the changing trends appear the same. To the left of the dashed line (around 300 pulses) is the rapid changing stage and to the right of the dashed line is the stable stage.
Histotripsy thrombolysis treatment can be monitored by BCD feedback via increase and saturation of the tPRV or Vf,delay. The treatment completion is indicated by the saturation rather than a specific threshold value of a parameter. Validated using in vitro clots, the saturation of Vf,delay was detected in real-time to indicate treatment completion, and the saturation detection was within 50 pulses of complete clot fractionation. Regardless of different clot stiffnesses, the saturation doses of two BCD metrics are both highly consistent with the completion of clot fractionation. This capability of the BCD feedback to adaptively detect the treatment completion accurately even in clots with different properties is important in clinical situations when clots with different ages exhibit large, varied stiffness and a clot can itself be heterogeneous. The high Pearson correlation coefficient between the clot fractionation progression curve and the corresponding two BCD curves up to the saturation point also supports the feasibility of BCD feedback as a monitor for histotripsy thrombolysis.
The potential explanation for the increased temporal profile and saturation trend of BCD metrics as the clot is increasingly fractionated and eventually liquefied is that the change of bubble-induced motion depends on the change of mechanical properties of the targeted tissue. As the tissue is fractionated by histotripsy, the tissue elasticity is reduced until the tissue is completely liquefied (Maxwell et al. 2009; Wang et al. 2012a; Wang et al. 2014). As a result of the reduced tissue elasticity, the motion induced in the tissue by a given force is expected to exhibit a lower frequency oscillation (i.e. longer tPRV), as shown in a simulation study using finite element method (FEM) (Palmeri et al. 2006). When the clot is completely fractionated, the bubble-induced motion reaches the maximum temporal expansion. Based on this principal, the BCD feedback captures the temporal characteristics of the bubble-induced motions in the two metrics (tPRV and Vf,delay) to quantitatively characterize the degree of histotripsy thrombolysis.
It shows that BCD feedback (Vf,delay) was achieved real-time using a frame rate of 30 Hz, which is sufficient for real-time monitoring of histotripsy thrombolysis. To monitor Vf,delay, standard ultrasound color Doppler imaging is sufficient. The color Doppler pulses need to be synchronized with the histotripsy pulses, along with the appropriate pre-set Doppler parameters. No additional hardware is needed and the computation is simple and straightforward. To have the best signal-to-noise ratio and the closest trend representing the expanding temporal profile of the bubble-induced motion, the delay of Vf,delay with respect to each histotripsy pulse need to be carefully chosen so that the acquisition period can cover the major rebound period of the bubble-induced motion. A delay of 0.5 ms was chosen to capture the major rebound when the imaging probe was placed opposite to the therapy transducer detecting the distal-side motion, whereas a delay of 2 ms was chosen when the imaging probe was detecting the proximal-side motion. In reality, the main rebound period is unknown before treatment and it is a challenge to choose the right delay in the clinical application. Two potential solutions can be used to solve this issue. One is to enlarge the ensemble length of the acquisition from 10 to 20 or 30 frames so that the acquisition period will be wide enough to cover the main rebound period and the rebounding motion features can be reflected through an averaging effect. The other solution is to treat a testing spot in the clot before a full treatment and get the full velocity profile to decide the main rebound period and the appropriate delay. Real-time tracking of tPRV is also possible and has the advantages of lower noise level and better match with the overall trend of the motions compared to Vf,delay. In the future, with a programmable ultrasound imaging system, real-time tracking of tPRV may be also achieved.
Conclusion
The results of this study show that the potential of using BCD feedback to quantitatively monitor clot fractionation during histotripsy thrombolysis and accurately predict the completion of clot fractionation in real-time. The metrics of BCD, tPRV and Vf,delay, are both strongly correlated with the degree of clot fractionation. Particularly, the saturation of the increase in tPRV and Vf,delay coincide with the completion of clot fractionation in both soft and hard clots. This correlation will enable real-time monitoring of histotripsy thrombolysis and detection of treatment completion, which will help improve efficacy and reduce the risks of overtreatment.
ACKNOWLEDGEMENTS
This work is supported by grants from the National Institute of Biomedical Imaging and Bioengineering (NIBIB) of the National Institutes of Health under Award Number R01EB008998, National Science Foundation (S10 RR022425) and Focused Ultrasound Surgery Foundation. Disclosure: Drs. Charles A. Cain and Zhen Xu have financial interest and/or other relationship with HistoSonics Inc.
Footnotes
Publisher's Disclaimer: This is a PDF file of an unedited manuscript that has been accepted for publication. As a service to our customers we are providing this early version of the manuscript. The manuscript will undergo copyediting, typesetting, and review of the resulting proof before it is published in its final citable form. Please note that during the production process errors may be discovered which could affect the content, and all legal disclaimers that apply to the journal pertain.
References
- Adams HP, Jr., Brott TG, Furlan AJ, Gomez CR, Grotta J, Helgason CM, Kwiatkowski T, Lyden PD, Marler JR, Torner J, Feinberg W, Mayberg M, Thies W. Guidelines for thrombolytic therapy for acute stroke: a supplement to the guidelines for the management of patients with acute ischemic stroke. A statement for healthcare professionals from a Special Writing Group of the Stroke Council, American Heart Association. Circulation. 1996;94:1167–74. doi: 10.1161/01.cir.94.5.1167. [DOI] [PubMed] [Google Scholar]
- Alexandrov AV, Molina CA, Grotta JC, Garami Z, Ford SR, Alvarez-Sabin J, Montaner J, Saqqur M, Demchuk AM, Moye LA, Hill MD, Wojner AW. Ultrasound-enhanced systemic thrombolysis for acute ischemic stroke. N Engl J Med. 2004;351:2170–8. doi: 10.1056/NEJMoa041175. [DOI] [PubMed] [Google Scholar]
- Amini AN, Ebbini ES, Georgiou TT. Noninvasive estimation of tissue temperature via high-resolution spectral analysis techniques. IEEE Trans Biomed Eng. 2005;52:221–8. doi: 10.1109/TBME.2004.840189. [DOI] [PubMed] [Google Scholar]
- Arora D, Cooley D, Perry T, Guo J, Richardson A, Moellmer J, Hadley R, Parker D, Skliar M, Roemer RB. MR thermometry-based feedback control of efficacy and safety in minimum-time thermal therapies: phantom and in-vivo evaluations. Int J Hyperthermia. 2006;22:29–42. doi: 10.1080/02656730500412411. [DOI] [PubMed] [Google Scholar]
- Bateman RM, Leong H, Podor T, Hodgson KC, Kareco T, Walley KR. The Effect of Thrombin Concentration on Fibrin Clot Structure Imaged by Multiphoton Microscopy and Quantified by Fractal Analysis Microscopy and Microanalysis. 2005;11:1018–9. [Google Scholar]
- Bates SM, Ginsberg JS. Clinical practice. Treatment of deep-vein thrombosis. N Engl J Med. 2004;351:268–77. doi: 10.1056/NEJMcp031676. [DOI] [PubMed] [Google Scholar]
- Bercoff J, Pernot M, Tanter M, Fink M. Monitoring thermally-induced lesions with supersonic shear imaging. Ultrason Imaging. 2004;26:71–84. doi: 10.1177/016173460402600201. [DOI] [PubMed] [Google Scholar]
- Brown AT, Flores R, Hamilton E, Roberson PK, Borrelli MJ, Culp WC. Microbubbles improve sonothrombolysis in vitro and decrease hemorrhage in vivo in a rabbit stroke model. Invest Radiol. 2011;46:202–7. doi: 10.1097/RLI.0b013e318200757a. [DOI] [PMC free article] [PubMed] [Google Scholar]
- Browne JE, Ramnarine KV, Watson AJ, Hoskins PR. Assessment of the acoustic properties of common tissue-mimicking test phantoms. Ultrasound Med Biol. 2003;29:1053–60. doi: 10.1016/s0301-5629(03)00053-x. [DOI] [PubMed] [Google Scholar]
- Burgess A, Huang Y, Waspe AC, Ganguly M, Goertz DE, Hynynen K. High-intensity focused ultrasound (HIFU) for dissolution of clots in a rabbit model of embolic stroke. PLoS One. 2012;7:e42311. doi: 10.1371/journal.pone.0042311. [DOI] [PMC free article] [PubMed] [Google Scholar]
- Bush NL, Rivens I, ter Haar GR, Bamber JC. Acoustic properties of lesions generated with an ultrasound therapy system. Ultrasound Med Biol. 1993;19:789–801. doi: 10.1016/0301-5629(93)90095-6. [DOI] [PubMed] [Google Scholar]
- Culp WC, Flores R, Brown AT, Lowery JD, Roberson PK, Hennings LJ, Woods SD, Hatton JH, Culp BC, Skinner RD, Borrelli MJ. Successful microbubble sonothrombolysis without tissue-type plasminogen activator in a rabbit model of acute ischemic stroke. Stroke. 2011;42:2280–5. doi: 10.1161/STROKEAHA.110.607150. [DOI] [PMC free article] [PubMed] [Google Scholar]
- Damianou CA, Sanghvi NT, Fry FJ, Maass-Moreno R. Dependence of ultrasonic attenuation and absorption in dog soft tissues on temperature and thermal dose. J Acoust Soc Am. 1997;102:628–34. doi: 10.1121/1.419737. [DOI] [PubMed] [Google Scholar]
- Datta S, Coussios CC, Ammi AY, Mast TD, de Courten-Myers GM, Holland CK. Ultrasound-enhanced thrombolysis using Definity as a cavitation nucleation agent. Ultrasound Med Biol. 2008;34:1421–33. doi: 10.1016/j.ultrasmedbio.2008.01.016. [DOI] [PMC free article] [PubMed] [Google Scholar]
- Datta S, Coussios CC, McAdory LE, Tan J, Porter T, De Courten-Myers G, Holland CK. Correlation of cavitation with ultrasound enhancement of thrombolysis. Ultrasound Med Biol. 2006;32:1257–67. doi: 10.1016/j.ultrasmedbio.2006.04.008. [DOI] [PMC free article] [PubMed] [Google Scholar]
- Everbach EC, Makin IR, Azadniv M, Meltzer RS. Correlation of ultrasound-induced hemolysis with cavitation detector output in vitro. Ultrasound Med Biol. 1997;23:619–24. doi: 10.1016/s0301-5629(97)00039-2. [DOI] [PubMed] [Google Scholar]
- Hitchcock KE, Ivancevich NM, Haworth KJ, Caudell Stamper DN, Vela DC, Sutton JT, Pyne-Geithman GJ, Holland CK. Ultrasound-enhanced rt-PA thrombolysis in an ex vivo porcine carotid artery model. Ultrasound Med Biol. 2011;37:1240–51. doi: 10.1016/j.ultrasmedbio.2011.05.011. [DOI] [PMC free article] [PubMed] [Google Scholar]
- Holland CK, Vaidya SS, Datta S, Coussios CC, Shaw GJ. Ultrasound-enhanced tissue plasminogen activator thrombolysis in an in vitro porcine clot model. Thromb Res. 2008;121:663–73. doi: 10.1016/j.thromres.2007.07.006. [DOI] [PMC free article] [PubMed] [Google Scholar]
- Hynynen K. MRI-guided focused ultrasound treatments. Ultrasonics. 2010;50:221–9. doi: 10.1016/j.ultras.2009.08.015. [DOI] [PubMed] [Google Scholar]
- Janis AD, Buckley LA, Nyara AN, Prahl SA, Gregory K. A reconstituted in vitro clot model for evaluating laser thrombolysis. J Thromb Thrombolysis. 2002;13:167–75. doi: 10.1023/a:1020431007864. [DOI] [PubMed] [Google Scholar]
- Jolesz FA. MRI-guided focused ultrasound surgery. Annu Rev Med. 2009;60:417–30. doi: 10.1146/annurev.med.60.041707.170303. [DOI] [PMC free article] [PubMed] [Google Scholar]
- Kasirajan K, Gray B, Ouriel K. Percutaneous AngioJet thrombectomy in the management of extensive deep venous thrombosis. J Vasc Interv Radiol. 2001;12:179–85. doi: 10.1016/s1051-0443(07)61823-5. [DOI] [PubMed] [Google Scholar]
- Kim HS, Patra A, Paxton BE, Khan J, Streiff MB. Catheter-directed thrombolysis with percutaneous rheolytic thrombectomy versus thrombolysis alone in upper and lower extremity deep vein thrombosis. Cardiovasc Intervent Radiol. 2006;29:1003–7. doi: 10.1007/s00270-005-0341-4. [DOI] [PubMed] [Google Scholar]
- Kyrle PA, Eichinger S. Deep vein thrombosis. Lancet. 2005;365:1163–74. doi: 10.1016/S0140-6736(05)71880-8. [DOI] [PubMed] [Google Scholar]
- Larsson J, Carlson J, Olsson SB. Ultrasound enhanced thrombolysis in experimental retinal vein occlusion in the rabbit. Br J Ophthalmol. 1998;82:1438–40. doi: 10.1136/bjo.82.12.1438. [DOI] [PMC free article] [PubMed] [Google Scholar]
- Lin KW, Kim Y, Maxwell AD, Wang TY, Hall TL, Xu Z, Fowlkes JB, Cain CA. Histotripsy beyond the intrinsic cavitation threshold using very short ultrasound pulses: microtripsy. IEEE Trans Ultrason Ferroelectr Freq Control. 2014;61:251–65. doi: 10.1109/TUFFC.2014.6722611. [DOI] [PMC free article] [PubMed] [Google Scholar]
- Luo H, Nishioka T, Berglund H, Kim CJ, Carbone M, Cercek B, Siegel RJ. Effect of External Ultrasound Frequency on Thrombus Disruption In Vitro. J Thromb Thrombolysis. 1996;3:63–6. doi: 10.1007/BF00226413. [DOI] [PubMed] [Google Scholar]
- Maxwell AD, Cain CA, Duryea AP, Yuan L, Gurm HS, Xu Z. Noninvasive thrombolysis using pulsed ultrasound cavitation therapy - histotripsy. Ultrasound Med Biol. 2009;35:1982–94. doi: 10.1016/j.ultrasmedbio.2009.07.001. [DOI] [PMC free article] [PubMed] [Google Scholar]
- Maxwell AD, Owens G, Gurm HS, Ives K, Myers DD, Jr., Xu Z. Noninvasive treatment of deep venous thrombosis using pulsed ultrasound cavitation therapy (histotripsy) in a porcine model. J Vasc Interv Radiol. 2011;22:369–77. doi: 10.1016/j.jvir.2010.10.007. [DOI] [PMC free article] [PubMed] [Google Scholar]
- Maxwell AD, Wang TY, Yuan L, Duryea AP, Xu Z, Cain CA. A tissue phantom for visualization and measurement of ultrasound-induced cavitation damage. Ultrasound Med Biol. 2010;36:2132–43. doi: 10.1016/j.ultrasmedbio.2010.08.023. [DOI] [PMC free article] [PubMed] [Google Scholar]
- Mewissen MW, Seabrook GR, Meissner MH, Cynamon J, Labropoulos N, Haughton SH. Catheter-directed thrombolysis for lower extremity deep venous thrombosis: report of a national multicenter registry. Radiology. 1999;211:39–49. doi: 10.1148/radiology.211.1.r99ap4739. [DOI] [PubMed] [Google Scholar]
- Miller NR, Bamber JC, ter Haar GR. Imaging of temperature-induced echo strain: preliminary in vitro study to assess feasibility for guiding focused ultrasound surgery. Ultrasound Med Biol. 2004;30:345–56. doi: 10.1016/j.ultrasmedbio.2003.11.016. [DOI] [PubMed] [Google Scholar]
- Miller RM, Zhang X, Maxwell AD, Wang T-Y, Fowlkes JB, Cain CA, Xu Z. Investigation of the mechanism of ARFI-based Color Doppler feedback of histotripsy tissue fractionation; Ultrasonics Symposium (IUS), 2013 IEEE International; Prague. 2013.pp. 934–37. [Google Scholar]
- Palmeri ML, McAleavey SA, Fong KL, Trahey GE, Nightingale KR. Dynamic mechanical response of elastic spherical inclusions to impulsive acoustic radiation force excitation. IEEE Trans Ultrason Ferroelectr Freq Control. 2006;53:2065–79. doi: 10.1109/tuffc.2006.146. [DOI] [PMC free article] [PubMed] [Google Scholar]
- Parsons JE, Cain CA, Fowlkes JB. Cost-effective assembly of a basic fiber-optic hydrophone for measurement of high-amplitude therapeutic ultrasound fields. J Acoust Soc Am. 2006;119:1432–40. doi: 10.1121/1.2166708. [DOI] [PubMed] [Google Scholar]
- Pfaffenberger S, Devcic-Kuhar B, El-Rabadi K, Groschl M, Speidl WS, Weiss TW, Huber K, Benes E, Maurer G, Wojta J, Gottsauner-Wolf M. 2MHz ultrasound enhances t-PA-mediated thrombolysis: comparison of continuous versus pulsed ultrasound and standing versus travelling acoustic waves. Thromb Haemost. 2003;89:583–9. [PubMed] [Google Scholar]
- Poliachik SL, Chandler WL, Mourad PD, Bailey MR, Bloch S, Cleveland RO, Kaczkowski P, Keilman G, Porter T, Crum LA. Effect of high-intensity focused ultrasound on whole blood with and without microbubble contrast agent. Ultrasound Med Biol. 1999;25:991–8. doi: 10.1016/s0301-5629(99)00043-5. [DOI] [PubMed] [Google Scholar]
- Poliachik SL, Chandler WL, Mourad PD, Ollos RJ, Crum LA. Activation, aggregation and adhesion of platelets exposed to high-intensity focused ultrasound. Ultrasound Med Biol. 2001;27:1567–76. doi: 10.1016/s0301-5629(01)00444-6. [DOI] [PubMed] [Google Scholar]
- Poliachik SL, Chandler WL, Ollos RJ, Bailey MR, Crum LA. The relation between cavitation and platelet aggregation during exposure to high-intensity focused ultrasound. Ultrasound Med Biol. 2004;30:261–9. doi: 10.1016/j.ultrasmedbio.2003.10.012. [DOI] [PubMed] [Google Scholar]
- Ross MH, Reith EJ, Romrell LJ. Histology: a text and atlas. Williams & Wilkins; Baltimore: 1989. [Google Scholar]
- Ryan EA, Mockros LF, Weisel JW, Lorand L. Structural origins of fibrin clot rheology. Biophys J. 1999;77:2813–26. doi: 10.1016/S0006-3495(99)77113-4. [DOI] [PMC free article] [PubMed] [Google Scholar]
- Souchon R, Rouviere O, Gelet A, Detti V, Srinivasan S, Ophir J, Chapelon JY. Visualisation of HIFU lesions using elastography of the human prostate in vivo: preliminary results. Ultrasound Med Biol. 2003;29:1007–15. doi: 10.1016/s0301-5629(03)00065-6. [DOI] [PubMed] [Google Scholar]
- Tsivgoulis G, Culp WC, Alexandrov AV. Ultrasound enhanced thrombolysis in acute arterial ischemia. Ultrasonics. 2008;48:303–11. doi: 10.1016/j.ultras.2007.11.008. [DOI] [PubMed] [Google Scholar]
- Tsivgoulis G, Eggers J, Ribo M, Perren F, Saqqur M, Rubiera M, Sergentanis TN, Vadikolias K, Larrue V, Molina CA, Alexandrov AV. Safety and efficacy of ultrasound-enhanced thrombolysis: a comprehensive review and meta-analysis of randomized and nonrandomized studies. Stroke. 2010;41:280–7. doi: 10.1161/STROKEAHA.109.563304. [DOI] [PubMed] [Google Scholar]
- Turner CS. Slope Filtering: An FIR Approach to Linear Regression. Ieee Signal Proc Mag. 2008;25:159–+. [Google Scholar]
- Vanne A, Hynynen K. MRI feedback temperature control for focused ultrasound surgery. Phys Med Biol. 2003;48:31–43. doi: 10.1088/0031-9155/48/1/303. [DOI] [PubMed] [Google Scholar]
- Verhaeghe R, Stockx L, Lacroix H, Vermylen J, Baert AL. Catheter-directed lysis of iliofemoral vein thrombosis with use of rt-PA. Eur Radiol. 1997;7:996–1001. doi: 10.1007/s003300050239. [DOI] [PubMed] [Google Scholar]
- Wang TY, Hall TL, Xu Z, Fowlkes JB, Cain CA. Imaging feedback of histotripsy treatments using ultrasound shear wave elastography. IEEE Trans Ultrason Ferroelectr Freq Control. 2012a;59:1167–81. doi: 10.1109/tuffc.2012.2307. [DOI] [PMC free article] [PubMed] [Google Scholar]
- Wang TY, Hall TL, Xu Z, Fowlkes JB, Cain CA. Imaging feedback for histotripsy by characterizing dynamics of acoustic radiation force impulse (ARFI)-induced shear waves excited in a treated volume. IEEE Trans Ultrason Ferroelectr Freq Control. 2014;61:1137–51. doi: 10.1109/TUFFC.2014.3013. [DOI] [PubMed] [Google Scholar]
- Wang TY, Xu Z, Hall TL, Fowlkes JB, Cain CA. An efficient treatment strategy for histotripsy by removing cavitation memory. Ultrasound Med Biol. 2012b;38:753–66. doi: 10.1016/j.ultrasmedbio.2012.01.013. [DOI] [PMC free article] [PubMed] [Google Scholar]
- Wright C, Hynynen K, Goertz D. In vitro and in vivo high-intensity focused ultrasound thrombolysis. Invest Radiol. 2012;47:217–25. doi: 10.1097/RLI.0b013e31823cc75c. [DOI] [PMC free article] [PubMed] [Google Scholar]
- Xu Z, Fowlkes JB, Cain CA. A new strategy to enhance cavitational tissue erosion using a high-intensity, Initiating sequence. IEEE Trans Ultrason Ferroelectr Freq Control. 2006;53:1412–24. doi: 10.1109/tuffc.2006.1665098. [DOI] [PMC free article] [PubMed] [Google Scholar]
- Xu Z, Fowlkes JB, Rothman ED, Levin AM, Cain CA. Controlled ultrasound tissue erosion: the role of dynamic interaction between insonation and microbubble activity. J Acoust Soc Am. 2005;117:424–35. doi: 10.1121/1.1828551. [DOI] [PMC free article] [PubMed] [Google Scholar]
- Xu Z, Hall TL, Fowlkes JB, Cain CA. Effects of acoustic parameters on bubble cloud dynamics in ultrasound tissue erosion (histotripsy) J Acoust Soc Am. 2007;122:229–36. doi: 10.1121/1.2735110. [DOI] [PMC free article] [PubMed] [Google Scholar]
- Xu Z, Ludomirsky A, Eun LY, Hall TL, Tran BC, Fowlkes JB, Cain CA. Controlled ultrasound tissue erosion. IEEE Trans Ultrason Ferroelectr Freq Control. 2004;51:726–36. doi: 10.1109/tuffc.2004.1308731. [DOI] [PMC free article] [PubMed] [Google Scholar]
- Xu Z, Raghavan M, Hall TL, Mycek MA, Fowlkes JB. Evolution of bubble clouds induced by pulsed cavitational ultrasound therapy - histotripsy. IEEE Trans Ultrason Ferroelectr Freq Control. 2008;55:1122–32. doi: 10.1109/TUFFC.2008.764. [DOI] [PubMed] [Google Scholar]
- Zeger SL, Liang K-Y. Longitudinal data analysis for discrete and continuous outcomes. Biometrics. 1986:121–30. [PubMed] [Google Scholar]


