Abstract
Ghrelin is a circulating hormone that targets the central nervous system to regulate feeding and adiposity. The best-characterized neural system that mediates the effects of ghrelin on energy balance involves the activation of neuropeptide Y/agouti-related peptide neurons, expressed exclusively in the arcuate nucleus of the hypothalamus. However, ghrelin receptors are expressed in other neuronal populations involved in the control of energy balance. We combined laser capture microdissection of several nuclei of the central nervous system expressing the ghrelin receptor (GH secretagoge receptor) with microarray gene expression analysis to identify additional neuronal systems involved in the control of central nervous system-ghrelin action. We identified tachykinin-1 (Tac1) as a gene negatively regulated by ghrelin in the hypothalamus. Furthermore, we identified neuropeptide k as the TAC1-derived peptide with more prominent activity, inducing negative energy balance when delivered directly into the brain. Conversely, loss of Tac1 expression enhances the effectiveness of ghrelin promoting fat mass gain both in male and in female mice and increases the susceptibility to diet-induced obesity in ovariectomized mice. Taken together, our data demonstrate a role TAC1 in the control energy balance by regulating the levels of adiposity in response to ghrelin administration and to changes in the status of the gonadal function.
Ghrelin remains as the only peripheral hormone that regulates energy balance by increasing food intake and fat mass gain (1). Multiple studies have demonstrated that this positive effect on energy homeostasis is the result of a complex system that involves the interaction of ghrelin with its receptor, the GH secretagoge receptor (GHSR), in multiple sites throughout the central nervous system (2–4). Ghrelin action is influenced by other factors that play a role in the control of energy balance. For example, exposure to a high-fat diet (HFD) eliminates the orexigenic (5) but not the “lipoanabolic” effect of ghrelin (6). Another critical modulator of the orexigenic effect of ghrelin is associated with the level of estrogen signaling, characteristic of sexual dimorphism (7, 8). Despite this evidence, the mechanisms that condition ghrelin action remain unknown. We aimed to discover novel neural mechanisms involved in the control of energy balance by ghrelin by analyzing the changes in genome-wide expression of nuclei expressing GHSR (9–12) collected by laser capture microdissection (LCMD) after intracerebroventricular (icv) administration of ghrelin in rats. We identified tachykinin-1 (Tac1) as a novel ghrelin-regulated target in the hypothalamus and demonstrate a novel role of Tac1 in the control of energy balance integrating hormonal signals involved in the control of metabolic and reproductive status.
Materials and Methods
In vivo experiments
All procedures were approved by the Institutional Animal Care and Use Committee at the University of Cincinnati. All experimental procedures were carried out in accordance with the United States National Institutes of Health guidelines for the care and use of laboratory animals. The animals were housed were housed on a 12-hour light, 12-hour dark cycle at 22°C and had free access to food and tap water at all times unless otherwise specified.
Animals
Male Wistar (260–290 g) rats were obtained from Harlan. C57Bl6 mice and mice exhibiting global disruption of the expression of the Tac1 gene (Tac1 deficient [KO] mice, stock number 004103) were purchased from The Jackson Laboratory. KO mice were bred in house with C57Bl6 mice to obtain heterozygous breeders. The experiments were conducted in male and female KO mice and wild-type (WT) littermates. For the quantification of Agrp and Tac1 expression in arcuate (ARC) nucleus in fed and 24 hour-fasted C57Bl6 mice, only females on estrous/metestrous phase were included to minimize the impact of the estrous cycle in the expression of Agrp (13).
Diets
Mice and rats were fed either with low-fat chow diet (CD) (3.5 kcal/g; Teklad, Harlan) or HFD (D03082706, 38% of kcal from fat; or D12331, 58.0% of kcal from fat; Research Diets) as indicated.
Acute injection in the third cerebral ventricle (iv3rd) in rats
Male Wistar rats (260–290 g) were implanted with a 22-gauge stainless steel cannula (Plastics One), into the third ventricle as previously described (14), following the coordinates: −2.2 mm posterior to bregma and to a depth of −7.5 mm from the surface of the brain, with bregma and λ being horizontal. The correct placement of the cannula was verified by icv administration of angiotensin II (1 μg/μL of 0.9% saline). Rats that failed to drink a minimum of 5 mL of water within 30 minutes were removed from the studies.
Chronic infusion in the lateral ventricle (icv) of rats
Chow-fed male Wistar (260–290 g) rats were implanted with a stainless-steel cannula in the lateral ventricle; the cannula was connected through a polyvinyl tube to an osmotic minipump (1002; Alzet Durect) sc placed in the interscapular space, infusing icv vehicle (saline) or ghrelin or at a rate of 2.5 nmol/d. This dose has proven to be effective increasing fat mass in rats (6). After the surgery, half the rats received HFD (D03082706) during the 7-day infusion period, at the end of which were euthanized and the brains extracted and immediately frozen.
Chronic icv infusion in mice
Male C57BL/6 mice (12–16 wk old) were anesthetized with isoflurane before implantation of a stainless steel cannula (Brain infusion kit; Alzet Durect) in the lateral cerebral ventricle connected through a polyvinyl tube to an osmotic minipump (model 1007D for mice; Alzet Durect) filled either with vehicle (sterile 0.9% NaCl solution) or neuropeptide K (NPK) and placed sc in the interscapular space as previously described (14). The infusion period was 7 days.
Ovariectomy
C57Bl6 (12–14 wk old) mice were anesthetized with isoflurane. We performed a bilateral skin incision made from the first to the third lumbar vertebra in the abdominal cavity. The ovaries were carefully isolated, ligated at the level of the fallopian tubes and removed. The sham surgery included all but the last step. We sutured the muscle layers and the skin and gave the mice postoperative analgesics.
Intraperitoneal glucose tolerance test (ipGTT)
ipGTTs were performed in mice by injection of glucose (2 g/kg, 20% wt/vol D-glucose [Sigma], in 0.9% wt/vol saline) after a 6-hour fast. Tail vein blood samples for blood glucose (BG) measurements were collected at 0, 15, 30, 60, and 120 minutes after the injection and were measured using a handheld glucometer (Freestyle Lite, Abbot).
Indirect calorimetry
Measurements of locomotor activity, energy expenditure (EE), and respiratory exchange ratio were performed in an indirect calorimetry system (TSE Systems) as previously described (15).
Measurement of body composition
Whole-body composition (fat and fat-free mass) was measured using nuclear magnetic resonance technology (EchoMRI).
Gene expression analysis
Microarray analysis of LCMD nuclei
Fourteen-micrometer rat coronal brain sections were collected from bregma −2.12 to −3.80 mm for the removal of ARC, −2.30 to −3.60 mm for the VMN, and −4.80 to −6.04 mm for the VTA. LCMD of nuclei was performed as previously reported (16) using a PALM Microbeam (Zeiss). Total RNA from the samples was amplified using the Nugen Ovation Pico WTA system according to the manufacture's protocol, labeled with the Nugen Exon and Encore Biotin Modules, and hybridized onto Affymetrix Rat Gene ST 1.0 arrays. Raw microarray image data was converted to CEL files using Affymetrix GeneChip Operating Software. All the downstream analysis of the microarray data was performed using GeneSpring GX 12.1 (Agilent). The CEL files were used for both the robust multiarray average and Probe Logarithmic Intensity Error analyses. After importing the data, each chip was normalized to the 50th centile of the measurements taken from that chip, and all gene expression data are reported as fold change compared with the control “saline” group.
Quantitative PCR
RNA from mediobasal hypothalamus and from ARC was extracted using commercially available kits (RNeasy from QIAGEN; and RNAqueous-Micro kit from Life Technologies, respectively) following the manufacturer's instructions. After deoxyribonuclease (DNase I) treatment (Invitrogen), cDNA was synthesized using SuperScript-III (Invitrogen), and Tac1 and Agrp and Rpl32 (housekeeping) gene expression was determined by quantitative PCR using gene-specific TaqMan assays (Life Technologies). Gene expression was evaluated using the comparative CT method.
Drugs
Rat ghrelin was purchased from PolyPeptide. Angiotensin II, substance P (SP), and neurokinin A (NKA) were purchased from Sigma-Aldrich. NPK(1–36), a C-terminal truncated NPK(1–26) peptide, and neuropeptide γ (NPG) were purchased from American Peptide.
Statistical analysis
The differences among treatments were assessed by Student's t test, one-way ANOVA followed by Tukey's post hoc test or two-way ANOVA followed by Bonferroni or Tukey's post hoc test, as indicated, using GraphPad Prism, version 6.0 (GraphPad Software). EE was analyzed by analysis of covariance (17) considering BW as covariate using Statistica, version 12 (StatSoft). All results are given as mean ± SEM. Results were considered statistically significant when P < .05.
Results
Effect of icv ghrelin on hypothalamic Tac1 gene expression in male rats
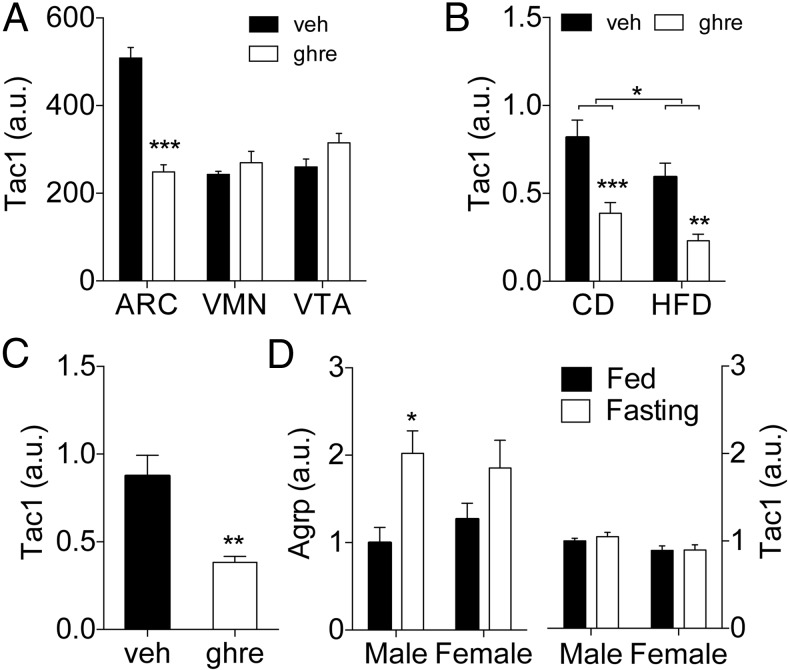
We used a microarray approach to analyze the transcriptome of ARC, VMN, and VTA sections collected by LCMD from rat brains treated icv with ghrelin (2.5 nmol/d, 7 d). Tac1 expression was significantly reduced in the ARC of ghrelin-treated rats (Figure 1A). In contrast, its expression was unaffected in the VMN or VTA (Figure 1A). We confirmed the regulation of Tac1 expression by ghrelin using qPCR on the mediobasal hypothalami extracted from an independent cohort of identically treated rats (Figure 1B). In that second experiment, an additional group of vehicle or ghrelin-treated rats received HFD (38% of kcal from fat) during the 7-day infusion period as previously described (6). Ghrelin-treated rats showed a significant decrease in Tac1 expression in the mediobasal hypothalamus, regardless of the diet (Figure 1B). In addition, a two-way ANOVA analysis detected a significant main effect of the diet on hypothalamic Tac1 expression (P < .05) (Figure 1B), indicating that its expression is susceptible to regulation by dietary composition or energy status. We investigated next whether icv ghrelin regulates hypothalamic Tac1 expression acutely. Tac1 gene expression was significantly reduced in the mediobasal hypothalamus of rats 2 hours after iv3rd injection of ghrelin (10 μg/2 μL) in ad libitum, chow-fed male rats (Figure 1C). We then investigated whether Tac1 expression in the ARC would respond to changes in the nutritional status similarly to a well-known ghrelin-regulated gene such as Agrp. Given that Tac1 is a sex-regulated gene (18–21), we compared the effect of a 24-hour fasting in the expression of Agrp and Tac1 in the ARC of male and female mice. When compared with ad libitum-fed controls, fasting induced a significant increase in Agrp expression (P < .01, main effect of fasting), which became significant only in the male mice (Figure 1D). In contrast to Agrp, fasting did not affect Tac1 expression. Of note, Tac1 expression was slightly but significantly reduced in female mice when compared with males (P < .05, main effect of sex) (Figure 1D). This suggests that control of TAC1 expression by ghrelin is specific and not secondary to changes in energy balance.
Figure 1.
Effect of icv administration of ghrelin in the gene expression of Tac1 gene in the rat hypothalamus. A, Tac1 expression detected by microarray analysis in samples of ARC, VMN, and VTA obtained by LCMD from the brain of chow-fed rats chronically infused with ghrelin (2.5 nmol/d) during 7 days. Ghrelin treatment significantly reduced Tac1 expression (P < .05) in comparison with vehicle control. B, Tac1 expression determined by qPCR in mediobasal hypothalamus of rats chronically infused with ghrelin (2.5 nmol/d) during 7 days. The rats were fed with a CD before the experiment and were maintained in on that diet of switched to a HFD during the period of icv infusion. Ghrelin reduced Tac1 expression (P < .001, main effect of the treatment) both in chow- and in high fat-fed rats. There was a statistically significant effect of the diet (P = .013, main effect of the diet). C, Tac1 expression determined by qPCR in mediobasal hypothalamus of rats previously (−2 h) injected icv in the third ventricle with ghrelin (10 μg/2 μL). D, Agrp and Tac1 expression in the ARC of male of female mice fed ad libitum or fasted for 24 hours. Gene expression is expressed as microarray signal (A) or as relative level compared with the Rpl32 housekeeping gene after normalization by δ Ct method (B–D). *, P < .05; **, P < .01; ***, P < .001 vs corresponding vehicle or as indicated by the bracket. Statistical analysis: t test (A and C) or two-way ANOVA followed by Bonferroni post hoc test (B and D). Data presented as mean ± SEM, except for A where only mean is shown. n = 4, 7–8, or 5–6 per group for A, B and C, and D, respectively.
Effect of acute icv administration of TAC1-derived peptides in male rats
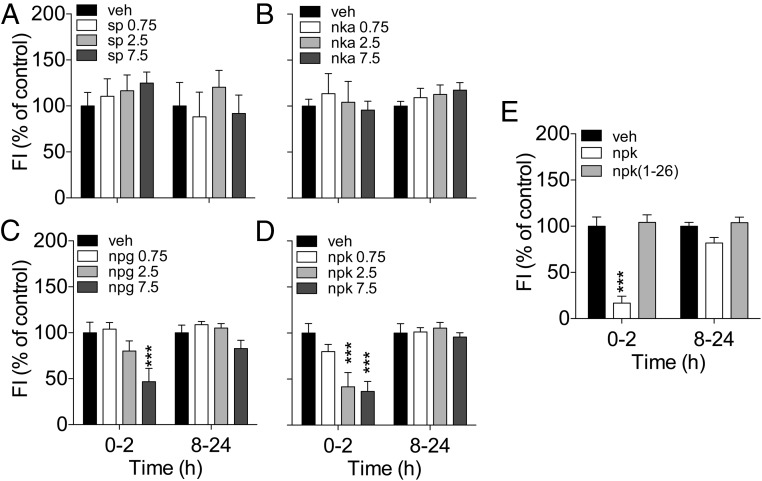
The TAC1 transcript contains the sequences of the peptides SP, NKA, NPK, and NPG (22). We reasoned that at least 1 of the TAC1-derived peptides could play a role in the control of energy balance, likely in opposition to the effect of ghrelin. In order to test this, we performed 2 sets of studies. First, we determined the effect on food intake of each of the TAC1 products by acutely injecting them via iv3rd at increasing doses (0.75, 2.5, and 7.5 nmol) in fasted rats. Iv3rd injection of SP or NKA did not affect feeding at any of the doses tested (Figure 2, A and B). In contrast, iv3rd injection of 7.5 nmol of NPG reduced food intake during the first 2 hours after injection (Figure 2C). Similarly, iv3rd-NPK at doses of at least 2.5 nmol induced significant anorexia at 2 hours (Figure 2D). The contrast between the reduction on food intake induced by NPK and the lack of effect of NKA is intriguing considering that the 10-amino acid carboxyl-terminus of NPK contains the tachykinin consensus sequence encoding NKA. We investigated a potential tachykinin-independent effect of NPK on food intake by comparing the effect on feeding of equimolar (2.5 nmol) doses of native NPK and the amino-terminal fragment NPK(1–26). In contrast with the effect of NPK, iv3rd injection of NPK(1–26) failed to reduce 2-hour food intake in overnight-fasted rats (Figure 2G). These data demonstrate that despite the inability of NKA to reduce food intake, the 10-amino acid C-terminal sequence is necessary for the effect of NPK on feeding.
Figure 2.
Effect of acute icv injection of TAC1-derived peptides on food intake on chow-fed Long-Evans male rats. A–D, Food intake change after icv injection of SP (A), NKA (B), NPG (C), and NPK (D) at doses of 0.75, 25, or 7.5 nmol in overnight-fasted rats. Neither SP (A) nor NKA (B) affect food intake at any of the doses tested. C, NPG reduced 2-hour food intake when injected at the dose of 7.5 nmol (P < .001). D, NPK reduced 2-hour food intake when injected at doses of 2.5 and 7.5 nmol (P < .001). E, The loss of the 10-amino acid tachykinin consensus sequence at the carboxyl-terminus eliminated the ability of NPK to reduce feeding when administered at a dose of 2.5 nmol. The average 0- to 2- and 8- to 24-hour food intake was 6.4 and 18.4 g, respectively. ***, P < .001 vs vehicle, one-way ANOVA followed by Tukey's post hoc test. Data presented as mean ± SEM, n = 7–10.
Effect of chronic icv administration of NPK in male mice
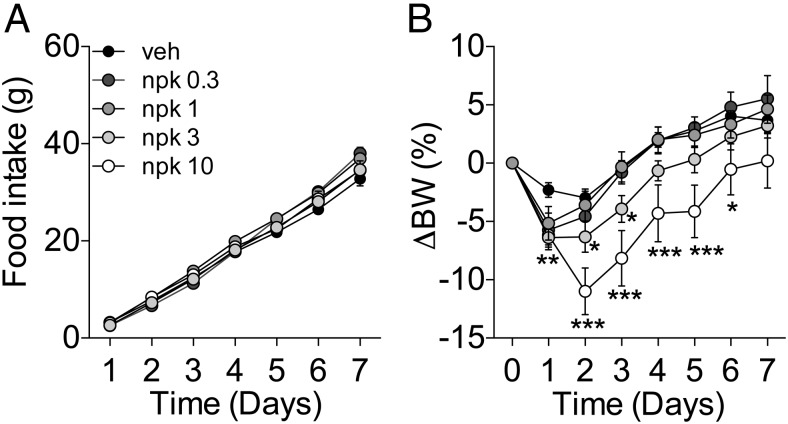
We investigated the effect of central chronic administration of increasing doses (0.3, 1, 3, and 10 nmol/d) of NPK in lean, chow-fed C57/Bl6 male mice using osmotic minipumps. NPK did not reduce feeding when infused icv into mice (Figure 3A). However, the doses of 3 and 10 nmol/d of icv NPK significantly reduced BW until day 3 and 6, respectively (Figure 3B).
Figure 3.
Effect of 7-day icv infusion of NPK on food intake and body weight of chow-fed C57Bl6 male mice. Effect on food intake (A) and BW change (B) of the icv administration of increasing doses of NPK (veh, 0.3, 1, 3, and 10 nmol/d, n = 13, 7, 13, 11, and 5, respectively). A, None of the doses affected food intake. B, There was a significant reduction on BW between the groups receiving 3 and 10 nmol/d when compared with the vehicle control group (P < .01 and P < .001vs veh, respectively, main effect of dose two-way repeated measurements ANOVA). *, P < .05; **, P < .01; ***, P < .001 vs vehicle. The initial BW was 25.95 ± 0.2 g. Data presented as mean ± SEM.
Role of TAC1 in the control of energy balance by ghrelin in male mice
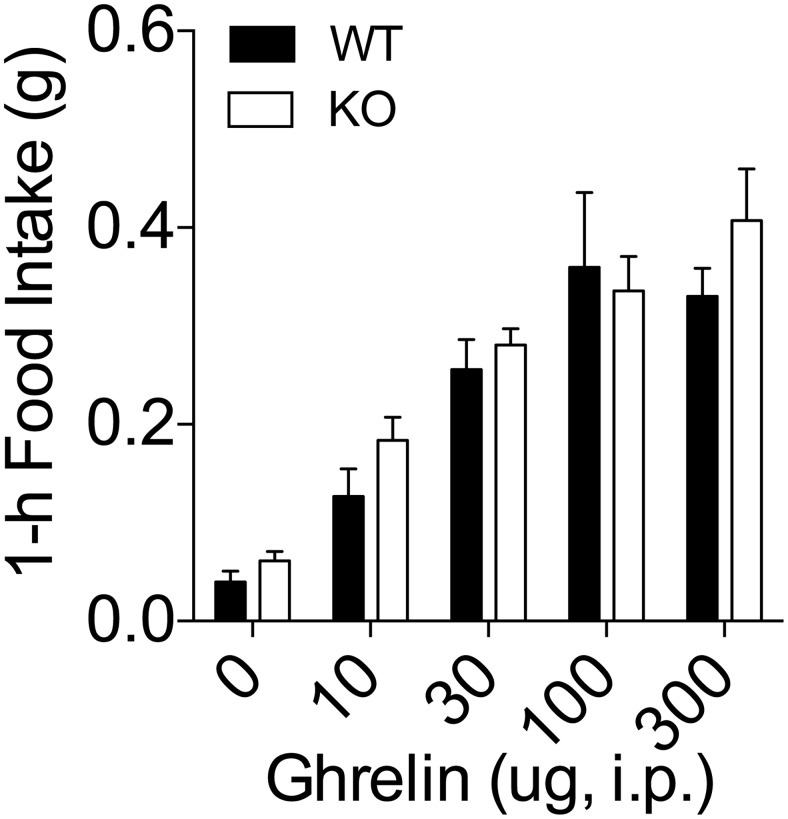
Considering the control of Tac1 gene expression by ghrelin and the induction of negative energy balance by the TAC1-derived peptide NPK, we investigated whether Tac1 expression is necessary for the control of energy balance by ghrelin. First, we tested whether Tac1 expression is necessary for the feeding response triggered by acute administration of ghrelin. To this end, we measured food intake for 1 hour after the administration of increasing doses of ghrelin (0, 10, 30, 100, and 300 μg per mouse) via ip injection in chow-fed WT mice and KO littermates. As expected, increasing doses of ghrelin increased 1-hour food intake in WT mice and had a similar potency in the KO mice (Figure 4).
Figure 4.
Feeding response after acute injection of ghrelin in KO male mice. Lean, chow-fed KO male mice and WT littermates were injected ip with increasing doses of ghrelin 2 hours after the onset of the light phase. Food intake was recorded 1 hour after the injection. Ghrelin administration increased feeding in a dose-dependent manner. There were not significant differences in the ghrelin-induced hyperphagia between KO and WT mice. Data presented as mean ± SEM. Number of replicates as follows: 19–21 for dose of 0, 11–13 for the dose of 10 μg, 11–12 for the dose of 30 μg, 7–8 for the dose of 100 μg, and 7–9 for the dose of 300 μg.
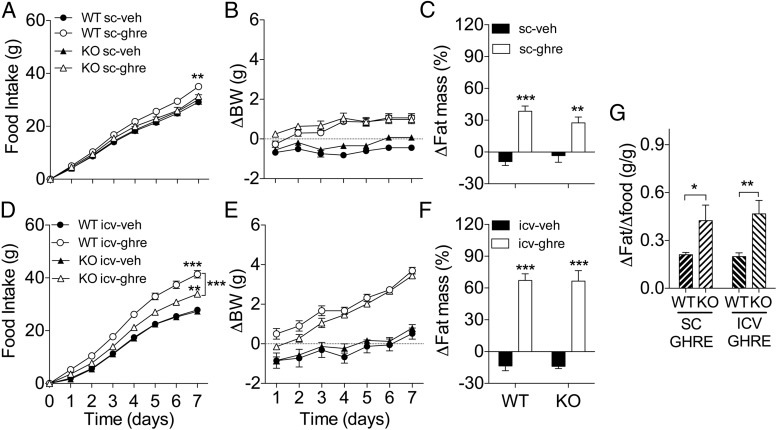
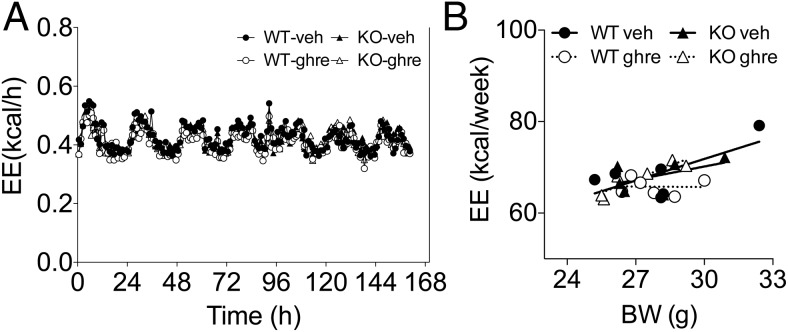
Next, we investigated the role of Tac1 expression in the control of adiposity by ghrelin. To this end, we first injected WT and in KO mice with ghrelin peripherally for 7 days (50 μg/mouse, twice a d). Ghrelin significantly increased 7-day food intake in the WT but not in the KO mice (Figure 5A). In contrast, ghrelin significantly increased body weight gain in both WT and KO mice and to a similar extent (Figure 5B), an increase that correlated with a significant increase in fat mass (Figure 5C). In order to maximize the efficacy of ghrelin increasing food intake and adiposity, we chronically infused ghrelin directly in the brain via icv during 7 days at a dose of 2.5 nmol/d in WT and KO mice. As predicted, the infusion of ghrelin directly in the brain significantly increased food intake in WT mice (Figure 5D). In contrast to the effect of peripheral administration, icv ghrelin significantly increased feeding in KO mice, although the hyperphagic effect of ghrelin in KO mice was significantly reduced when compared with the effect observed in ghrelin-treated WT littermates (Figure 5D). These results suggest that TAC1 is required for the full hyperphagic effect of ghrelin. Despite the differences on food intake, icv ghrelin significantly increased BW (Figure 5E) and fat mass (Figure 5F) in both groups of mice and to a similar extend. Furthermore, the food efficiency was significantly increased in KO mice in comparison with WT controls regardless the route of ghrelin administration (Figure 5G). Intriguingly, this increase in food efficiency did not correlate with a significant decrease in EE in the KO mice treated with ghrelin peripherally for 7 days (50 μg/mouse, twice a d, as described above) as investigated by indirect calorimetry (Figure 6, A and B). Regardless, this data suggests that Tac1 plays a role in the mechanisms involved in the control of food efficiency and energy deposition and confers resistance to the effects of ghrelin on fat mass.
Figure 5.
Reduced ghrelin-induced hyperphagia but enhanced food efficiency in male KO mice. Effect on food intake (A and D) BW gain (B and E) and fat mass gain (C and F) of chronic administration of ghrelin (A–C: peripheral administration of 50 μg, sc, twice a day; D–F: icv infusion of 2.5 nmol/d) for 7 days in male KO mice. A, Chronic peripheral treatment with ghrelin increased food intake only in WT mice after 7 days (P < .01, WT ghre vs WT veh). B, Despite lack of effect on feeding, treatment with ghrelin significantly increased BW at the same extend in WT and KO mice (P < .001, main effect of treatment). C, Consistent with the effect on BW, ghrelin significantly increased fat mass in WT and KO mice (P < .001 and < 0.01, WT ghre and KO ghre vs appropriate control). D, Chronic icv ghrelin for 7 days significantly increased food intake in KO mice (P < .01, KO ghre vs KO veh), although there was a significant interaction between treatment and genotyping (P < .01), and the increase was significantly smaller (P < .001 KO ghre vs WT ghre) in comparison with the hyperphagia induced in WT mice (P < .001, WT ghre vs WT veh). E, Despite different food intake, treatment with ghrelin significantly increased BW at the same extend in WT and KO mice (P < .001, main effect of treatment; two-way ANOVA). F, Consistent with the effect on BW, ghrelin significantly increased fat mass in WT and KO mice (P < .001, WT ghre and KO ghre vs appropriate control, respectively). G, KO mice showed significantly increased food efficiency after ghrelin administration in comparison with WT mice, regardless the route of administration (P < .05 and P < .01 KO vs WT, sc ghre and icv ghre, respectively). Food efficiency was calculated as the ratio of excess fat mass gain by excess food intake vs the average of the control. *, P < .05; **, P < .01; ***, P < .001 vs corresponding vehicle control or as indicated by brackets. Statistical analysis, two-way ANOVA, Bonferroni post hoc test (A–F) or t test (G). Data presented as mean ± SEM, n = 5–6 and 6–7 mice per group for A–C and D–F, respectively.
Figure 6.
EE in WT and KO male mice during chronic administration of ghrelin. A, Effect on EE of chronic administration of ghrelin (peripheral administration of 50 μg, sc, twice a day; D–F: icv infusion of 2.5 nmol/d) or vehicle for 1 week in WT and KO male mice. B, One-week EE relative to BW. Analysis of covariance revealed a significant effect of BW (F = 10.71, P < .01), but not treatment of genotype, on EE. Data presented as mean ± SEM, n = 6 per group.
Role of Tac1 in the control of energy balance by ghrelin in female mice
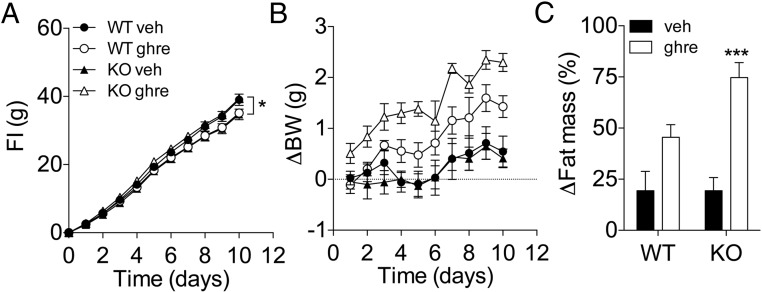
It is well established that the status of the gonadal axis plays a role in the control of Tac1 expression in the hypothalamus (18–21) and in the effectiveness of ghrelin regulating energy balance in female rodents (7). We investigated the role of Tac1 in regulating ghrelin sensitivity in female mice by administering ghrelin peripherally for 10 days (50 μg/mouse, twice a d) to WT and KO female littermate mice. In contrast to male mice (Figure 5A), peripheral treatment with ghrelin did not increase food intake in female WT mice (Figure 7A). In contrast, there was a small but significant increase in food intake in ghrelin-treated KO female mice in comparison with their vehicle-treated controls (Figure 7A). Although 10-day ghrelin administration significantly increased BW n in both WT and KO mice, there was a significant interaction between treatment and genotype (Figure 7B). Consistently, ghrelin treatment was insufficient to induce a significant fat mass gain in the WT mice but led to a significant increase in fat mass in KO mice (Figure 7C).
Figure 7.
Enhanced ghrelin-induced adiposity in female KO mice. Effect on food intake (A), BW gain (B), and fat mass gain of chronic administration of ghrelin (50 μg, sc, twice a d) for 10 days in female KO mice. A, In contrast to WT mice, ghrelin treatment led to a slight but significant increase in food intake after 10 days of treatment (P < .01, treatment × genotype by two-way ANOVA; *, P < .05 KO ghre vs KO veh; Bonferroni post hoc test). B, At the end of the 10-day period of treatment with ghrelin, there was a statistically significant interaction (P < .05, two-way ANOVA) between treatment and genotype on BW change. Only KO mice showed a significant increase in BW (P < .001, KO ghre vs KO veh; two-way ANOVA, Bonferroni post hoc test). C, Consistent with the effect on BW, ghrelin treatment significantly increased fat mass in KO mice (P < .001, two-way ANOVA, Bonferroni post hoc test). Data presented as mean ± SEM, n = 5–6 mice per group.
Role of Tac1 expression in the susceptibility to diet-induced obesity in ovariectomized (OVX) mice
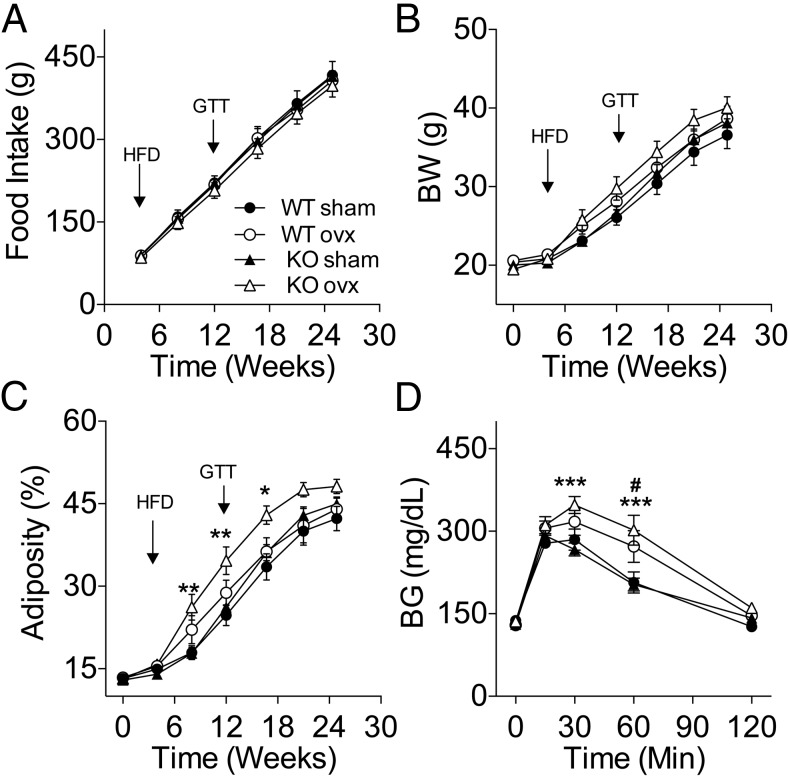
The increased sensitivity to ghrelin in female mice lacking Tac1 expression led us to investigate whether Tac1 is involved in the control of energy balance by gonadal signals in female mice. To this aim, we studied the effect of OVX on food intake and body composition in KO mice and WT littermates. The mice were maintained on CD during the first 4 weeks after OVX, during which neither feeding nor BW were significantly affected. However, there was a significant increase in adiposity in KO-OVX when compared with KO-sham (16.0 ± 0.5% vs 14.0 ± 0.4%, P < .01) but not among WT groups. Four weeks after OVX, we replaced the CD for a HFD (58.0% of kcal from fat) and monitored the mice for 20 additional weeks. Neither genotype nor surgery affected food intake (Figure 8A). The BW between WT and KO sham control groups was similar during the course of the experiment (Figure 8B). There was a significant interaction between time and the effect of the OVX on the BW of the KO mice (P < .05) but not between the WT groups (Figure 8B). The increase in BW in the OVX-KO mice correlated with a significant fat mass gain (P < .01), whereas lean mass gain remained unaffected (data not shown). The expression of body composition as percentage of adiposity reveals that the KO-OVX mice had significantly higher adiposity than KO-sham controls (P < .01) (Figure 8C). In our experiment, both WT mice groups developed similar adiposity despite OVX (Figure 8C). Similarly, there was no difference in the development of DIO between the KO-sham and WT-sham control mice. Based on the increased susceptibility to fat mass gain observed in the KO mice we investigated the status of glucose homeostasis at week 12 after OVX by performing an ipGTT. OVX induced an only statistically significant impairment on glucose tolerance in KO mice (Figure 8D), although BG remained significantly elevated in both KO-OVX and WT-OVX groups at time 60 minutes in comparison with their corresponding controls as indicated by the statistical post hoc test.
Figure 8.
Increased susceptibility to diet induced obesity and glucose intolerance in high fat-fed OVX KO mice. Lean chow-fed mice were OVX or received sham surgery and were switched to a HFD 4 weeks later. A, Cumulative food intake. Neither surgery nor genotype significantly affected food intake before (data not shown) or after the switch to a HFD. B, Body weight. Although the presurgical BW of the KO was slightly lower than the WT controls (19.77 ± 0.2268g vs 20.47 ± 0.2409g; P < .05, t test), the percentage of adiposity was similar between WT and KO (13.32 ± 0.2651% vs 13.05 ± 0.2825%; respectively. A repeated measurement ANOVA detected a statistically significant difference in BW between KO-sham and KO-OVX (P < .05) during the duration of the study. C, Adiposity. A repeated measurements ANOVA detected a statistically significant difference in adiposity between KO-sham and KO-OVX (P < .01, main effect of the surgery; P < .001 main interaction effect between groups and time). Adiposity was calculated as ratio fat mass divided by the sum of fat mass and lean mass as determined using NMR. D, Glucose tolerance. KO-OVX BG levels were significantly higher than KO-sham at times 30 and 60 minutes after an ip glucose bolus (2 g/kg) (P < .001) in WT mice after 8 weeks of high-fat feeding. In contrast, KO-OVX mice were significantly glucose intolerant when compared with KO sham controls (P < .01, main effect of surgery) (D). Inset graph displays the area under the curve (AUC). #, P < .05: WT-sham vs WT-OVX; *, P < .05; **, P < .01; ***, P < .001: KO-sham vs KO-OVX, two-way ANOVA, Bonferroni post hoc test. Data presented as mean ± SEM, n = 10–13 mice per group.
Discussion
Using the combination of LCMD followed by microarray analysis of gene expression, we have identified TAC1 as a ghrelin-regulated gene, specifically in the ARC of the hypothalamus. Regulation of TAC1 expression by ghrelin was confirmed by qPCR in samples of mediobasal hypothalamus obtained in independent experiments involving rats treated either chronically or acutely with icv ghrelin. The site specificity of TAC1 regulation is intriguing, considering that such regulation was not found in VMN, a nucleus that exhibits substantial expression levels of both GHSR (23, 24) and TAC1 (25) in the rat. Whether this nucleus-specific control or TAC1 expression is due to different intrinsic cell properties of GHSR-expressing neurons or whether it is the result of indirect activation by other GHSR neurons that specifically regulate TAC1 in ARC will require further investigation. Similarly, the sites targeted by ARC TAC1 neurons that may contribute to the effect of ghrelin on energy balance remain to be determined, although there is evidence of projections to other centers involved in the control of energy balance, such as the paraventricular nucleus of the hypothalamus (26, 27).
TAC1 is processed into 4 main peptides, all of which have been found in brain tissue, including the hypothalamus (28, 29). Our pharmacological experiments point towards NPK, and perhaps NPG, as the TAC1-derived peptides that may be involved in the control of energy balance. Neurons expressing NPK-inmunoreactivity have been reported in several hypothalamic sites involved in the control of energy homeostasis, including the ventromedial and the ARC nucleus (30, 31), and previous studies in rats (32, 33) and chicks (34) have described an inhibitory effect of NPK on feeding. NPK is a very efficacious agonist of the NKA receptor, neurokinin-2 receptor (35, 36), although it also has affinity for the SP receptor neurokinin-1 receptor (36), which appears to mediate the effects of icv NPK on the cardiovascular system (37). The reason why neither SP nor NKA are able to mimic the effect on feeding and BW of NPK remains unknown. Interestingly, previous reports have shown an enhanced biological activity of NPK in comparison with the shorter TAC1 products eliciting a sialogogic response (38) or suppressing LH plasma levels in rats (39). Nevertheless, our data support the involvement of a tachykinin receptor mediating the anorectic effect of NPK, given the lack of effect of a truncated NPK(1–26) isoform lacking the C-terminal NKA sequence. Experiments including animal models with selective site-specific disruption of NKRs will contribute to dissect the neural circuits underlying the control of energy balance by TAC1-derived peptides.
Our experiments involving mice lacking TAC1 demonstrate that circuits contributed by tachykinin signaling play a role in the control of energy balance by ghrelin. Interestingly, KO male mice display similar hyperphagic response after the acute administration of ghrelin than WT controls but different efficiency accumulating fat after chronic ghrelin administration. This contrasting response to ghrelin further suggests that the control of fat deposition by ghrelin is regulated independently from food intake, as we previously have shown using dietary manipulations (6). Altogether, the reduction of TAC1 expression by ghrelin and the induction of negative energy balance by TAC1-derived peptides suggest that TAC1 in the brain contributes to limit the nutrient deposition as fat.
The effect of ghrelin on energy balance is subjected to inhibitory control by the status of the hypothalamic-pituitary-gonadal axis (7, 8), suggesting that a reduction of the efficacy of ghrelin may contribute to the better metabolic control attributed to the beneficial effects of gonadal signals such estrogen. Estrogen regulates multiple factors contributing to the control of energy balance (40–42), including the activity of ARC-neuropeptide Y (NPY)/agouti-related peptide (AGRP) neurons (13), which are also a prominent site of action involved in the control of feeding by ghrelin (13, 43). However, and in contrast to GHSR, the expression of the estrogen receptor (ER)a in NPY/AGRP neurons is negligible (13). However, ERa and GHSR do colocalize in ARC neurons (44), raising the possibility that neurons other than those expressing NPY/AGRP may play a role in the control of energy balance by ghrelin and E. Our data and previous findings suggest that ARC-TAC1 neurons may be among those. Indeed, the hypothalamic-pituitary-gonadal axis regulates TAC1-expressing neurons in the hypothalamus of both in rodents and humans (18–20, 45–47). The precise mechanisms and physiological implications of this interaction remain poorly understood, due in part to the conflicting results reported in the literature. For example, estrogen replacement reduces the number of TAC1-expressing neurons in ARC of OVX mice (47). However, and in contrast to the effect of ghrelin, estrogen appears to be a positive modulator of TAC1 in the hypothalamus in rats. Thus, there are estrogen binding sites in TAC1-expressing neurons in the ARC and VMN of the rat (48), and estrogen replacement increased Tac1 mRNA levels in the hypothalamus of OVX rats (18), whereas its administration to castrate rats or intact mice increased the hypothalamic content of TAC1-derived peptides like NKA (49). It is also possible that different sets of TAC1-expressing neurons mediate the specific effect of ghrelin and factors contributing to the sex-dependent control of energy balance. This possibility is supported by the fact that female, but not male, mice lacking Nkx2–1 neurons specifically in the VMN, exhibit reduced populations of ERa/TAC1-expressing neurons in the VMN, decreased locomotor activity and obesity (50). Taken together, the regulation of Tac1 by ghrelin or estrogen and the increased susceptibility to fat mass gain of female Tac1 KO in response to obesigenic factors such as ghrelin, or high-fat feeding, at least when deprived of gonadal signals, certainly support a role of TAC1 neurons linking the control of the gonadal function and energy balance.
In summary, our data clearly demonstrate that, in addition to the circuits targeted by AGRP/NPY neurons, tachykinin signaling in the brain plays a role in the control of fat mass deposition by ghrelin. In addition, these data suggest that hypothalamic TAC1 may play a role in adjusting whole body adiposity in response to changes in the status of the reproductive axis and energy availability. If this proves to be true, that would open the possibility of investigating TAC1-derived peptide signaling as potential target for the treatment of obesity and its comorbidities derived of alterations in the reproductive function.
Acknowledgments
We thank Dr M. Susan Smith of Oregon Health & Science University for her insightful comments on the manuscript and Ms Nicki Parker and Ms Christine Raver of University of Cincinnati for their excellent technical assistance.
Present address for D.K.: Helmholtz Center Munich, D-85748 Garching Munich, Germany.
Present address for K.H.: Division of Diabetes, Obesity and Metabolism, Oregon National Primate Research Center, Oregon Health and Science University, Beaverton, OR 97006.
Present address for H.K.: Department of Molecular Medicine and Surgery, Karolinska Institutet, SE-171 77 Stockholm, Sweden.
This work was supported by the National Institutes of Health Grant 5R01DK077975-05 (to D.P.-T.). C.T. received financial support as visiting scientist from Zydus Cadila. X.S., Y.-C.L.T., and G.S.H.Y. are supported by the United Kingdom Medical Research Council MRC_MC_UU_12012/1, European Union FP7-HEALTH-2009–241592, EurOCHIP, European Union FP7-FOOD-266408 Full4Health, and the Helmholtz Alliance Imaging and Curing Environmental Metabolic Diseases.
Disclosure Summary: The authors have nothing to disclose.
Footnotes
- AGRP
- agouti-related peptide
- ARC
- arcuate nucleus of the hyopthalamus
- BG
- blood glucose
- CD
- chow diet
- EE
- energy expenditure
- ER
- estrogen receptor
- GHSR
- GH secretagoge receptor
- HFD
- high-fat diet
- icv
- intracerebroventricular
- ipGTT
- ip glucose tolerance test
- iv3rd
- injection in the third cerebral ventricle
- KO
- deficient
- LCMD
- laser capture microdissection
- NKA
- neurokinin A
- NPG
- neuropeptide γ
- NPK
- neuropeptide K
- NPY
- neuropeptide Y
- OVX
- ovariectomized
- qPCR
- quantitative polymerase chain reaction
- SP
- substance P
- Tac1
- tachykinin-1
- VMN
- ventromedial nucleus of the hypothalamus
- VTA
- ventral tegmental area
- WT
- wild type.
References
- 1. Tschöp M, Smiley DL, Heiman ML. Ghrelin induces adiposity in rodents. Nature. 2000;407(6806):908–913. [DOI] [PubMed] [Google Scholar]
- 2. Mason BL, Wang Q, Zigman JM. The central nervous system sites mediating the orexigenic actions of ghrelin. Annu Rev Physiol. 2014;76:519–533. [DOI] [PMC free article] [PubMed] [Google Scholar]
- 3. Mason BL, Wang Q, Zigman JM. The central nervous system sites mediating the orexigenic actions of ghrelin. Annu Rev Physiol. 2014;76:519–533. [DOI] [PMC free article] [PubMed] [Google Scholar]
- 4. Andrews ZB. Central mechanisms involved in the orexigenic actions of ghrelin. Peptides. 2011;32(11):2248–2255. [DOI] [PubMed] [Google Scholar]
- 5. Briggs DI, Enriori PJ, Lemus MB, Cowley MA, Andrews ZB. Diet-induced obesity causes ghrelin resistance in arcuate NPY/AgRP neurons. Endocrinology. 2010;151(10):4745–4755. [DOI] [PubMed] [Google Scholar]
- 6. Perez-Tilve D, Heppner K, Kirchner H, et al. Ghrelin-induced adiposity is independent of orexigenic effects. FASEB J. 2011;25(8):2814–2822. [DOI] [PMC free article] [PubMed] [Google Scholar]
- 7. Clegg DJ, Brown LM, Zigman JM, et al. Estradiol-dependent decrease in the orexigenic potency of ghrelin in female rats. Diabetes. 2007;56(4):1051–1058. [DOI] [PubMed] [Google Scholar]
- 8. Sakurazawa N, Mano-Otagiri A, Nemoto T, Shibasaki T. Effects of intracerebroventricular ghrelin on food intake and Fos expression in the arcuate nucleus of the hypothalamus in female rats vary with estrous cycle phase. Neurosci Lett. 2013;541:204–208. [DOI] [PubMed] [Google Scholar]
- 9. Abizaid A, Liu ZW, Andrews ZB, et al. Ghrelin modulates the activity and synaptic input organization of midbrain dopamine neurons while promoting appetite. J Clin Invest. 2006;116(12):3229–3239. [DOI] [PMC free article] [PubMed] [Google Scholar]
- 10. Guan XM, Yu H, Palyha OC, et al. Distribution of mRNA encoding the growth hormone secretagogue receptor in brain and peripheral tissues. Brain Res Mol Brain Res. 1997;48(1):23–29. [DOI] [PubMed] [Google Scholar]
- 11. Nogueiras R, Tovar S, Mitchell SE, et al. Regulation of growth hormone secretagogue receptor gene expression in the arcuate nuclei of the rat by leptin and ghrelin. Diabetes. 2004;53(10):2552–2558. [DOI] [PubMed] [Google Scholar]
- 12. Zigman JM, Nakano Y, Coppari R, et al. Mice lacking ghrelin receptors resist the development of diet-induced obesity. J Clin Invest. 2005;115(12):3564–3572. [DOI] [PMC free article] [PubMed] [Google Scholar]
- 13. Olofsson LE, Pierce AA, Xu AW. Functional requirement of AgRP and NPY neurons in ovarian cycle-dependent regulation of food intake. Proc Natl Acad Sci USA. 2009;106(37):15932–15937. [DOI] [PMC free article] [PubMed] [Google Scholar]
- 14. Heppner KM, Chaudhary N, Müller TD, et al. Acylation type determines ghrelin's effects on energy homeostasis in rodents. Endocrinology. 2012;153(10):4687–4695. [DOI] [PMC free article] [PubMed] [Google Scholar]
- 15. Heppner KM, Piechowski CL, Müller A, et al. Both acyl and des-acyl ghrelin regulate adiposity and glucose metabolism via central nervous system ghrelin receptors. Diabetes. 2014;63(1):122–131. [DOI] [PMC free article] [PubMed] [Google Scholar]
- 16. Tung YC, Ma M, Piper S, Coll A, O'Rahilly S, Yeo GS. Novel leptin-regulated genes revealed by transcriptional profiling of the hypothalamic paraventricular nucleus. J Neurosci. 2008;28(47):12419–12426. [DOI] [PMC free article] [PubMed] [Google Scholar]
- 17. Tschöp MH, Speakman JR, Arch JR, et al. A guide to analysis of mouse energy metabolism. Nat Methods. 2012;9(1):57–63. [DOI] [PMC free article] [PubMed] [Google Scholar]
- 18. Brown ER, Harlan RE, Krause JE. Gonadal steroid regulation of substance P (SP) and SP-encoding messenger ribonucleic acids in the rat anterior pituitary and hypothalamus. Endocrinology. 1990;126(1):330–340. [DOI] [PubMed] [Google Scholar]
- 19. Dufourny L, Warembourg M. Estrogen modulation of neuropeptides: somatostatin, neurotensin and substance P, in the ventrolateral and arcuate nuclei of the female guinea pig. Neurosci Res. 1999;33(3):223–228. [DOI] [PubMed] [Google Scholar]
- 20. Duval P, Lenoir V, Kerdelhue B. Ovarian steroid modulation of neurokinin contents in hypothalamus, pituitary, trigeminal nucleus, and cervical spinal cord of the ovariectomized female rat. J Neuroendocrinol. 1998;10(11):823–828. [DOI] [PubMed] [Google Scholar]
- 21. Rance NE. Menopause and the human hypothalamus: evidence for the role of kisspeptin/neurokinin B neurons in the regulation of estrogen negative feedback. Peptides. 2009;30(1):111–122. [DOI] [PMC free article] [PubMed] [Google Scholar]
- 22. Carter MS, Krause JE. Structure, expression, and some regulatory mechanisms of the rat preprotachykinin gene encoding substance P, neurokinin A, neuropeptide K, and neuropeptide γ. J Neurosci. 1990;10(7):2203–2214. [DOI] [PMC free article] [PubMed] [Google Scholar]
- 23. Guan XM, Yu H, Palyha OC, et al. Distribution of mRNA encoding the growth hormone secretagogue receptor in brain and peripheral tissues. Brain Res Mol Brain Res. 1997;48(1):23–29. [DOI] [PubMed] [Google Scholar]
- 24. Zigman JM, Jones JE, Lee CE, Saper CB, Elmquist JK. Expression of ghrelin receptor mRNA in the rat and the mouse brain. J Comp Neurol. 2006;494(3):528–548. [DOI] [PMC free article] [PubMed] [Google Scholar]
- 25. Tsuruo Y, Kawano H, Nishiyama T, Hisano S, Daikoku S. Substance P-like immunoreactive neurons in the tuberoinfundibular area of rat hypothalamus. Light and electron microscopy. Brain Res. 1983;289(1–2):1–9. [DOI] [PubMed] [Google Scholar]
- 26. Bittencourt JC, Benoit R, Sawchenko PE. Distribution and origins of substance P-immunoreactive projections to the paraventricular and supraoptic nuclei: partial overlap with ascending catecholaminergic projections. J Chem Neuroanat. 1991;4(1):63–78. [DOI] [PubMed] [Google Scholar]
- 27. Jessop DS, Chowdrey HS, Biswas S, Lightman SL. Substance P and substance K in the rat hypothalamus following monosodium glutamate lesions of the arcuate nucleus. Neuropeptides. 1991;18(3):165–170. [DOI] [PubMed] [Google Scholar]
- 28. Diez-Guerra FJ, Veira JA, Augood S, Emson PC. Ontogeny of the novel tachykinins neurokinin A, neurokinin B and neuropeptide K in the rat central nervous system. Regul Pept. 1989;25(1):87–97. [DOI] [PubMed] [Google Scholar]
- 29. Meister B, Ceccatelli S, Hökfelt T, Andén NE, Andén M, Theodorsson E. Neurotransmitters, neuropeptides and binding sites in the rat mediobasal hypothalamus: effects of monosodium glutamate (MSG) lesions. Exp Brain Res. 1989;76(2):343–368. [DOI] [PubMed] [Google Scholar]
- 30. Meister B, Ceccatelli S, Hökfelt T, Andén NE, Andén M, Theodorsson E. Neurotransmitters, neuropeptides and binding sites in the rat mediobasal hypothalamus: effects of monosodium glutamate (MSG) lesions. Exp Brain Res. 1989;76(2):343–368. [DOI] [PubMed] [Google Scholar]
- 31. Valentino KL, Tatemoto K, Hunter J, Barchas JD. Distribution of neuropeptide K-immunoreactivity in the rat central nervous system. Peptides. 1986;7(6):1043–1059. [DOI] [PubMed] [Google Scholar]
- 32. Achapu M, Pompei P, Polidori C, de Caro G, Massi M. Central effects of neuropeptide K on water and food intake in the rat. Brain Res Bull. 1992;28(2):299–303. [DOI] [PubMed] [Google Scholar]
- 33. Sahu A, Kalra PS, Dube MG, Kalra SP. Neuropeptide K suppresses feeding in the rat. Regul Pept. 1988;23(2):135–143. [DOI] [PubMed] [Google Scholar]
- 34. Prall BC, Cline MA. Anorexigenic effects of central neuropeptide K are associated with hypothalamic changes in juvenile Gallus gallus. Gen Comp Endocrinol. 2008;159(2–3):130–135. [DOI] [PubMed] [Google Scholar]
- 35. Saffroy M, Torrens Y, Glowinski J, Beaujouan JC. Presence of NK2 binding sites in the rat brain. J Neurochem. 2001;79(5):985–996. [DOI] [PubMed] [Google Scholar]
- 36. Beaujouan JC, Saffroy M, Torrens Y, Glowinski J. Different subtypes of tachykinin NK(1) receptor binding sites are present in the rat brain. J Neurochem. 2000;75(3):1015–1026. [DOI] [PubMed] [Google Scholar]
- 37. Prat A, Picard P, Couture R. Cardiovascular and behavioural effects of centrally administered neuropeptide K in the rat: receptor characterization. Br J Pharmacol. 1994;112(1):250–256. [DOI] [PMC free article] [PubMed] [Google Scholar]
- 38. Takeda Y, Krause JE. Neuropeptide K potently stimulates salivary gland secretion and potentiates substance P-induced salivation. Proc Natl Acad Sci USA. 1989;86(1):392–396. [DOI] [PMC free article] [PubMed] [Google Scholar]
- 39. Sahu A, Kalra SP. Effects of tachykinins on luteinizing hormone release in female rats: potent inhibitory action of neuropeptide K. Endocrinology. 1992;130(3):1571–1577. [DOI] [PubMed] [Google Scholar]
- 40. Frank A, Brown LM, Clegg DJ. The role of hypothalamic estrogen receptors in metabolic regulation. Front Neuroendocrinol. 2014;35(4):550–557. [DOI] [PMC free article] [PubMed] [Google Scholar]
- 41. Mauvais-Jarvis F, Clegg DJ, Hevener AL. The role of estrogens in control of energy balance and glucose homeostasis. Endocr Rev. 2013;34(3):309–338. [DOI] [PMC free article] [PubMed] [Google Scholar]
- 42. Palmer BF, Clegg DJ. The sexual dimorphism of obesity. Mol Cell Endocrinol. 2015;402C:113–119. [DOI] [PMC free article] [PubMed] [Google Scholar]
- 43. Wang Q, Liu C, Uchida A, et al. Arcuate AgRP neurons mediate orexigenic and glucoregulatory actions of ghrelin. Mol Metab. 2014;3(1):64–72. [DOI] [PMC free article] [PubMed] [Google Scholar]
- 44. Frazao R, Dungan Lemko HM, et al. Estradiol modulates Kiss1 neuronal response to ghrelin. Am J Physiol Endocrinol Metab. 2014;306(6):E606–E614. [DOI] [PMC free article] [PubMed] [Google Scholar]
- 45. Akesson TR. Gonadal steroids regulate immunoreactive tachykinin in the ventromedial nucleus of the rat hypothalamus. J Comp Neurol. 1994;341(3):351–356. [DOI] [PubMed] [Google Scholar]
- 46. Rance NE, Young WS., 3rd Hypertrophy and increased gene expression of neurons containing neurokinin-B and substance-P messenger ribonucleic acids in the hypothalami of postmenopausal women. Endocrinology. 1991;128(5):2239–2247. [DOI] [PubMed] [Google Scholar]
- 47. Navarro VM, Bosch MA, León S, et al. The integrated hypothalamic tachykinin-kisspeptin system as a central coordinator for reproduction. Endocrinology. 2015;156(2):627–637. [DOI] [PMC free article] [PubMed] [Google Scholar]
- 48. Akesson TR, Micevych PE. Estrogen concentration by substance p-immunoreactive neurons in the medial basal hypothalamus of the female rat. J Neurosci Res. 1988;19(4):412–419, 470–471. [DOI] [PubMed] [Google Scholar]
- 49. Debeljuk L, Ghosh P, Bartke A. Neurokinin A levels in the hypothalamus of rats and mice: effects of castration, gonadal steroids and expression of heterologous growth hormone genes. Brain Res Bull. 1990;25(5):717–721. [DOI] [PubMed] [Google Scholar]
- 50. Correa SM, Newstrom DW, Warne JP, et al. An estrogen-responsive module in the ventromedial hypothalamus selectively drives sex-specific activity in females. Cell Rep. 2015;10(1):62–74. [DOI] [PMC free article] [PubMed] [Google Scholar]


