

Abstract
Assessment of molecular signatures of tumors in addition to their anatomy and morphology is desired for effective diagnostic and therapeutic procedures. Development of in vivo imaging techniques that can identify and monitor molecular composition of tumors remains an important challenge in pre-clinical research and medical practice. Here we present a molecular photoacoustic imaging technique that can visualize the presence and activity of an important cancer biomarker – epidermal growth factor receptor (EGFR), utilizing the effect of plasmon resonance coupling between molecular targeted gold nanoparticles. Specifically, spectral analysis of photoacoustic images revealed profound changes in the optical absorption of systemically delivered EGFR-targeted gold nanospheres due to their molecular interactions with tumor cells overexpressing EGFR. In contrast, no changes in optical properties and, therefore, photoacoustic signal, were observed after systemic delivery of non-targeted gold nanoparticles to the tumors. The results indicate that multi-wavelength photoacoustic imaging augmented with molecularly targeted gold nanoparticles has the ability to monitor molecular specific interactions between nanoparticles and cell-surface receptors, allowing visualization of the presence and functional activity of tumor cells. Furthermore, the approach can be used for other cancer cell-surface receptors such as human epidermal growth factor receptor 2 (HER2). Therefore, ultrasound-guided molecular photoacoustic imaging can potentially aid in tumor diagnosis, selection of customized patient-specific treatment, and monitor the therapeutic progression and outcome in vivo.
Abbreviations: AuNPs, gold nanoparticles; EGFR, epidermal growth factor receptor; PA, photoacoustic
Keywords: Photoacoustic imaging, Epidermal growth factor receptor, Multi-wavelength imaging, Gold nanoparticles, Three-dimensional imaging, Molecular imaging
1. Introduction
Molecular imaging techniques capable of good penetration depth in living tissue remain an important challenge in basic and clinical science including modern biology and medicine [1–4]. Optical imaging can provide unprecedented wealth of molecular specific information. However, tissue turbidity limits penetration depth of light in vivo to a few hundred micrometers for high-resolution imaging modalities such as confocal microscopy, optical coherence tomography (OCT), or two-photon fluorescence [5–8]. Approaches based on diffusely scattered light such as diffuse optical tomography (DOT) can extend this limit to several centimeters, but they suffer from low resolution and rely on complex reconstruction algorithms that require a priori knowledge of tissue optical properties. A unique solution to this problem is the recently emerging photoacoustic imaging technique that combines optical excitation and ultrasound detection [9–12]. This imaging approach relies on “one-way” propagation of diffusive photons into the tissue where the photoacoustic signal is generated through thermal interaction of pulsed laser light with photoabsorbers. Hence the contrast mechanism in photoacoustic imaging is primarily related to the optical absorption properties of the tissue being imaged. Beyond the depth of ballistic photons, the spatial resolution of photoacoustic imaging is determined by the ability of the ultrasound transducer to resolve the three-dimensional distribution of photoabsorbers that generate photoacoustic transient waves. Photoacoustic imaging can visualize optical absorption properties of tissue at sufficient depth, and salient features of photoacoustic imaging are described in several reviews in recent years [9–15]. Furthermore, a synergistic integration of photoacoustic imaging with clinically available ultrasound imaging systems is also possible and is being pursed [9–12].
Endogenous contrast in photoacoustic imaging is largely limited to hemoglobin and melanin molecules. In other applications, detection of lipid and collagen is possible with photoacoustic imaging [13,16–18]. Detection of other biomarkers or functionality associated with tumors requires availability of molecular probes or molecular specific contrast agents targeted to these biomarkers [14,15,19,20]. Plasmonic gold and silver nanoparticles are ideally suited for photoacoustics because of their high absorption cross-sections [10,11,20]. Molecular specificity is conferred to these plasmonic nanoparticles via conjugation to probe molecules such as antibodies [21,22]. However, the sole addition of a targeting moiety is often not sufficient for sensitive molecular imaging because of the background signal generated by the non-specific delivery of contrast agents to the imaging site. In cancer imaging, non-specific delivery of contrast agents is related to leaky vasculature of the tumor i.e., contrast agents accumulate in the tumor site primarily due to the enhanced permeability and retention (EPR) effect. As done in immunohistological protocols, extensive blocking and washing steps cannot be applied in vivo to remove non-specific binding. Multiple innovative strategies have been developed to enable highly specific molecular imaging – for example, in fluorescence imaging, various activatable probes and beacons are used to provide signal only in the presence of a biomarker of interest or detect a change in the signal on a cue from the tumor micro-environment [23–25]. However, again, most of these approaches are limited to optical modalities that do not possess sufficient penetration depth in vivo.
We and other groups have previously showed that targeted plasmonic nanoparticles by themselves can be used in a similar way as activatable contrast agents in molecular optical imaging [10,14,15,19,20,26–28]. The approach is based on the phenomenon of plasmon resonance coupling between closely spaced noble metal nanoparticles [26,27,29,30]. The coupling results in strong optical changes including red spectral shift and broadening of nanoparticle extinction spectra [21,26,27,29–31]. The formation of closely spaced assemblies can be mediated by specific interactions between targeted gold nanoparticles and a biomolecule of interest such as a cancer biomarker, e.g. epidermal growth factor receptor (EGFR) [31]. Confocal reflectance and dark-field optical imaging of EGFR positive cancer cells labeled with anti-EGFR antibody conjugated spherical gold nanoparticles showed a red shift of more than 100 nm in nanoparticle plasmon resonance frequency [27,31]. Further studies revealed that the observed optical changes are associated with EGFR activation and trafficking – key signaling pathways that determine cell behavior in normal and cancerous tissue [31]. As activated EGF receptors undergo dimerization and further aggregation in the plasma membrane, followed by internalization through endocytosis [31], the EGFR-targeted AuNPs associated with this process undergo a progressive change in optical properties (i.e., change in optical absorption) as schematically depicted in Fig. 1. Therefore, antibody targeted gold nanoparticles undergo dramatic optical changes upon binding to activated EGF receptors and endocytosis in live cells. We previously demonstrated molecular-specific photoacoustic imaging in three-dimensional cell culture phantoms and ex vivo tissue [21]. This approach is not unique to EGFR molecules and has also been applied to monitoring actin reorganization, detection of fibronectin–intergrin complexes, and imaging membrane morphology in live cells [30,31].
Fig. 1.
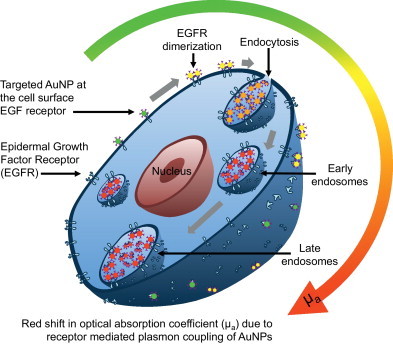
Schematic showing change in optical absorption properties of EGFR-targeted AuNPs upon interaction with a cancer cell overexpressing EGFR. Activated EGF receptors undergo dimerization and further aggregation in the plasma membrane, followed by internalization through endocytosis. The EGFR-targeted AuNPs associated in this process undergo a progressive color change (i.e., change in optical absorption) from green to red and near-infrared as depicted in the absorbance spectra at various stages of AuNPs interaction with the cancer cell.
Here, we report multi-wavelength photoacoustic imaging of cancer cells in a xenograft murine tumor model in vivo using the effect of plasmon resonance coupling of EGFR-targeted gold nanoparticles. Specifically, when targeted AuNPs bind to EGFR molecules, trafficking of the labeled receptors results in receptor-mediated aggregation of AuNPs inside endosomal compartments causing plasmon resonance coupling between closely spaced AuNPs (Fig. 1). This leads to a strong increase in absorption (thereby increase in photoacoustic signal) in the red spectral region [26,27,29,31]. These changes in optical properties provide the unique opportunity for photoacoustic imaging to monitor molecular specific interactions between nanoparticles and cell-surface receptors, allowing visualization of the presence and functional activity of viable tumor cells.
2. Materials and methods
2.1. Photoacoustic imaging system
The combined ultrasound and photoacoustic imaging system (Fig. 2a) was based on an ultrasound engine (Winprobe Corporation, North Palm Beach, FL, USA) interfaced with either a Q-switched Nd:YAG laser (532 nm wavelength, 5 ns pulses, 20 Hz pulse repetition frequency) or a tunable OPO laser system (680–950 nm wavelength, 7 ns pulses, 10 Hz pulse repetition frequency). The laser fluences were within 10–20 J/cm2 according to the American National Standards Institute (ANSI) safe exposure level for human skin. To image the tumor, an integrated imaging probe consisting of a 7.5 MHz center frequency ultrasound transducer (14 mm wide, and 128 element linear array) and a bundle of optical fibers for laser light delivery (Fig. 2b) was used. The axial, lateral, and elevational resolution of the transducer are 250, 300, and 500 μm, respectively.
Fig. 2.
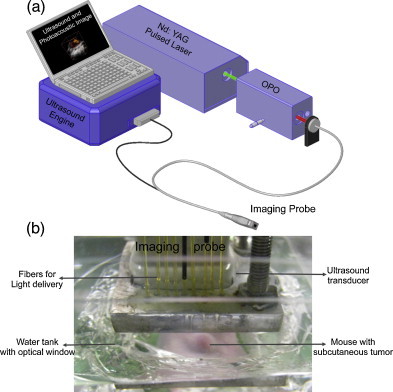
(a) The schematic of the combined ultrasound and photoacoustic imaging system used in this study. (b) Custom designed water-tank with optical window to allow ultrasound and photoacoustic imaging of subcutaneous tumors in mice. The optical fibers required for light delivery were attached to the ultrasound transducer to sequentially obtain ultrasound and photoacoustic images at the same tumor cross-section.
The integrated probe was attached to a three-dimensional positioning stage to facilitate volumetric ultrasound and photoacoustic imaging by moving the probe in steps of 400 μm in horizontal direction (orthogonal to the imaging plane). The light source, ultrasound imaging system and the positioning axes were interfaced to capture spatially co-registered RF ultrasound and photoacoustic data as described elsewhere [32]. Ultrasound and multi-wavelength photoacoustic RF data were acquired at each position of the integrated probe and stored for off-line processing.
2.2. Multi-wavelength photoacoustic image analysis
The collected RF data is beamformed using delay-and-sum approach as published previously. The absolute values of the photoacoustic analytic signals obtained at various wavelengths were normalized to compensate for the wavelength dependent laser fluence output. The multi-wavelength photoacoustic images were analyzed using intraclass correlation to identify regions of oxygenated/deoxygenated blood and nanoparticles [28]. Intraclass correlation is a method used in assessing agreement between different observers or different methods when used on the same set of subjects. The normalized spectrum of the photoacoustic signal at a pixel was compared individually to the known spectra of endocytosed nanoparticles [21] (Fig. 3) and oxygenated/deoxygenated hemoglobin [33]. The procedure is repeated for every pixel in the multi-wavelength photoacoustic image stack, and the resulting correlation coefficients were used to form an image. To obtain the spatial distribution of endocytosed nanoparticles, oxygenated blood, and deoxygenated blood, the correlation maps were thresholded (correlation coefficient greater than 0.75 were considered positive) and pseudocolored orange, red and blue for endocytosed AuNPs, oxygenated hemoglobin, and deoxygenated hemoglobin, respectively. The distribution map was displayed over the ultrasound image i.e., ultrasonic image was displayed if the correlation-based signal was smaller than a user-defined threshold or vice versa.
Fig. 3.
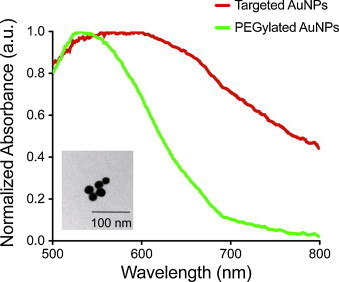
The absorbance spectra of the A431 cells incubated for 30 min with PEGylated AuNPs or EGFR-targeted AuNPs. The inset shows TEM image of PEGylated AuNPs (∼20 nm in diameter).
2.3. Preparation of bioconjugated AuNPs
Gold nanoparticles (20 nm in diameter) were prepared using citrate reduction of tetrachloroauric (III) acid (HAuCl4) under reflux (Frens method). TEM image of the nanoparticles is shown in Fig. 3 inset. Anti-EGFR monoclonal antibody (C225, Sigma) was conjugated to the AuNPs using procedure described by Kumar et al. [30]. Briefly, the carbohydrate moiety on the Fc region of the antibody (Ab) was oxidized to an aldehyde by addition of 100 mM NaIO4 to a 1 mg/mL Ab solution in HEPES (1:10 by volume). The Ab was then allowed to react with a hydrazide PEG di-thiol heterobifunctional linker (Sensopath Technologies, Inc.), where the hydrazide portion of the linker covalently bonded to the aldehyde portion of the Ab, yielding an exposed di-thiol moiety which could react strongly with the AuNPs. The Ab-linker was centrifuged in a 100 kD MWCO filter (Amicon) and resuspended in 40 mM HEPES at pH 8 (5 μg/mL). The Ab-linker was mixed with AuNPs (12 mL, 4 × 10¹⁰ particles/mL) at a 1:1 volume ratio and reacted on a shaker for 30 min at room temperature. Any remaining bare gold was capped with mPEG-SH (1.2 mL, 10−5 M, 5 kD, Creative PEGWorks) and the particles were washed via centrifugation at 1500 g in the presence of PEG (15 kD, Sigma). The non-targeted AuNPs were prepared by reacting AuNPs (12 mL, 4 × 10¹⁰ particles/mL) with mPEG-SH (1.2 mL, 10−5 M, 5 kD, Creative PEGWorks). The resulting PEGylated particles were also washed in the presence of PEG via centrifugation at 1500 g. Both the EGFR-targeted and non-targeted (PEGylated) AuNPs were sterile filtered before being administered to the nude mice. The molecular specificity of the EGFR-targeted AuNPs was also tested with cells possessing positive expression of EGFR (A431 cells) using previously published protocols [21]. The absorbance spectra of the A431 cells incubated 30 min with non-targeted AuNPs or EGFR-targeted AuNPs are shown in Fig. 3. The cells mixed with PEGylated AuNPs have an absorbance peak around 520 nm similar to a suspension of isolated gold nanoparticles. The absorbance of cells incubated with EGFR-targeted AuNPs has the peak red-shifted and broadened due to EGFR-mediated aggregation of gold nanoparticles [21]. These absorbance spectra were used as a guideline in multi-wavelength photoacoustic image analysis. Approximately 250 μL of nanoparticle solution consisting about 500 μg of gold was injected directly into the tumor region using a 27 gauge needle or injected into the mouse blood stream using a tail vein catheter (MTV01, SAI Infusion Technologies).
2.4. Murine tumor models
The tumors were inoculated in immunodeficient, albino colored female Nu/Nu mice. The mice were anesthetized with an intraperitoneal injection of Avertin (0.4–0.75 mg per gram of body weight). Either human epithelial carcinoma cell line (A431 cell line) or human breast cancer cell line (MDA-MB-435 cell line) were utilized in our experiments. Approximately 4–5 × 10⁶ cells suspended in 300 μL of phosphate buffered saline was injected subcutaneously in the flank of the mice. The tumors were inoculated on the lower peripheral region of the mouse to cause minimal tissue motion due to cardiac and respiratory cycle of the mouse during the in vivo imaging procedures. The animal facility was maintained under a 12-hr light/dark cycle at a temperature of 20–22 °C and a relative humidity of 20–50%. The weight of the mice and the tumor size were monitored until the tumors were approximately 0.6–1 cm in diameter (approximately 3 weeks post implantation). All methods used in this study were approved by the Animal Care and Use Committee at the University of Texas at Austin. Each experimental group in this study had at least 3 mice.
During the imaging procedures, the mouse was anesthetized using isoflurane gas. Isoflurane was chosen due to its less toxic nature on the mouse's metabolism. Specifically a dose of 1% isoflurane mixed with pure oxygen at a 1 L/min flow rate was used. The body temperature of the animal was maintained at 37 °C using a heating pad (THM 100, Indus Instruments). The heart rate of the mouse was monitored every 15 min during the imaging procedure to ensure well-being. A commercially available ultrasound gel (Aquasonic Gel, Parker Laboratories) was applied to the tumor region to establish contact between the mouse skin and flexible window (polyethylene film) at the bottom of a custom-built water tank (Fig. 2b). The transducer with the fiber bundle was placed in the water tank to facilitate in vivo imaging.
2.5. Histological analysis details
The tumors were extracted after euthanizing the mice via approved protocols. The tumors were stored in formalin for 24 h and transferred to 70% ethanol for storage until tissue processing. The tumors were placed in paraffin cassettes for immunohistochemistry in a similar orientation as the imaging cross-section to facilitate qualitative comparison of ultrasound and photoacoustic images with histology images. The hematoxylin and eosin stain (H&E stain) was performed to identify the tissue structure. The hematoxylin colors basophilic structures (such as the cell nucleus), and the eosin dye colors eosinophilic structures (intracellular or extracellular protein such as cytoplasm) bright pink. Silver staining procedure [34] was utilized to identify the presence of AuNPs in the tumor tissue. When AuNP labeled tissue are silver stained, the produced bimetallic nanoparticles can be easily observed using bright field microscopy even in the presence of standard histological stains. A counter stain using nuclear fast red was performed to enhance contrast between the AuNPs and the tissue when observed under a brightfield microscope.
3. Results and discussion
In the first set of mice the molecular-specific nanoparticles were injected directly to the tumor region to evaluate if photoacoustic imaging (Fig. 4) can monitor interactions between tumor cells and AuNPs. Mice with subcutaneous tumors formed using EGFR expressing A431 human keratinocytes were injected with either EGFR-targeted AuNPs or PEGylated AuNPs directly into the tumors. Ultrasound and multi-wavelength photoacoustic imaging of the central cross-section of the tumor was performed before and immediately after intratumoral injection. In addition, 3D images were acquired at 2 h and 4 h after intratumoral injection of the nanoparticles.
Fig. 4.
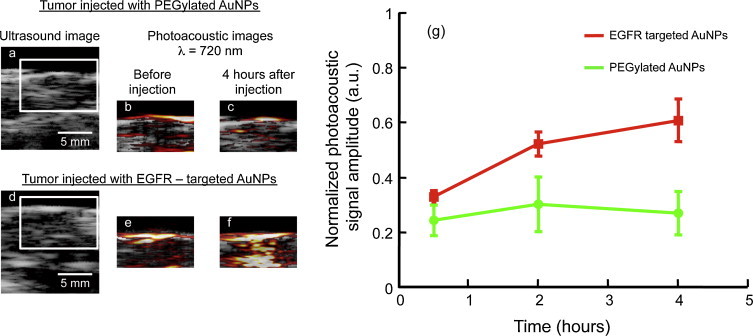
Ultrasound and photoacoustic images of EGFR-positive A431 tumors directly injected with either (a–c) PEGylated or (d–f) EGFR-targeted AuNPs. (g) The photoacoustic signal (obtained at 720 nm wavelength illumination) from the tumor region is plotted as a function of time (n = 3 mice per group). No significant (p-value > 0.05) increase in the photoacoustic signal was observed when tumors were injected with PEGylated AuNPs. However the photoacoustic signal increased over time after injection of EGFR-targeted AuNPs indicating nano-molecular interactions between the nanoparticles and the cancer cells resulting in a plasmon resonance coupling of the AuNPs. The scale bar represents 5 mm.
Ultrasound images show mouse skin as a hyperechoic region within the tumor region demarcated by a white inset in Fig. 4a and d. The corresponding photoacoustic images (obtained at 720 nm wavelength illumination, i.e., away from the ∼520 nm peak absorption of individual gold nanospheres) of tumors injected with either PEGylated AuNPs or EGFR-targeted AuNPs are shown in Fig. 4c and f, respectively. Clearly the tumor injected with EGFR-targeted AuNPs show an increase in the photoacoustic signal at 720 nm (Fig. 4f) whereas no increase in the photoacoustic signal was observed in the tumor injected with PEGylated AuNPs (Fig. 4c). This change in the photoacoustic signal is due to the molecular interactions of EGFR-targeted AuNPs with EGFR overexpressing tumor cells (Fig. 4f). No change in the photoacoustic signal was observed in the tumor injected with PEGylated AuNPs (i.e., no increase while background signal remains the same over time). Given that the non-targeted nanoparticles do not interact with cancer cells, there is no receptor-mediated endocytosis and, therefore, no plasmon coupling and no red-shift in the optical absorption of the PEGylated AuNPs in the tissue was observed. Quantitative analysis of the temporal changes in the photoacoustic signals indicate a clear enhancement at 720 nm in the tumor injected with EGFR-targeted AuNPs (Fig. 4g). The photoacoustic signal amplitude was normalized with respect to the photoacoustic signal obtained at 532 nm irradiation to compensate for possible differences in the AuNPs concentration in the imaging planes. Furthermore, the photoacoustic signal from tumor injected with EGFR-targeted AuNPs increased as a function of time (Fig. 4g) due to the continuous trafficking of EGFR-targeted AuNPs from the cell membrane to early endosomes and later to late endosomes/multivesicular bodies resulting in a time-dependent red shift in optical properties of AuNPs [31]. In contrast, the tumor injected with PEGylated AuNPs showed insignificant temporal change in the photoacoustic signal from the tumor region. The results presented in Fig. 4 suggest that the combined ultrasound and photoacoustic imaging has the ability to monitor molecular interactions of epidermal growth factor receptor (EGFR) with molecular-specific AuNPs.
In the next series of experiments we validated our imaging approach using an intravenous administration of AuNPs in three groups of mice (Fig. 5). The first and the second group had EGFR-positive A431 tumors. The third group was inoculated with EGFR-negative breast adenocarcinoma MDA-MB-435 cell line. The first and the third group were injected with EGFR-targeted AuNPs. In the second group PEGylated AuNPs were administered at the concentration two times higher than that used in the other two groups. Ultrasound and multi-wavelength photoacoustic images of tumor regions were acquired at the same spatial locations before and up to 4 h after administration of AuNPs. Multi-wavelength photoacoustic images were analyzed to identify regions containing endocytosed nanoparticles, oxygenated blood, and deoxygenated blood [28].
Fig. 5.
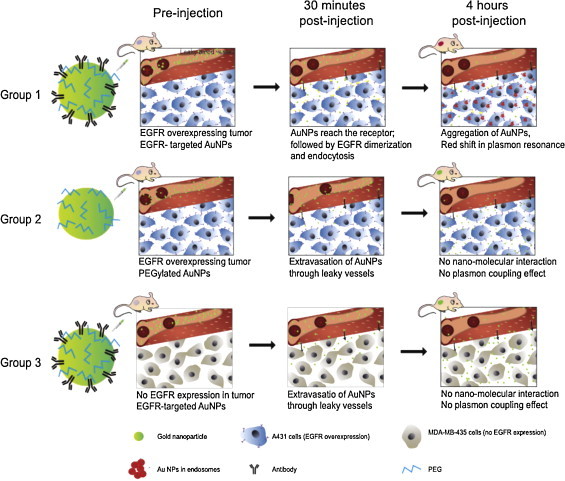
In this study three groups of mice were used. The first and the second group of mice had xenografts of A431 cells that overexpress EGFR. The third group of mice, serving as a control, was inoculated using EGFR-negative MDA-MB-435 cells. The first and the third groups were injected with EGFR-targeted AuNPs. PEGylated AuNPs were administered to the second group. Over time, nanoparticles extravasated into the tumor via the leaky tumor vasculature. Despite significant accumulation of AuNPs in tumor region, no plasmon coupling effect was observed in the tumors from the second and third group. On the other hand, EGFR-targeted AuNPs underwent receptor-mediated aggregation in tumors belonging to the first group of mice. The receptor-mediated aggregation resulted in a strong red-shift in the optical absorption properties of AuNPs.
In all animals (Figs. 6 and 7), the tumor region was easily identified in ultrasound images. Typically, the subcutaneous tumor appears as a hyperechoic region (skin, top of the image) with a hypoechoic area denoting the tumor. In the first group of mice with EGFR-positive tumor and injected with molecular-specific AuNPs, photoacoustic images obtained at 720 nm excitation (Fig. 6a) clearly indicate an increase in the photoacoustic signal over time after administration of EGFR-targeted AuNPs. Similar to results shown in Fig. 4, the photoacoustic images in Fig. 6a show an increase of the photoacoustic signal amplitude over time and, therefore, indicate both successful delivery of the nanoparticles and their receptor-mediated interaction with cancer cells. To identify regions associated with either endogenous (oxy/deoxy-hemoglobin) or exogenous (endocytosed nanoparticles) chromophores, spectroscopic photoacoustic imaging was carried out (Fig. 6b). The images show a heterogeneous distribution of AuNPs in the tumor region that correlated well with viable tumor regions identified in the adjacent H&E stained tissue slices (Fig. 6c). Indeed, the central tumor regions were necrotic (e.g., area outlined by white square in Fig. 6c) while the peripheral areas of the tumor contained viable cells (e.g., area outlined by yellow square in Fig. 6c). Silver stain of gold nanoparticles in tissue slices showed that nanoparticles were present within the entire tumor region (Fig. 6d). However, the observed increase in the photoacoustic signal was localized only to the viable regions of the tumor. This result indicates sensitivity of our method toward the presence of functional EGFR-expressing tumor cells. Fig. 6e and f shows a 3D ultrasound and spectroscopic photoacoustic images of the tumor from an animal in the first group before and 4 h after intravenous injection of EGFR-targeted AuNPs respectively. These 3D images clearly demonstrate that AuNPs did not have a homogeneous distribution in the tumor. The 3D photoacoustic images visualized in context of the anatomical structure of tumor provide us with the functional map of the viable EGFR expressing tumor cells that interacted with the injected molecular specific contrast agent. In this particular tumor, the viable regions are located mostly at the tumor periphery while the necrotic core or the central region of the tumor did not have a detectable PA signal. No increase in the photoacoustic signal at NIR wavelengths was observed in the other two groups after AuNP administration. Spectroscopic photoacoustic images (Fig. 7a and c) do not indicate the presence of endocytosed nanoparticles despite the accumulation of AuNPs in the tumor as shown by silver staining of tissue sections (Fig. 7b and d). The mice in the second group had the EGFR-positive tumor, and the animals were injected with nonspecific PEGylated AuNPs. Consequently, there were no molecular/cellular interactions between PEGylated nanoparticles and tumor cells, and the 720-nm photoacoustic images did not show an increase in photoacoustic response in spite of injecting double the amount of AuNPs in the second group. Finally, the third group of mice had tumors that did not have EGFR expression, and the injected EGFR-targeted AuNPs just extravasated into the tumor but did not undergo any nano-molecular interactions with tumor cells. Therefore, there was no plasmon resonance coupling between the nanoparticles and no change in the photoacoustic signal at 720 nm. The results presented in Figs. 6 and 7 clearly indicate molecular specificity of EGFR-targeted AuNPs and the ability of photoacoustic imaging to visualize depth-resolved nano-molecular interactions in vivo.
Fig. 6.
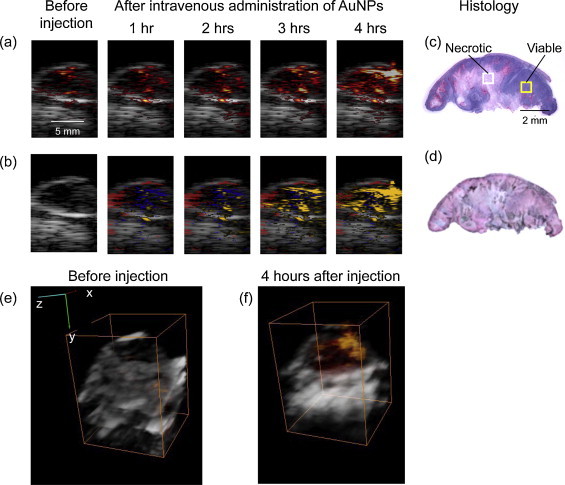
(a) Ultrasound images shown in grayscale overlaid with photoacoustic images obtained at 720 nm before and after I.V. administration of EGFR-targeted AuNPs in mouse with A431 EGFR expressing tumor (Group 1). (b) Multi-wavelength photoacoustic images are pseudo-colored to show oxygenated areas in red, deoxygenated areas in blue, and molecular specific interactions between Au NPs and cancer cells in orange. H&E stain (c) and Silver stain (d) of tumor section taken at the imaging cross-section after injection of AuNPs Dark regions in the silver stained section show the presence of AuNPs. There is a clear time-dependent increase in the photoacoustic signal at 720 nm after I.V injection of EGFR-targeted AuNPs indicating receptor-mediated aggregation of AuNPs in cellular endosomes. The aggregation leads to plasmon resonance coupling between AuNPs that results in a red-shift in optical absorption of the nanoparticles. As photoacoustic signal is proportional to optical absorption of the tissue, a time-dependent increase in photoacoustic signal is observed due to the plasmon resonance coupling effect. 3-D Ultrasound (grayscale) and overlaid photoacoustic images (red scale) of an EGFR-expressing tumor (e) before and (f) 4 h after administration of EGFR-targeted gold nanoparticles. The bounding box represents a 12 mm × 12 mm × 13.3 mm field of view. A heterogeneous distribution of the PA signal associated with receptor-mediated endocytosis of AuNPs in the tumor is clearly visible in (f).
Fig. 7.
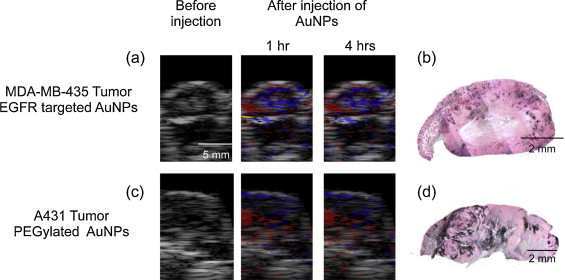
Ultrasound images are shown in grayscale. Multi-wavelength photoacoustic images are pseudo-colored to show oxygenated areas in red, deoxygenated areas in blue, and aggregated Au NPs in orange. The histology sections of the tumors are taken approximately near the imaging cross-section. Dark regions in silver stained sections show presence of AuNPs. The data in (a and b) represent the results obtained for Group 3 mice (MDA-MB-435 tumor, EGFR-targeted AuNPs) and in (c and d) from Group 2 mice (A31 tumors, PEGylated AuNPs). Despite significant accumulation of AuNPs in the tumors, there were no detectable photoacoustic signals at 720 nm due to lack of interactions between the AuNPs and the cancer cells.
To further quantify these results, the photoacoustic signals obtained at 720 nm wavelength illumination in the viable and necrotic regions of the tumor were compared at various time points before and after injection of AuNPs (Fig. 8). In each case, to compensate for the difference in AuNPs uptake between the tumors, 720-nm photoacoustic signals were normalized with photoacoustic signals obtained at 532 nm. Clearly, in the first group (Fig. 8a), the photoacoustic signal in the viable cell region of the tumors increased over time indicating delivery and receptor-mediated interaction of targeted nanoparticles with cancer cells. On the other hand, the necrotic region of the same tumors did not have an increase in the photoacoustic contrast at 720 nm. In groups 2 and 3 (Fig. 8b and c), the photoacoustic signal did not increase over time in either the viable or necrotic regions of the tumors (p-value >0.05).
Fig. 8.
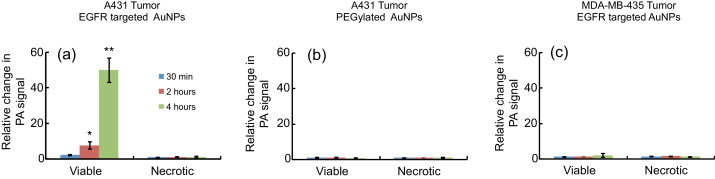
The graphs depicting change in PA signal at 720 nm relative to the photoacoustic signal at 532 nm at 30 min (blue bars), 2 h (red bars), and 4 h (green bars) post I.V injection of AuNPs. The data are summarized from (a) Group 1 mice (A431 tumors, EGFR-targeted AuNPs), (b) Group 2 mice (A431 tumors, PEGylated AuNPs) and (c) Group 3 mice (MDA-MB-435 tumor, EGFR-targeted AuNPs). Only viable regions in Group 1 mice showed an increase in PA signal at 720 nm that is associated with receptor-mediated plasmon resonance coupling of AuNPs. The error bars indicate S.E.M.
Plasmonic nanoparticles with different optical absorption properties can be conjugated to various cancer specific biomarkers such as growth factor receptors and integrins [22,35]. The ultrasound-guided spectroscopic photoacoustic imaging could be used to image the multiplex labeling and interactions of nanoparticles with cancer cells in vivo [28]. Identification of the molecular basis of tumor dissemination is driving drug development to discover or synthesize inhibitors that block key pathways in this process. Ultrasound-guided photoacoustic imaging can aid in understanding the molecular signature of cancers, thus guiding implementation of specific therapeutic procedures specific to a particular tumor. Furthermore, studies have shown that AuNPs are promising phototherapeutic agents. Using our imaging technique, guidance and monitoring of photothermal therapeutic procedures could also be feasible [32,36,37].
4. Conclusion
We demonstrated that molecular targeted AuNPs and spectroscopic photoacoustic imaging has the potential to detect cancer cells in vivo based on their molecular functionality. In particular, EGFR-targeted AuNPs underwent molecular-specific endocytosis leading to plasmon resonance coupling. The phenomena resulted in an increase in optical absorption of AuNPs in the NIR region and hence an increase in the photoacoustic signal. We evaluated feasibility of photoacoustic imaging in detection of plasmon resonance coupling of targeted AuNPs in tumors expressing EGFR. Multi-wavelength photoacoustic images obtained before and after intravenous injection of EGFR-targeted AuNPs clearly showed a significant increase in red-NIR absorption of the tumor region due to formation of AuNP aggregates. Furthermore, we demonstrated 3D capabilities of the imaging system in obtaining molecular signatures of tumor cells.
Conflict of interest statement
The authors state no conflict of interest.
Acknowledgments
Partial support from the National Institutes of Health under grants EB008101 and CA149740 is gratefully acknowledged. The authors would also like to thank the Animal Resource Center at the University of Texas at Austin, the Histology facility at the Research Park at University of Texas Smithville and Ms. Kelsey Kubelick for proof reading the manuscript.
Biographies

Srivalleesha Mallidi received her B.E. in Electronics and Communications Engineering from the Andhra University in India in 2003. She obtained her M.S. and Ph.D. degrees in Biomedical Engineering from the University of Texas at Austin in 2006 and 2009 respectively. Dr. Mallidi master's thesis involved custom designing ultrasound based multi-modality imaging systems while her doctoral work explored the utility of surface plasmon resonance properties of spherical gold nanoparticles for early detection of cancer and probing nano-molecular interactions. After graduation, she joined Wellman Center for Photomedicine at Massachusetts General Hospital, and is currently a NIH Ruth L. Kirschstein postdoctoral fellow. Her research interests are in the fields of ultrasound imaging, photoacoustic imaging, image-guided therapeutics, photodynamic therapy and combination treatments.

Seungsoo Kim received the B.S. and M.S. degrees in Electronic Engineering from the Sogang University, Seoul, Korea in 2005 and 2007, respectively, and received the Ph.D. degree in Biomedical Engineering from the University of Texas at Austin in 2011. His doctorate research was in the area of ultrasound elasticity imaging and photoacoustic imaging. He joined Siemens Medical Solutions USA, Inc. located in Issaquah, WA in 2011 as an ultrasound engineer. He is now working in the area of ultrasound shear wave imaging.

Andrei Karpiouk received his B.S, M.S., and Ph.D. degrees in laser physics from the Moscow Engineering Physics Institute (Technical University), Moscow, Russia, in 1992, 1994, and 2002, respectively. Following his graduate work, Dr. Karpiouk was a postdoctoral fellow in the Laser Center at the University of Texas Medical Branch, Galveston, Texas from 2003 to 2004 and then, from 2004 to 2008, at the University of Texas at Austin, Austin, Texas as a Research Assistant conducting research in combined photoacoustic and ultrasound imaging, laser-tissue interaction processes and development of new methods for ultrasound-based medical imaging and sensing. Currently, Dr. Karpiouk holds the position of Research Engineering/Scientist Associate III in the Department of Biomedical Engineering, the University of Texas at Austin, Austin, TX. His research interests are in multi-modal medical imaging, biomedical device engineering, soft tissues characterization, etc.

Pratixa P. Joshi received her B.E. in Chemical Engineering in 1998 from the Dharamsinh Desai Institute of Technology in Nadiad, Gujarat, and M.S. degree in Chemical Engineering at the University of Oklahoma in 2004. From 2005, she was a Research Associate at the University of Texas Health Science Center at Houston before joining the University of Texas at Austin in 2008. In 2014, she graduated from the University of Texas at Austin with Ph.D. degree in Biomedical Engineering. Dr. Joshi's interests are in development of plasmonic contrast agents for molecular imaging, cell tracking and other clinical applications.

Konstantin Sokolov received Diploma Degree in Physics in 1987 from the Moscow Engineering-Physics Institute and Ph.D. in Biophysics in 1992 from Moscow State University, Russia. He carried out research as a postdoctoral fellow at the Institute of Bioorganic Chemistry Russian Academy of Science, Russia; the University of Reims, France; and Iowa State University, U.S.A. Currently, Dr. Sokolov is a Professor of Imaging Physics at the UT M.D. Anderson Cancer Center. His research is focused on biophotonics and nanotechnology for imaging and therapy of cancer and atherosclerosis.

Stanislav Emelianov received his B.S. and M.S. degrees in physics and acoustics in 1986 and 1989, respectively, and Ph.D. degree in physics in 1993 from Moscow State University, Russia. He is currently a Professor of Biomedical Engineering at The University of Texas at Austin, and an Adjunct Professor of Imaging Physics at The University of Texas M.D. Anderson Cancer Center in Houston. Dr. Emelianov directs the Ultrasound Imaging and Therapeutics Research Laboratory – home to research projects focused on basic science, pre-clinical studies and clinical translation of medical instrumentation, signal/image processing algorithms and imaging contrast/therapeutic agents. Dr. Emelianov's research interests are in the areas of intelligent diagnostic imaging and patient-specific image-guided therapeutics including cancer imaging and diagnosis, the detection and treatment of atherosclerosis, the development of imaging and therapeutic nanoagents, guided drug delivery and controlled release, simultaneous anatomical, functional, cellular and molecular imaging, multi-modal imaging, and image-guided therapy.
References
- 1.Bremer C., Ntziachristos V., Weissleder R. Optical-based molecular imaging: contrast agents and potential medical applications. Eur Radiol. 2003;13:231–243. doi: 10.1007/s00330-002-1610-0. [DOI] [PubMed] [Google Scholar]
- 2.Cassidy P.J., Radda G.K. Molecular imaging perspectives. J R Soc Interface. 2005;2:133–144. doi: 10.1098/rsif.2005.0040. [DOI] [PMC free article] [PubMed] [Google Scholar]
- 3.McLarty K., Reilly R.M. Molecular imaging as a tool for personalized and targeted anticancer therapy. Clin Pharmacol Ther. 2007;81:420–424. doi: 10.1038/sj.clpt.6100096. [DOI] [PubMed] [Google Scholar]
- 4.Pysz M.A., Gambhir S.S., Willmann J.K. Molecular imaging: current status and emerging strategies. Clin Radiol. 2010;65:500–516. doi: 10.1016/j.crad.2010.03.011. [DOI] [PMC free article] [PubMed] [Google Scholar]
- 5.Ntziachristos V. Going deeper than microscopy: the optical imaging frontier in biology. Nat Publ Group. 2010;7:603–614. doi: 10.1038/nmeth.1483. [DOI] [PubMed] [Google Scholar]
- 6.Luker G.D., Luker K.E. Optical imaging: current applications and future directions. J Nucl Med. 2007;49:1–4. doi: 10.2967/jnumed.107.045799. [DOI] [PubMed] [Google Scholar]
- 7.Dhawan A.P., D’Alessandro B., Xiaolei F. Optical imaging modalities for biomedical applications. IEEE Rev Biomed Eng. 2010;3:69–92. doi: 10.1109/RBME.2010.2081975. [DOI] [PubMed] [Google Scholar]
- 8.Balas C. Review of biomedical optical imaging—a powerful, non-invasive, non-ionizing technology for improving in vivo diagnosis. Meas Sci Technol. 2009;20:104020. [Google Scholar]
- 9.Bayer C.L., Luke G.P., Emelianov S.Y. Photoacoustic imaging for medical diagnostics. Acoust Today. 2012;8:15–23. doi: 10.1121/1.4788648. [DOI] [PMC free article] [PubMed] [Google Scholar]
- 10.Luke G.P., Yeager D., Emelianov S.Y. Biomedical applications of photoacoustic imaging with exogenous contrast agents. Ann Biomed Eng. 2011;40:422–437. doi: 10.1007/s10439-011-0449-4. [DOI] [PubMed] [Google Scholar]
- 11.Mallidi S., Luke G.P., Emelianov S.Y. Photoacoustic imaging in cancer detection, diagnosis, and treatment guidance. Trends Biotechnol. 2011;29:213–221. doi: 10.1016/j.tibtech.2011.01.006. [DOI] [PMC free article] [PubMed] [Google Scholar]
- 12.Xu M., Wang L.V. Photoacoustic imaging in biomedicine. Rev Sci Instrum. 2006;77:041101. [Google Scholar]
- 13.Wang B., Su J.L., Karpiouk A.B., Sokolov K.V., Smalling R.W., Emelianov S.Y. Intravascular photoacoustic imaging. IEEE J Quantum Electron. 2010;16:588–599. doi: 10.1109/JSTQE.2009.2037023. [DOI] [PMC free article] [PubMed] [Google Scholar]
- 14.Emelianov S.Y., Li P.C., O’Donnell M. Photoacoustics for molecular imaging and therapy. Phys Today. 2009;62:34. doi: 10.1063/1.3141939. [DOI] [PMC free article] [PubMed] [Google Scholar]
- 15.Wang L.V. Multiscale photoacoustic microscopy and computed tomography. Nat Photon. 2009;3:503–509. doi: 10.1038/nphoton.2009.157. [DOI] [PMC free article] [PubMed] [Google Scholar]
- 16.Sethuraman S., Amirian J.H., Litovsky S.H., Smalling R.W., Emelianov S.Y. Spectroscopic intravascular photoacoustic imaging to differentiate atherosclerotic plaques. Opt Express. 2008;16:3362–3367. doi: 10.1364/oe.16.003362. [DOI] [PubMed] [Google Scholar]
- 17.Wang B., Su J.L., Amirian J., Litovsky S.H., Smalling R., Emelianov S.Y. Detection of lipid in atherosclerotic vessels using ultrasound-guided spectroscopic intravascular photoacoustic imaging. Opt Express. 2010;18:4889–4897. doi: 10.1364/OE.18.004889. [DOI] [PMC free article] [PubMed] [Google Scholar]
- 18.Sethuraman S., Amirian J.H., Litovsky S.H., Smalling R.W., Emelianov S.Y. Ex vivo characterization of atherosclerosis using intravascular photoacoustic imaging. Opt Express. 2007;15:16657–16666. doi: 10.1364/oe.15.016657. [DOI] [PubMed] [Google Scholar]
- 19.Kim C., Favazza C., Wang L.V. In vivo photoacoustic tomography of chemicals: high-resolution functional and molecular optical imaging at new depths. Chem Rev. 2010;110:2756–2782. doi: 10.1021/cr900266s. [DOI] [PMC free article] [PubMed] [Google Scholar]
- 20.Yang X., Stein E.W., Ashkenazi S., Wang L.V. Nanoparticles for photoacoustic imaging. Wiley Interdiscip Rev: Nanomed Nanobiotechnol. 2009;1:360–368. doi: 10.1002/wnan.42. [DOI] [PubMed] [Google Scholar]
- 21.Mallidi S., Larson T., Aaron J., Sokolov K., Emelianov S. Molecular specific optoacoustic imaging with plasmonic nanoparticles. Opt Express. 2007;15:6583–6588. doi: 10.1364/oe.15.006583. [DOI] [PubMed] [Google Scholar]
- 22.Li P.-C., Wang C.-R.C., Shieh D.-B., Wei C.-W., Liao C.-K., Poe C. In vivo photoacoustic molecular imaging with simultaneous multiple selective targeting using antibody-conjugated gold nanorods. Opt Express. 2008;16:18605–18615. doi: 10.1364/oe.16.018605. [DOI] [PubMed] [Google Scholar]
- 23.Urano Y.Y. Novel live imaging techniques of cellular functions and in vivo tumors based on precise design of small molecule-based ‘Activatable’ fluorescence probes. Curr Opin Chem Biol. 2012;16:602–608. doi: 10.1016/j.cbpa.2012.10.023. [DOI] [PubMed] [Google Scholar]
- 24.Kobayashi H.H., Choyke P.L.P.L. Target-cancer-cell-specific activatable fluorescence imaging probes: rational design and in vivo applications. Acc Chem Res. 2011;44:83–90. doi: 10.1021/ar1000633. [DOI] [PMC free article] [PubMed] [Google Scholar]
- 25.Weissleder R., Pittet M.J. Imaging in the era of molecular oncology. Nature. 2008;452:580–589. doi: 10.1038/nature06917. [DOI] [PMC free article] [PubMed] [Google Scholar]
- 26.Sokolov K., Follen M., Aaron J., Pavlova I., Malpica A., Lotan R. Real-time vital optical imaging of precancer using anti-epidermal growth factor receptor antibodies conjugated to gold nanoparticles. Cancer Res. 2003;63:1999–2004. [PubMed] [Google Scholar]
- 27.Aaron J.S., Nitin N., Travis K., Kumar S., Collier T., Park S.Y. Plasmon resonance coupling of metal nanoparticles for molecular imaging of carcinogenesis in vivo. J Biomed Opt. 2007;12:034007. doi: 10.1117/1.2737351. [DOI] [PubMed] [Google Scholar]
- 28.Mallidi S., Larson T., Tam J., Joshi P.P., Karpiouk A., Sokolov K. Multiwavelength photoacoustic imaging and plasmon resonance coupling of gold nanoparticles for selective detection of cancer. Nano Lett. 2009;9:2825–2831. doi: 10.1021/nl802929u. [DOI] [PMC free article] [PubMed] [Google Scholar]
- 29.Sokolov K., Aaron J., Hsu B., Nida D., Gillenwater A., Follen M. Optical systems for in vivo molecular imaging of cancer. Technol Cancer Res Treat. 2003;2:491–504. doi: 10.1177/153303460300200602. [DOI] [PubMed] [Google Scholar]
- 30.Kumar S., Aaron J., Sokolov K. Directional conjugation of antibodies to nanoparticles for synthesis of multiplexed optical contrast agents with both delivery and targeting moieties. Nat Protoc. 2008;3:314–320. doi: 10.1038/nprot.2008.1. [DOI] [PubMed] [Google Scholar]
- 31.Aaron J., Travis K., Harrison N., Sokolov K. Dynamic imaging of molecular assemblies in live cells based on nanoparticle plasmon resonance coupling. Nano Lett. 2009;9:3612–3618. doi: 10.1021/nl9018275. [DOI] [PMC free article] [PubMed] [Google Scholar]
- 32.Kim S., Chen Y.-S., Luke G.P., Emelianov S.Y. In vivo three-dimensional spectroscopic photoacoustic imaging for monitoring nanoparticle delivery. Biomed Opt Express. 2011;2:2540–2550. doi: 10.1364/BOE.2.002540. [DOI] [PMC free article] [PubMed] [Google Scholar]
- 33.Prahl, S. http://omlc.org/spectra/hemoglobin/.
- 34.Perrault S.D., Chan W.C.W. In vivo assembly of nanoparticle components to improve targeted cancer imaging. Proc Natl Acad Sci U S A. 2010;107:11194–11199. doi: 10.1073/pnas.1001367107. [DOI] [PMC free article] [PubMed] [Google Scholar]
- 35.Bayer C.L., Chen Y.-S., Kim S., Mallidi S., Sokolov K., Emelianov S. Multiplex photoacoustic molecular imaging using targeted silica-coated gold nanorods. Biomed Opt Express. 2011;2:1828–1835. doi: 10.1364/BOE.2.001828. [DOI] [PMC free article] [PubMed] [Google Scholar]
- 36.Shah J., Aglyamov S.R., Sokolov K., Milner T.E., Emelianov S.Y. Ultrasound imaging to monitor photothermal therapy: feasibility study. Opt Express. 2008;16:3776–3785. doi: 10.1364/oe.16.003776. [DOI] [PubMed] [Google Scholar]
- 37.Shah J., Park S., Aglyamov S., Larson T., Ma L., Sokolov K. Photoacoustic imaging and temperature measurement for photothermal cancer therapy. J Biomed Opt. 2008;13:034024. doi: 10.1117/1.294036. [DOI] [PMC free article] [PubMed] [Google Scholar]