

Abstract
The human mammary gland is capable of de novo synthesis of glucose and galactose (hexoneogenesis); however, the carbon source is incompletely understood. In this study, we investigated the role of acetate, glutamine, lactate and glycerol as potential carbon sources for hexoneogenesis. Healthy breastfeeding women were studied following a 24-h fast on two occasions separated by 1–3 wk. Five women were infused with [U-13C]lactate or [1,2-13C2]glutamine and five women with [U-13C]glycerol or [1,2-13C2]acetate. Enrichments of 13C in plasma and milk substrates were analyzed using GC-MS. Infusion of labeled lactate, glycerol, glutamine, and acetate resulted in plasma glucose being 22.0 ± 3.7, 11.2 ± 1.0, 2.5 ± 0.5, and 1.3 ± 0.2% labeled, respectively. Lactate, glutamine, or acetate did not contribute to milk glucose or galactose (0–2%). In milk, 13C-free glycerol enrichment was one-fourth that in plasma but free glycerol concentration in milk was fourfold higher than in plasma. Using [U-13C]glycerol and by accounting for tracer dilution, glycerol alone contributed to 10 ± 2 and 69 ± 11% of the hexoneogenesis of milk glucose and galactose, respectively. During [U-13C]glycerol infusion, the ratio of M3 enrichment on 4–6 carbons/M3 on 1–3 carbons of galactose was higher (P < 0.05, 1.22 ± 0.05) than those of glucose in plasma (1.05 ± 0.03) and milk (1.07 ± 0.02). Reanalysis of samples from a previous study involving [U-13C]glucose infusion alone suggested labeling a portion of galactose consistent with pentose phosphate pathway (PPP) activity. We conclude that, although lactate contributed significantly to gluconeogenesis, glycerol alone provides the vast majority of substrate for hexoneogenesis. The relative contribution of the PPP vs. the reversal Embden-Meyerhof pathway to hexoneogenesis within the human mammary gland remains to be determined.
Keywords: galactose, lactose synthesis, gluconeogenesis, pentose phosphate pathway, stable isotopes GC-MS
we previously demonstrated (26) that plasma glucose is the predominant but not the exclusive carbon source of milk lactose (80% during the fed state and 60% following 24 h of fasting). Thus, the mammary gland is capable of de novo synthesis of glucose and galactose, a process we termed hexoneogenesis. During feeding, hexoneogenesis contributes 20% of the carbon in lactose (10 and 30% of glucose and galactose, respectively) (20, 26, 27). Over a 14- to 42-h fast, hexoneogenesis increases to account for ∼40% of lactose production (∼30% of glucose and ∼50% of galactose) (18, 20, 21, 26, 27). However, the precursor carbon source for hexoneogenesis remains largely unknown.
We hypothesize that those traditional gluconeogenic substrates for hepatic glucose production will also serve as precursors for hexoneogenesis. Lactate, a predominant gluconeogenic precursor in humans, accounts for 50–70% of the total gluconeogenic flux in normal humans (3, 12). Another significant precursor of glucose synthesis (particularly in the kidney) is glutamine, which together with glutamic acid are the most abundant amino acids in the body (7) and in breast milk, since together they constitute 20% of total amino acids (5).
We (26) previously reported that glycerol (using [2-13C]glycerol) contributed 14% to the production of galactose synthesized within the mammary gland but little or none to glucose in lactose. We (17) and others (10, 11, 14, 15, 23, 30) have reported that in humans and other mammalian species the mammary gland is an exceptionally active organ in metabolizing triglycerides and fatty acids. As a consequence, the release of glycerol secondary to the transport and hydrolysis of plasma triglycerides could provide substantial substrate for hexoneogenesis. However, in our previous study we did not account for the potential dilution of the glycerol tracer within the mammary gland (17) as a result of glycerol derived from hydrolysis of triglycerides. This dilution most likely leads to an underestimation of the fraction of hexoneogenesis from glycerol.
Accordingly, the present study was undertaken to determine the contributions of lactate, glutamine, and glycerol to the process of hexoneogenesis in fasted lactating women. We used labeled acetate to control for the incorporation of 13CO2 derived from the oxidation of [13C2]acetate into glucose and galactose. We chose to perform these studies in the fasting state, in which the hexoneogenesis represents ∼50% of lactose.
MATERIALS AND METHODS
Materials
β-Galactosidase (Escherichia coli, grade VIII, 740,000 U/g), BaOH (0.3 N), ZnSO4 (0.3 N), 1-propanol, NH4OH, acetyl chloride, and HFBA were purchased from Sigma-Aldrich (St. Louis, MO). [1-13C]glucose (99% 13C), [1,2-13C2]glucose (99% 13C), [1–3-13C3]glucose (99% 13C), [4–6-13C3]glucose (99% 13C), [U-13C6]glucose (99% 13C), [1-13C]galactose (99% 13C), [1,2-13C2]galactose (99% 13C), [1-13C]lactate (99% 13C), [1-13C]glutamine (98% 13C), [U-13C]lactate (99% 13C), [1,2-13C2]glutamine (98% 13C), [U-13C]glycerol (99% 13C), [2H5]glycerol (99% 2H), [U-13C]acetate (99% 13C), and [2H3]acetae (99% 2H) were purchased from Cambridge Isotope Laboratory (Andover, MA). 10% TCA was purchased from VWR International (West Chester, PA), AG-50W-X8 resin from Bio-Rad Laboratories (Hercules, CA) and ethyl acetate from Burdick & Jackson (Muskego, MI).
Study and Protocol Design
Subjects
The study was approved by the Institutional Review Board for Human Subject Research at Baylor College of Medicine and the General Clinical Research Center (GCRC) in Houston, TX. Subjects were studied following obtaining written consent. Subjects had to be of normal weight, healthy, 6–12 wk post partum, and exclusively breastfeeding a healthy normal infant. Six to 12 wk postpartum was selected since the uterus has involuted, lactation is well established, the mothers are comfortable with breastfeeding and breast pumping, and the infants have thoroughly adapted to exclusive breastfeeding. For the lactate and glutamine studies, five normal lactating women (27 ± 2 yr, 68 ± 3 kg, and BMI 26 ± 1 kg/m2) were enrolled, whereas for the glycerol and acetate studies five additional normal lactating women (29 ± 2 yr, 66 ± 4 kg, and BMI 26 ± 1 kg/m2) were enrolled. Previously published data (26) from six normal women (27 ± 3 yr, 69 ± 5 kg, and BMI 26 ± 3 kg/m2)were utilized for comparison. The studies were done at a window of 6–12 wk post partum. All of the volunteers underwent a general physical examination and had normal hemoglobin and screening studies for liver and renal function and a negative pregnancy test before being accepted into the study. One set of subjects was infused with [U-13C]lactate on one occasion, and [1,2-13C2]glutamine on the other. The other set of subjects was infused with [U-13C]glycerol on one occasion and [1,2-13C2]acetate on the other. For any individual, the studies were separated by 1–3 wk, and the infusions of specific labeled substrates were performed in a random order.
Additionally, breast milk and plasma samples derived from previous published studies (19, 20) were analyzed for isotopomer distributing analysis under similar study conditions except that these studies were preceded by a 7-day high-carbohydrate/low-fat diet (HC) or low-carbohydrate/high-fat diet (HF) and the subject received an infusion of only [U-13C]glucose during 12- to 14-h fasting (19, 20).
Study Protocols
The subjects were instructed to consume a diet containing ∼50% carbohydrate, ∼15% protein, and ∼35% fat a week prior to admission. The subject and her infant were admitted to the GCRC on the evening prior to the study. Baseline blood and breath samples were obtained. At 6:00 PM, and they were fed a supper meal (10 kcal/kg) having the same macronutrient distribution as prior to study. They were subsequently fasted, except for water, until the end of the study, at 6:00 PM the next day.
At midnight, three intravenous catheters were introduced into the mother's antecubital fossa or forearm vein under Ela-Max cream analgesia (Ferndale Laboratories, Ferndale, MI), one for isotope infusion, one for blood sampling in the contralateral arm, and one for back-up for blood sampling in the same arm. The veins were kept open by the slow infusion of 0.9% NaCl. Beginning at midnight, the subjects received a constant infusion of either [U-13C]lactate (0.43 ± 0.02 μmol·kg−1·min−1) or [1,2-13C2]glutamine (0.27 ± 0.01 μmol·kg−1·min−1), to achieve a desired enrichment of ∼5% in the circulating plasma pool. In the glycerol and acetate studies, the subjects received a constant infusion of either [U-13C]glycerol (0.24 ± 0.01 μmol·kg−1·min−1) or [U-13C2]acetate (0.52 ± 0.01 μmol·kg−1·min−1), with a desired enrichment of 5–10% in the circulating plasma pool.
The subjects breastfed their infants from both breasts at ∼3-h intervals, after which, milk (2.5 ml) was collected from both breasts simultaneously using a standard electric breast pump (Playtex Embrace, Dover, DE) into sterile milk bottles (Ross Products, Columbus, OH). The infants were weighed using an electronic scale (Scale-tronix Pediatric Scale 4802, Wheaton, IL) before and immediately after breastfeeding to determine the volume of milk ingested according to Neville et al. (22). Indirect calorimetry was performed every 3 h until the end of the study. Blood (6 ml) and breath samples were collected before starting the infusion and subsequently every 3 h from 3:00 AM to 3:00 PM and then hourly during the last 3 h of the study. Samples were immediately placed on ice. Blood samples were centrifuged at 3,000 rpm for 10 min at 4°C, and the plasma was separated and transferred to a new vial and then stored at −80°C until further analyses. In addition, an aliquot of blood was immediately centrifuged and analyzed for plasma glucose at bedside, using the Biochemical Analyzer, model 2700 Select (Yellow Springs Instruments, Yellow Springs, OH; YSI). Milk samples from both breasts were combined, and a 2.5-ml aliquot was transferred to a new tube and stored at −80°C. Breath samples were collected by facemask through a one-way Phillips valve into a sealed 3-L anesthesia bag, immediately aspirated into 10-ml vacuum tubes, and stored at room temperature until analysis. At the end of the study, the subjects were given a light meal and were then discharged from the GCRC. The protocol using [2-13C]glycerol infusion is published elsewhere (27).
Analytic Methods
Substrate concentration.
Glucose, lactose, and lactate in milk and plasma were determined as previously reported (20). Milk protein and fat concentrations were measured as previously reported (21). Free glycerol and acetate concentrations in milk and plasma were measured using reverse isotope dilution methodology employing [2H5]glycerol and [2H3]acetate as internal standards (19).
Isotopic enrichments.
All measurements were made in the Stable Isotope Core Laboratory of the Children's Nutrition Research Center (CNRC). Enrichments of 13C in the glucose isotopomers in plasma and milk were performed using the acetic anhydride derivative (26). To investigate the position and distribution of 13C labeling on plasma and milk hexoses during both lactate and glycerol infusions, the optimized aldonitrile pentaacetate derivative using GC-MS and standards of 13C3-labeled glucose (1–3-13C3 and 4–6-13C3) was utilized (2). The analyses were performed using SP17-1 capillary columns, and conditions for the GC-MS were as follows: temperature program 70°C for 1 min, a temperature ramp at 25°C/min up to 320°C followed by a 6-min hold, monitoring in the EI mode for ions of m/z 242–245 allowing detection of the incorporation of 13C into 1–3 carbons, while m/z 217–220 to detect the incorporation of 13C into 4–6 carbons. The triacetate derivative of free glycerol in plasma and milk was prepared using acetic anhydride as described previously (19). Additionally, breast milk triglycerides were hydrolyzed using alkaline saponification (17) and total glycerol enrichments, and concentrations were measured (26). The pentafluorobenzyl-acetyl derivative of lactate was analyzed for the isotopic enrichments of [U-13C]lactate in both plasma and milk by GC-MS using an HP-5 capillary column, monitoring for ions of m/z 131–134 in the NCI mode (19). The conditions for the GC-MS were as follows: temperature program 70°C for 1 min and a temperature ramp at 15°C/min up to 320°C followed by a 2-min hold. The heptafluorobutyric acid derivative of glutamine was analyzed for the isotopic enrichment of [1,2-13C2]glutamine using an HP-5 capillary column, monitoring for ions of m/z 346–348 on the NCI mode. For the determination of milk glutamine enrichments, defatted and deproteinized samples were run through an AG-50W resin column prior to esterification and derivatization. Enrichments of acetate in plasma and milk were performed using the PFB derivative as has been described (19). We encountered problems in detecting 13C enrichments in milk acetate; accordingly, the M2 enrichment of lauric acid (C12:0) was measured as described (19) and was used as a surrogate for acetate enrichment in milk (after being divided by 6, i.e., number of acetate units in C12:0 FA) (19).
Calculations
We utilized the same calculations employed for the calculation of hexoneogenesis derived from glycerol during infusion of [2-13C]glycerol under fasting conditions (26).
Standard product precursor relationships were calculated. The percentage of product, i.e., glucose and galactose in milk lactose, that was derived from the precursor pool (plasma glucose), was calculated using the following equation (Eq. 1):
| (1) |
where milk sugar is either the glucose or the galactose moiety in lactose. [M6] enrichments are derived from the infusion of [M6]glucose tracer (26).
The contribution from glycerol to milk glucose and galactose produced from other sources than plasma glucose via processes within the breast (%milk sugar ⇐ glycerol) was calculated using Eq. 2:
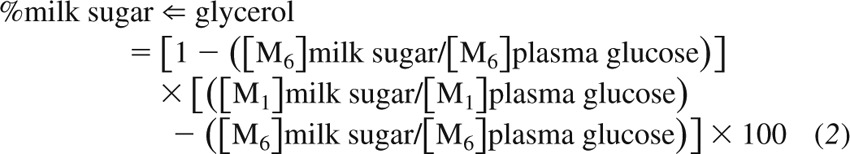 |
[M1] ratios > [M6] ratios indicate a contribution from glycerol.
However, in this model, the dilution of glycerol in the milk pool was not accounted for. Accordingly, Eq. 3:
| (3) |
The same procedures have been applied for different tracer studies under these investigations. For studies utilizing [U-13C]lactate and [U-13C]glycerol, [M1] in plasma or milk sugar is replaced by [M3] in plasma or milk sugar. The values of [M6] plasma glucose or milk glucose has been used from our previous study(26). The dilution is based on plasma or milk sugar [M3] of either lactate or glycerol in plasma and milk compartments. The same has been applied for studies of [1,2-13C2]glutamine and [U-13C]acetate, with the exception that [M2] has been used instead of [M1].
Additionally, we used the following model (total 13C model) for the estimating the percent contribution of labeled substrate into glucose in systemic circulation (i.e., via gluconeogenesis).
During lactate infusion, the percentage of product, i.e., glucose in plasma that was derived from the precursor pool i.e., plasma lactate,
| (4) |
where M1, M2, and M3 are the enrichments of the plasma glucose and lactate isotopomers ([M1], [M2], and [M3], respectively) as calculated using the matrix (9), and 6 and 3 are the numbers of carbons in glucose and lactate molecules, respectively.
We applied the same model and principles for glycerol during the infusion of [U-13C]glycerol as a precursor for plasma glucose. We also used a similar approach for glutamine and acetate, with the exception that glutamine and acetate have 5 and 2 carbons (not 3 as in case of lactate and glycerol).
The total rate of appearance (Ra total) and oxidation rates of different substrates during different infusions have been obtained using standard formulae described for glucose previously (27).
Statistical Analyses
Substrate concentrations and the enrichment data from each subject were averaged for the last 6 h of the infusion (18–24 h of fasting). All data are expressed as means ± SE. Substrate concentrations, rates of appearance, enrichments, and contributions to gluconeogenesis and hexoneogenesis were compared using paired Student's t-test (within the same subjects) and/or nonpaired Student's t-test (between subjects) using SPSS program. Significance was set as P < 0.05.
RESULTS
Milk Production and Composition
We have generated quantitative data from the women who were studied in the glycerol/acetate infusions. Among these five women, milk volume ranged between 600 and 1,040 ml/day with an average of 862 ± 90 ml/day. Milk composition expressed as concentration (g/dl) and production (g/feeding) of macronutrients of lactose, fat, and proteins during the 24-h stay at the GCRC are depicted in Fig. 1. All measured parameters, except for lactose concentration, decreased slightly over the fast duration (repeated-measures ANOVA, P < 0.05). Additionally, we found a very strong relationship between daily milk volume and daily lactose production among these five women (r = 0.99), supporting the hypothesis that lactose production is a primary determinant of milk volume.
Fig. 1.

Milk volume and macronutrients (lactose, fat, and protein) concentration (g/dl) and production (g/feeding) over the studied day of inpatient at the GCRC. Data are derived from the 5 women who were studied during labeled glycerol and acetate infusions. Data for each of the 5 women were averaged for the 2 days of studies. Except for milk lactose concentration, all other measured parameters decreased with fasting duration (P by repeated-measures ANOVA < 0.05).
[1,2-13C2]acetate infusion.
During the infusion of [1,2-13C2]acetate, the enrichment of M2 acetate in plasma was 7.94 ± 0.36 whereas that estimated in milk (as derived from the enrichment of milk lauric acid) was 2.88 ± 0.29%, (Table 1). Systemic acetate Ra was 6.5 ± 0.3 μmol·kg−1·min−1, 60 ± 2% of which was oxidized. The M2 enrichments of plasma glucose and milk glucose and galactose were 0.13 ± 0.02, 0.07 ± 0.01 and 0.07 ± 0.01%. Enrichment of M1 of plasma glucose and milk glucose and galactose were three- to sixfold higher than that of their respective M2 value (Table 1). Lactate concentrations in plasma were about sevenfold higher in plasma than those in milk (780 ± 170 vs. 120 ± 65 μmol/l, P < 0.01).
Table 1.
Isotopomer distribution analysis (%) and 13C enrichment (atom%) of different substrate and product during different infusion studies
| [2-13C1]glycerol | [U-13C3]glycerol | [U-13C3]lactate | [1,2-13C2]glutamine | [1,2-13C2]acetate | |
|---|---|---|---|---|---|
| Plasma substrate | |||||
| M1 | 25.9 ± 3.5 | 0.17 ± 0.08 | 0.20 ± 0.04 | 0.27 ± 0.01 | 0.08 ± 0.03 |
| M2 | ND | 0.24 ± 0.03 | 0.16 ± 0.03 | 6.35 ± 0.39 | 7.94 ± 0.36 |
| M3 | ND | 5.76 ± 0.85 | 1.99 ± 0.20 | ND | ND |
| 13C | ND | 5.98 ± 0.87 | 2.17 ± 0.22 | 2.60 ± 0.16 | 7.94 ± 0.36 |
| Milk substrate | |||||
| M1 | 6.2 ± 0.7 | 0.09 ± 0.02 | 0.17 ± 0.02 | 0.29 ± 0.05 | 0.01 ± 0.01 |
| M2 | ND | 0.15 ± 0.03 | 0.14 ± 0.02 | 5.58 ± 0.47 | 2.88 ± 0.29 |
| M3 | ND | 1.55 ± 0.25 | 1.29 ± 0.13 | ND | ND |
| Plasma glucose | |||||
| M1 | 7.26 ± 0.70 | 0.25 ± 0.12 | 0.55 ± 0.10 | 0.23 ± 0.07 | 0.34 ± 0.05 |
| M2 | ND | 0.24 ± 0.03 | 0.63 ± 0.13 | 0.08 ± 0.01 | 0.13 ± 0.02 |
| M3 | ND | 0.87 ± 0.04 | 0.37 ± 0.08 | ND | ND |
| 13C | ND | 0.87 ± 0.04 | 0.49 ± 0.10 | 0.06 ± 0.01 | 0.10 ± 0.01 |
| Milk glucose | |||||
| M1 | 4.97 ± 0.64 | 0.16 ± 0.04 | 0.46 ± 0.11 | 0.25 ± 0.05 | 0.24 ± 0.03 |
| M2 | ND | 0.25 ± 0.02 | 0.42 ± 0.12 | 0.06 ± 0.01 | 0.07 ± 0.01 |
| M3 | ND | 0.74 ± 0.05 | 0.23 ± 0.06 | ND | ND |
| Milk galactose | |||||
| M1 | 5.97 ± 0.64 | 0.18 ± 0.06 | 0.50 ± 0.09 | 0.23 ± 0.05 | 0.25 ± 0.02 |
| M2 | ND | 0.29 ± 0.03 | 0.50 ± 0.11 | 0.04 ± 0.00 | 0.07 ± 0.01 |
| M3 | ND | 0.77 ± 0.05 | 0.25 ± 0.04 | ND | ND |
| Breath CO2 | |||||
| 13CO2 | ND | 0.27 ± 0.02 | 0.48 ± 0.03 | 0.24 ± 0.01 | 0.50 ± 0.02 |
Values are means ± SE.
ND, not determined.
According to either Eq. 2 or Eq. 3, acetate contributed nothing to hexoneogenesis within the mammary gland (Fig. 2). Utilizing the total 13C model (Eq. 4), acetate contributed to an estimate of 1.3 ± 0.2% of total glucose appearing in the circulation.
Fig. 2.

Contribution of different substrates to hexoneogenesis (%) utilizing our previous isotopic model (Eq. 2, left) and when we accounted for tracer dilution within the mammary gland (Eq. 3, right). Values are means ± SE; n = 5 women in each different substrate study except for the historical [2-13C1]glycerol, in which n = 6.
[U-13C3]lactate infusion.
During the infusion of [U-13C]lactate, the M3 enrichment of lactate in plasma and milk were 1.99 ± 0.2 and 1.29 ± 0.13%, respectively (Table 1). Systemic lactate Ra in plasma was 20 ± 2 μmol·kg−1·min−1, of which 49 ± 3% was oxidized. The M3 enrichments of plasma glucose and milk glucose and galactose were 0.38 ± 0.08, 0.23 ± 0.06, and 0.25 ± 0.04%, respectively. However, M1 and M2 enrichments of plasma glucose and milk glucose and galactose were 1.5–2.5 times higher (P < 0.05) than those of their respective M3 values (Table 1). According to the analyses of aldonitrile pentaacetate derivative of hexoses, the ratio of 13C carbon enrichment of the major isotopomer (M2) on the first three carbons (1–3)/M2 on the second three carbons (4–6) in plasma glucose, milk glucose, and milk galactose were essentially identical (P > 0.05; 1.06 ± 0.13, 1.05 ± 0.12 and 1.01 ± 0.13, respectively).
According to either Eq. 2 or Eq.3, lactate contributed essentially nothing (−1 ± 1% of glucose and 2 ± 1% galactose) to hexoneogenesis within the mammary gland (Fig. 2). Utilizing the total 13C model (Eq. 4), lactate contributed to an estimate of 22 ± 4 of total glucose appearing in the circulation.
[1,2-13C2]glutamine infusion.
During the infusion of [1,2-13C2]glutamine, the M2 enrichment of glutamine in plasma and milk were 6.35 ± 0.39 and 5.58 ± 0.47%, respectively (Table 1). Systemic glutamine Ra was 4.2 ± 0.2 μmol·kg−1·min−1, 62 ± 4% of which was oxidized. The M2 enrichment of plasma glucose and milk glucose and galactose were 0.06 ± 0.01, 0.06 ± 0.01, and 0.05 ± 0.01%, respectively, and were three- to fourfold lower (P < 0.05) than their respective M1 values (Table 1).
As with acetate and lactate (using Eqs. 2 or 3), glutamine contributed essentially nothing (0.3 ± 2.1% of glucose and 1.4 ± 1.2% galactose) to hexoneogenesis within the mammary gland (Fig. 2). Utilizing the total 13C model (Eq. 4), glutamine contributed to 2.5 ± 0.5 of total glucose appearing in the circulation.
[U-13C]glycerol infusion.
During the infusion of [U-13C]glycerol, the M3 enrichments of free glycerol in plasma and milk were 5.76 ± 0.85 and 1.55 ± 0.25%, respectively (Table 1). The enrichment of M3 glycerol in hydrolyzed milk during the last 6 h of infusion was 1.45 ± 0.30 and did not differ from that of free milk glycerol (P > 0.05). Plasma free glycerol concentration was ∼20% of that of free milk glucose (103 ± 22 vs. 470 ± 50 μmol/l, P < 0.01). However, the concentration of total milk glycerol was ∼25 ± 4 mmol/l (i.e., ∼200- and ∼50-fold higher than free glycerol in plasma and milk, respectively).
Systemic glycerol Ra was 5.5 ± 0.9 μmol·kg−1·min−1, 47 ± 3% of which was oxidized. The M3 enrichment of plasma glucose and milk glucose and galactose were 0.87 ± 0.04, 0.74 ± 0.05, and 0.77 ± 0.05%, respectively and were four to five times higher than their respective M1 or M2 values (Table 1). According to the analyses of aldonitrile pentaacetate derivative of hexoses, the ratio of M3 enrichment on the second three carbons (4–6)/M3 on the first three carbons (1–3) on the galactose molecule was significantly higher (P < 0.05; 1.22 ± 0.05) than those in plasma glucose (1.05 ± 0.03) and milk glucose (1.07 ± 0.02).
With Eq. 2, glycerol contributed 3 ± 1% of glucose and 18 ± 2% of galactose synthesized de novo within the mammary gland (Fig. 2). Utilizing the dilution factor (M3 glycerol in plasma/M3 glycerol in milk, Eq. 3), glycerol contributed 10 ± 2 and 69 ± 8% to hexoneogenesis of milk glucose and galactose, respectively. Utilizing the total 13C model (Eq. 4), glycerol contributed to 11 ± 1 of total glucose appearing in the circulation.
[2-13C1]glycerol infusion.
During the infusion of [2-13C]glycerol (our previously published study, Ref. 20), the M1 enrichments of glycerol in plasma and milk were enriched to 25.9 ± 3.5 and 6.2 ± 0.7%, respectively (Table 1). Ra systemic glycerol reached 6.4 ± 1 μmol·kg−1·min−1. The M1 enrichment of plasma glucose and milk glucose and galactose were 7.3 ± 0.7, 4.9 ± 0.6, and 6.0 ± 0.6%, respectively (Table 1). Using Eq. 2, glycerol contributed −1 ± 1% of glucose and 15 ± 2% of galactose synthesized within the mammary gland (Fig. 2). However, utilizing the dilution factor (M1 glycerol in plasma/M1 glycerol in milk, Eq. 3), glycerol contributed −4 ± 3 and 65 ± 7% to hexoneogenesis of milk glucose and galactose in lactose, respectively (Fig. 2).
[U-13C]glucose infusion.
From our pervious study of an infusion of [U-13C]glucose alone following an overnight fast on both high-carbohydrate and high-fat diets (19, 20), the mass isotopomer distribution analyses (MIDA) utilizing the pentaacetate derivative of plasma and milk hexoses indicated lower (P < 0.01) M6 but higher (P < 0.05) M1, M2, M3, and M4 in galactose compared with glucose in either plasma or milk (Table 2).
Table 2.
Mass isotopomer distribution analysis (MIDA) of plasma glucose and milk hexoses during infusion of [U-13C]glucose alone in lactating women (n = 7) following an overnight fast
| M1 | M2 | M3 | M4 | M5 | M6 | |
|---|---|---|---|---|---|---|
| Low-carbohydrate/high-fat diet | ||||||
| Plasma glucose | 0.95 ± 0.07a | 0.72 ± 0.01a | 0.65 ± 0.02a | 0.05 ± 0.01a | −0.01 ± 0.01a | 8.03 ± 0.16a |
| Milk glucose | 0.43 ± 0.02b | 0.38 ± 0.03b | 0.33 ± 0.02b | 0.03 ± 0.01a | 0.01 ± 0.00a | 5.03 ± 0.37b |
| Milk galactose | 1.18 ± 0.07c | 1.18 ± 0.08c | 1.12 ± 0.06c | 0.38 ± 0.03b | 0.02 ± 0.00a | 3.70 ± 0.28c |
| High-carbohydrate/low-fat diet | ||||||
| Plasma glucose | 0.80 ± 0.11a | 0.55 ± 0.04a | 0.66 ± 0.04a | 0.05 ± 0.01a | 0.00 ± 0.01a | 7.08 ± 0.12a |
| Milk glucose | 0.41 ± 0.04b | 0.34 ± 0.03b | 0.38 ± 0.03b | 0.03 ± 0.01b | 0.00 ± 0.01a | 4.74 ± 0.30b |
| Milk galactose | 1.27 ± 0.11c | 1.17 ± 0.07c | 1.37 ± 0.06c | 0.34 ± 0.03c | 0.03 ± 0.01a | 3.34 ± 0.24c |
Values are means ± SE. Different letter within the same column during each diet indicates significance (P paired t-test < 0.05). Mn is the molar enrichment (%) of isotopomer n, where n = 1–6, and reflects the number of 13C atoms in the hexose molecule regardless of the position on the carbon chain.
DISCUSSION
Our present study demonstrated that glycerol is an important source for systemic gluconeogenesis but a primary source of substrate for mammary gland hexoneogenesis. Using our previous isotopic model (26), the results of de novo synthesis of galactose during [U-13C]glycerol infusion are comparable to those we previously reported using [2-13C]glycerol (18 ± 2 vs. 14 ± 2%, respectively, NS). The ratios of the milk to plasma glycerol enrichments (4.3 ± 0.5 and 4.1 ± 0.8, respectively) were essentially identical, and the free milk concentrations four- to fivefold higher in milk than in plasma, in both studies. We believe that these findings can be explained by the high rates of transport and hydrolysis of acylated glycerols (mono, di, and tri) into the mammary gland, liberating free glycerol into the intracellular space of the mammary epithelial cell (MEC) (17). In support of our speculation, earlier work by West et al. in the mammary gland of the goat (30) reported extensive hydrolysis of plasma triglycerides during uptake into the mammary epithelial cell. Similar findings were observed in guinea pigs (14) and in rats (15), highlighting the role of the lipoprotein lipases in the hydrolysis of triglycerides at the MEC membrane (10, 11, 14, 15, 23, 30). When an emulsion of [2-3H]glycerol tripalmitate and glycerol tri[l-14C]palmitate was infused into the jugular vein of a lactating goat, [3H]glycerol appeared in lymph and milk fat more quickly and abundantly (twice as high) than the [14C]fatty acid, indicating a more rapid and selective transfer of glycerol into milk (30).
We analyzed the glycerol enrichments and concentrations in hydrolyzed milk as well as the free milk pool of glycerol. Our data comparing the enrichments of M3 glycerol in the hydrolyzed milk lipids to the free glycerol in milk was 96 ± 2%, indicating that the blood triglycerides were nearly completely hydrolyzed to fatty acids and glycerol in the process of triglyceride uptake. The liberated and transported glycerol is phosphorylated by glycerol kinase yielding glycerol-3-P. Glycerol-3-P can then be acylated to form the triglyceride backbone or converted to dihyroxyacetone-P by glycerol-3-P dehydrogenase and can flow down the glycolytic pathway for oxidation or up the pathway to form hexose moieties. On the basis of our data, we believe that the more likely fate of glycerol in the MEC is the latter and would in part account for the labeling of galactose for milk lactose. Thus, the precursor pool for de novo galactose synthesis must be that reflected in the diluted glycerol within the mammary epithelial cells (i.e., milk glycerol). Using this dilution, we estimate that glycerol contributes to ∼10 and 70% of the de novo synthesis of glucose and galactose, respectively, within the mammary epithelial cells and thus constitutes the primary source of substrate contributing to hexoneogenesis (details on the proposed mechanisms will follow below).
In the present study, we demonstrate that glycerol contributes ∼10–15% of total glucose Ra [i.e., 20–30% of total gluconeogenesis, assuming that gluconeogenesis represents half of glucose Ra (20)]. Our estimates for lipolysis from the glycerol kinetics as well as the contribution from glycerol to glucose production in lactating women are higher than those previously reported for healthy nonlactating subjects (1). In overnight-fasted healthy men, glycerol Ra was 3.11 ± 0.44 μmol·kg−1·min−1, of which 36% was converted to glucose, accounting for 4.5% of total glucose production (1). After 62–86 h of fasting, glycerol Ra increased to 5.32 ± 0.58 μmol·kg−1·min−1, and 68% of glycerol was converted to glucose and accounted for 21.6% of total glucose production (1). The higher rate of lipolysis in lactating women could be one of the mechanisms to accommodate for the extra glucose demands of fasting during lactation (18).
The present studies demonstrate that lactate plays essentially no role as substrate in hexoneogenesis within the mammary gland. Moreover, the concentration of lactate in milk was 20% of that in plasma, implying little direct transport of lactate into the mammary gland. These findings are in agreement with earlier in vitro reports in bovine mammary tissue (25) indicating no detectable utilization of [U-14C]lactate for lactose synthesis. However, the present study emphasizes the role of lactate as an important precursor for hepatic gluconeogenesis. Utilizing our total 13C labeling model (Eq. 4), lactate accounted for 22% of glucose total Ra and ∼45% of substrate for gluconeogenesis [assuming that gluconeogenesis constitutes ∼50% of glucose production after 14-h fasting (13, 20)]. This finding is in agreement with previous reports from our laboratory (16) and others' (3, 6). However, we acknowledge that this calculation may overestimate the hepatic fractional synthesis of glucose from lactate since we used not only M3 (indicator of direct lactate contribution) but also utilized the M1 and M2 labeled moieties. These later isotopomers are products of both TCA and Cori cycle activities.
The systemic Ra of lactate found in the present study is higher (20.8 ± 1.8 vs. 12.7 ± 0.8 μmol·kg−1·min−1, P < 0.01) than those in 15-h fasting nonlactating subjects (3). However, the oxidation rates in the lactating vs. nonlactating subjects (3) were not different (10.2 ± 1.3 vs. 7.6 ± 0.6 μmol·kg−1·min−1, P = 0.07). Thus, the estimated nonoxidized (uptake) rate was twice as high in the lactating subject (10.0 ± 1.0 vs. 4.8 ± 0.7 μmol·kg−1·min−1, P < 0.001). These observations indicating higher rates of lactate turnover and uptake in the postabsorptive lactating vs. the nonlactating women and remain to be fully explained (18). However, the site of utilization, based on our findings must be in tissues other than the mammary gland.
As we anticipated, [13C2]acetate contributed little or nothing to either hexoneogenesis or gluconeogenesis (29). These findings in humans are different from those found in ruminants, reflecting differences in substrate availabilities and utilization among different species (4). Studies utilizing acetate tracers in bovine reported 14C labeling exclusively and specifically in the galactose, but not glucose, moiety of the lactose (24, 34, 35). The flux of acetate in lactating women in our study is comparable to those reported in healthy, physically active men at rest, during exercise, or during recovery [365–415 μmol/min, i.e., ∼5 μmol·kg−1·min−1 (28)]. However, the 13C recovery in 13CO2 in our study (60%) was lower than those reported in men [75 or 100% during rest or exercise (28)]. This difference may reflect the utilization of acetate in the process of de novo fatty acid synthesis within the mammary gland (19).
Despite significant plasma glutamine enrichment of M2 isotopomer (∼6%), little or no enrichment was observed in either the glucose or galactose derived from milk lactose. Therefore, we conclude that glutamine is not a precursor for hexoneogenesis under the conditions of these studies. Our data are consistent with those in lactating bovine mammary tissue showing no detectable utilization of [U-14C]glutamate in milk lactose synthesis (25). In the present study, the estimated contribution of glutamine was only ∼2% of the total systemic glucose. This value, however, is lower than the 5% reported after 12–15 h of fasting (3) or 8 and 16% following 14 and 42 h of fasting (7), respectively. We speculate that the lower values obtained in the present study are due to the position of the labeled carbons on the glutamine molecule. In the liver, the position of the 13C labeling in [3,4-13C2]glutamine utilized in our previous study (7) is primarily incorporated into glucose via the glutamine entering the TCA cycle at the level of α-ketoglutarate (a potential gluconeogenic substrate), which has a lower chance of loss of 13C label through the TCA cycle. However, in the case of [1,2-13C2]glutamine used in the present study, the labeled carbon at position 1 is lost though conversion of ketoglutarate to succinate, whereas the carbon on position 2 has only a 50% chance of being lost. Thus, we may have significantly underestimated the contribution of glutamine to systemic glucose production.
To elucidate the mechanism of galactose synthesis within the mammary gland, two potential pathways, including the regular gluconeogenic (reversal Embden-Meyerhof) pathway and the pentose phosphate pathway, could result in the labeling of glycerol and are of relevance to our study. We would like to draw our readers' attention to an elegant series of publications between 1957 and 1965 focusing on the issue of galactose synthesis using the bovine animal model and infusions of different 14C-labeled substrates (8, 24, 31–35). The distribution of 14C in milk lactose following intravenous injection of labeled of [1-14C]acetate indicated that the glucose moiety of lactose originates from free glucose (in equilibrium with blood glucose) and the galactose from hexose phosphates formed within the mammary gland (24). To eliminate the contribution of 14C-labeled glucose from the liver, the cow udder was perfused with [1-14C]acetate in vitro (34) or injected directly with [1-14C]acetate into the pudic artery in vivo (35). They observed that the 14C was found almost exclusively in the galactose, but not in the glucose, moiety of the lactose. The authors concluded that the acetate is converted in a direct route to galactose in the udder via the TCA cycle to hexose phosphate (not to free glucose) (35).
When [l,3-14C]glycerol was injected unilaterally into one pudic artery of a cow (32), the distribution of l4C in the six carbons of blood glucose was very similar to that of the glucose moiety in lactose on the noninjected and, to a large extent, the injected side of the udder. As with acetate injection, the authors suggested that the glucose moiety arises either from free glucose or from a hexose phosphate pool in which there is little randomization of the l4C in the carbon chain of the hexose phosphate. However, the galactose moiety on the injected side had a ninefold increase in l4C labeling than did the blood glucose and a completely different l4C distribution pattern since C-4 and C-6 of galactose on the injected side contained 90% of the total l4C labeling. Should galactose be derived via the gluconeogenic process, either C-1 and C-3 or C-4 and C-6 should have contained equal labeling (i.e., 50% each). The authors proposed that these positions are labeled as a result of the transaldolase exchange reaction (but not through a net synthesis) via the pentose phosphate pathway (32). They further compared the distributions of 14C in the glucose and galactose moieties of milk lactose from cows' udders perfused with blood containing [1-14C]-, [2-14C]-, and [6-14C]glucose. On the basis of these data, they concluded that the glucose moiety primarily arose from free glucose but that the galactose came, in part, from hexose phosphate intermediates as a result of the pentose phosphate pathway activity (33). They estimated the proportional glucose utilization in the mammary gland: 1) 20–30% via the pentose cycle, 2) ∼10% by the Embden-Meyerhof pathway, and 3) 60–70% converted into lactose (33). Interestingly, the authors detected 14C from [6-14C]glucose in C-1 of galactose. This can occur only by conversion of [6-14C]glucose into glyceraldehyde 3-phosphate via the pentose cycle and then conversion to hexose via synthesis through the Embden-Meyerhof pathway (33). Thus, there appears to be synthesis of galactose via the glycolytic/gluconeogenic pathway.
To explore the role of the pentose phosphate pathway in lactose synthesis in humans, we have optimized a method utilizing standards of 13C3-labeled glucose ([1–3-13C3] and [4–6-13C3]) and aldonitrile pentaacetate derivative by use of GC-MS (2). This method enabled us to discern, to some extent, the distribution of 13C labeling of plasma and milk hexoses. The distribution of 13C conveyed from [U-13C]glycerol as indicated by the ratio of M3 enrichment on second three carbons (C-4–C-6)/M3 on the first three carbons (C-1–C-3) of the galactose molecule was higher (P < 0.05) (1.22 ± 0.05) than in plasma glucose (1.05 ± 0.03) or milk glucose (1.07 ± 0.02). However, in the case of [U-13C]lactate infusion, the ratio of 13C carbon enrichment of the major isotopomer (M2) on C-1–C-3/M2 on C-4–C-6 in plasma glucose, milk glucose, and galactose were essentially identical (P > 0.05, 1.06, 1.05, and 1.01, respectively). These findings, therefore, support the role of glycerol but not lactate, as a precursor of galactose within the mammary gland. However, the higher ratio of enrichment of 13C on C-4–C-6/C-1–C-3 suggests a potential role of the pentose phosphatase pathway as has been proposed in a bovine model (32). Furthermore, we have revisited our previous study of lactating women during feeding on a high-carbohydrate and high-fat diet (19, 20). During these studies, women were infused with [U-13C]glucose alone to measure gluconeogenesis and hexoneogenesis following an overnight fast. Mass isotopomer distribution analysis (MIDA) indicated lower (P < 0.01) M6, but higher (P < 0.01) M1–M4 in galactose compared with either plasma or milk glucose and again suggests the rearrangements (i.e., nonproductive isotopic exchange) of the glucose carbons into the newly synthesized galactose and supports a role of the pentose phosphate pathway. We attempted to utilize the aldonitrile pentaacetate derivative to localize the distribution of 13C particularly in the M3 isotopomer but were unable to do so because of the overlap between the ion clusters of different fragments when there are more than three 13C atoms in the same hexose molecule (2).
We would point out that there are legitimate differences between our current studies and those of in vivo infused udder with [l,3-14C]glycerol (32) and perfused mammary gland studies (8, 24, 31–35). These differences include species and the direct infusion of the labeled glycerol into the pudic artery. More importantly, these studies were conducted in the absorptive state and abundance of glucose. The single cow in that study (32) was fasted only during the 3-h infusion, whereas ours were performed during 24 h of fasting. Therefore, it is deemed worthy to determine how generalizable the results of the bovine model are particularly under similar conditions of lactose precursor availability (i.e., glucose).
We conclude that, following 18–24 h of fasting in lactating women: 1) neither acetate nor glutamine plays a role as carbon substrates for either mammary hexoneogenesis or systemic gluconeogenesis; 2) lactate is a primary substrate for systemic glucose production (22 ± 4% of total glucose) but is not a substrate for mammary hexoneogenesis; 3) glycerol is an important (second after lactate) substrate for systemic glucose production (∼11% of total); and 4), as a consequence of glycerol dilution by the action of mammary gland lipase activity, glycerol provides about one-half of the carbons for mammary hexoneogenesis (∼10% of glucose and ∼70% of galactose that is synthesized de novo within the mammary gland); 5) the pentose phosphate pathway may play a role in the synthesis of galactose in the human breast; and 6) it is likely that the labeling of milk hexoses from labeled glycerol is, at least in part, the result of net synthesis, whereas the very low level of labeling of milk hexoses from labeled lactate, acetate, and glutamine are most likely the results of nonproductive isotopic exchanges. Further studies are required to quantitate the relative role of the hexoneogenesis via the reversal Embden-Meyerhof pathway vs. that of the pentose phosphate pathway.
GRANTS
This project was supported by National Institutes of Health Grants RO1 DK-55478, HD-37857, MO1 RR-00188, and USDA/ARS 6250-5100. This work is a publication of the USDA/ARS Children's Nutrition Research Center, Department of Pediatrics, Baylor College of Medicine (Houston, TX). The contents of this publication do not necessarily reflect the views of policies of the US Department of Agriculture, nor does mention of trade names, commercial products, or organizations imply endorsement from the US Government.
DISCLOSURES
No conflicts of interest, financial or otherwise, are declared by the author(s).
AUTHOR CONTRIBUTIONS
Author contributions: M.A.M., P.M., A.L.S., and M.W.H. conception and design of research; M.A.M. and P.M. performed experiments; M.A.M., P.M., and A.L.S. analyzed data; M.A.M., P.M., A.L.S., and M.W.H. interpreted results of experiments; M.A.M. prepared figures; M.A.M., P.M., and M.W.H. drafted manuscript; M.A.M., P.M., A.L.S., and M.W.H. edited and revised manuscript; M.A.M., P.M., A.L.S., and M.W.H. approved final version of manuscript.
ACKNOWLEDGMENTS
We thank the volunteers whose participation made this study possible. We gratefully acknowledge and thank the technicians in our laboratory (Drs. Susan Sharma, Marcia Ekworomadu, and Shaji Chacko, and Dan Donaldson), our research coordinators (Amy Pontius, Cindy Bryant, and Linda Pleasant), and the staff in the Metabolic Research Unit and kitchen and the General Clinical Research Center, who greatly facilitated the execution of these studies.
REFERENCES
- 1.Baba H, Zhang XJ, Wolfe RR. Glycerol gluconeogenesis in fasting humans. Nutrition 11: 149–153, 1995. [PubMed] [Google Scholar]
- 2.Beylot M, Previs SF, David F, Brunengraber H. Determination of the 13C-labeling pattern of glucose by gas chromatography-mass spectrometry. Anal Biochem 212: 526–531, 1993. [DOI] [PubMed] [Google Scholar]
- 3.Consoli A, Nurjhan N, Reilly JJ Jr, Bier DM, Gerich JE. Contribution of liver and skeletal muscle to alanine and lactate metabolism in humans. Am J Physiol Endocrinol Metab 259: E677–E684, 1990. [DOI] [PubMed] [Google Scholar]
- 4.Cowie AT, Duncombe WG, Folley SJ, French TH, Glascock RF, Massart L, Peeters GJ, Popjak G. Synthesis of milk fat from acetic acid (CH3 14COOH) by the perfused isolated bovine udder. Biochem J 49: 610–615, 1951. [DOI] [PMC free article] [PubMed] [Google Scholar]
- 5.Davis TA, Nguyen HV, Garcia-Bravo R, Fiorotto ML, Jackson EM, Lewis DS, Lee DR, Reeds PJ. Amino acid composition of human milk is not unique. J Nutr 124: 1126–1132, 1994. [DOI] [PubMed] [Google Scholar]
- 6.Gerich JE. Control of glycaemia. Baillieres Clin Endocrinol Metab 7: 551–586, 1993. [DOI] [PubMed] [Google Scholar]
- 7.Hankard RG, Haymond MW, Darmaun D. Role of glutamine as a glucose precursor in fasting humans. Diabetes 46: 1535–1541, 1997. [DOI] [PubMed] [Google Scholar]
- 8.Hansen RG, Wood HG, Peeters GJ, Jacobson B, Wilken J. Lactose synthesis VI. Labeling of lactose precursors by glycerol-1,3-C-14 and glucose-2-C-14. J Biol Chem 237: 1034–1039, 1962. [PubMed] [Google Scholar]
- 9.Haymond MW, Sunehag AL. The reciprocal pool model for the measurement of gluconeogenesis by use of [U-13C]glucose. Am J Physiol Endocrinol Metab 278: E140–E145, 2000. [DOI] [PubMed] [Google Scholar]
- 10.Jensen DR, Bessesen DH, Etienne J, Eckel RH, Neville MC. Distribution and source of lipoprotein lipase in mouse mammary gland. J Lipid Res 32: 733–742, 1991. [PubMed] [Google Scholar]
- 11.Jensen DR, Gavigan S, Sawicki V, Witsell DL, Eckel RH, Neville MC. Regulation of lipoprotein lipase activity and mRNA in the mammary gland of the lactating mouse. Biochem J 298: 321–327, 1994. [DOI] [PMC free article] [PubMed] [Google Scholar]
- 12.Jenssen T, Nurjhan N, Consoli A, Gerich JE. Dose-response effects of lactate infusions on gluconeogenesis from lactate in normal man. Eur J Clin Invest 23: 448–454, 1993. [DOI] [PubMed] [Google Scholar]
- 13.Kaplan W, Sunehag AL, Dao H, Haymond MW. Short-term effects of recombinant human growth hormone and feeding on gluconeogenesis in humans. Metab Clin Exper 57: 725–732, 2008. [DOI] [PMC free article] [PubMed] [Google Scholar]
- 14.McBride OW, Korn ED. The uptake of doubly labeled chylomicrons by guinea pig mammary gland and liver. J Lipid Res 5: 459–467, 1964. [PubMed] [Google Scholar]
- 15.Mendelson CR, Scow RO. Uptake of chylomicron-triglyceride by perfused mammary tissue of lactating rats. Am J Physiol 223: 1418–1423, 1972. [DOI] [PubMed] [Google Scholar]
- 16.Meyer C, Stumvoll M, Dostou J, Welle S, Haymond M, Gerich J. Renal substrate exchange and gluconeogenesis in normal postabsorptive humans. Am J Physiol Endocrinol Metab 282: E428–E434, 2002. [DOI] [PubMed] [Google Scholar]
- 17.Mohammad MA, Haymond MW. Regulation of lipid synthesis genes and milk fat production in human mammary epithelial cell during secretory activation. Am J Physiol Endocrinol Metab 305: E700–E716, 2013. [DOI] [PMC free article] [PubMed] [Google Scholar]
- 18.Mohammad MA, Sunehag AL, Chacko SK, Pontius AS, Maningat PD, Haymond MW. Mechanisms to conserve glucose in lactating women during a 42-h fast. Am J Physiol Endocrinol Metab 297: E879–E888, 2009. [DOI] [PMC free article] [PubMed] [Google Scholar]
- 19.Mohammad MA, Sunehag AL, Haymond MW. De novo synthesis of milk triglycerides in humans. Am J Physiol Endocrinol Metab 306: E60–E71, 2014. [DOI] [PMC free article] [PubMed] [Google Scholar]
- 20.Mohammad MA, Sunehag AL, Haymond MW. Effect of dietary macronutrient composition under moderate hypocaloric intake on maternal adaptation during lactation. Am J Clin Nutr 89: 1821–1827, 2009. [DOI] [PMC free article] [PubMed] [Google Scholar]
- 21.Mohammad MA, Sunehag AL, Rodriguez LA, Haymond MW. Galactose promotes fat mobilization in obese lactating and nonlactating women. Am J Clin Nutr 93: 374–381, 2010. [DOI] [PMC free article] [PubMed] [Google Scholar]
- 22.Neville MC, Keller R, Seacat J, Lutes V, Neifert M, Casey C, Allen J, Archer P. Studies in human lactation: milk volumes in lactating women during the onset of lactation and full lactation. Am J Clin Nutr 48: 1375–1386, 1988. [DOI] [PubMed] [Google Scholar]
- 23.Neville MC, Waxman LJ, Jensen D, Eckel RH. Lipoprotein lipase in human milk: compartmentalization and effect of fasting, insulin, and glucose. J Lipid Res 32: 251–257, 1991. [PubMed] [Google Scholar]
- 24.Schambye P, Wood HG, Kleiber M. Lactose synthesis I. The distribution of C14 in lactose of milk after intravenous injection of C14 compounds. J Biol Chem 226: 1011–1021, 1957. [PubMed] [Google Scholar]
- 25.Scott RA, Beuman DE, Clark JH. Cellular gluconeogenesis by lactating bovine mammary tissue. J Dairy Sci 59: 50–56, 1976. [DOI] [PubMed] [Google Scholar]
- 26.Sunehag AL, Louie K, Bier JL, Tigas S, Haymond MW. Hexoneogenesis in the human breast during lactation. J Clin Endocrinol Metab 87: 297–301, 2002. [DOI] [PubMed] [Google Scholar]
- 27.Tigas S, Sunehag A, Haymond MW. Metabolic adaptation to feeding and fasting during lactation in humans. J Clin Endocrinol Metab 87: 302–307, 2002. [DOI] [PubMed] [Google Scholar]
- 28.van Hall G, Sacchetti M, Radegran G. Whole body and leg acetate kinetics at rest, during exercise and recovery in humans. J Physiol 542: 263–272, 2002. [DOI] [PMC free article] [PubMed] [Google Scholar]
- 29.Weinman EO, Strisower EH, Chaikoff IL. Conversion of fatty acids to carbohydrate: application of isotopes to this problem and role of the Krebs cycle as a synthetic pathway. Physiol Rev 37: 252–272, 1957. [DOI] [PubMed] [Google Scholar]
- 30.West CE, Bickerstafee R, Annison EF, Linzell JL. Studies on the mode of uptake of blood triglycerides by the mammary gland of the lactating goat. The uptake and incorporation into milk fat and mammary lymph of labelled glycerol, fatty acids and triglycerides. Biochem J 126: 477–490, 1972. [DOI] [PMC free article] [PubMed] [Google Scholar]
- 31.Wood HG, Gillespie R, Joffe S, Hansen RG, Hardenbrook H. Lactose synthesis V. C14 in lactose, glycerol, and serine as indicators of the triose phosphate isomerase reaction and pentose cycle. J Biol Chem 233: 1271–1278, 1958. [PubMed] [Google Scholar]
- 32.Wood HG, Joffe S, Gillespie R, Hansen RG, Hardenbrook H. Lactose synthesis. IV. The synthesis of milk constituents after unilateral injection of glycerol-1,3-C14 into the pudic artery. J Biol Chem 233: 1264–1270, 1958. [PubMed] [Google Scholar]
- 33.Wood HG, Peeters GJ, Verbeke R, Lauryssens M, Jacobson B. Estimation of the pentose cycle in the perfused cow's udder. Biochem J 96: 607–615, 1965. [DOI] [PMC free article] [PubMed] [Google Scholar]
- 34.Wood HG, Schambye P, Peeters GJ. Lactose synthesis II. The distribution of C14 in lactose of milk from the perfused isolated cow udder. J Biol Chem 226: 1023–1034, 1957. [PubMed] [Google Scholar]
- 35.Wood HG, Siu P, Schambye P. Lactose synthesis III. The distribution of C14 in lactose of milk after intra-arterial injection of acetate-1-C14. Arch Biochem Biophys 69: 390–404, 1957. [DOI] [PubMed] [Google Scholar]