Abstract
Magnetic resonance imaging (MRI) has advantages for the assessment of gastrointestinal structures and functions; however, processing MRI data is time consuming and this has limited uptake to a few specialist centers. This study introduces a semiautomatic image processing system for rapid analysis of gastrointestinal MRI. For assessment of simpler regions of interest (ROI) such as the stomach, the system generates virtual images along arbitrary planes that intersect the ROI edges in the original images. This generates seed points that are joined automatically to form contours on each adjacent two-dimensional image and reconstructed in three dimensions (3D). An alternative thresholding approach is available for rapid assessment of complex structures like the small intestine. For assessment of dynamic gastrointestinal function, such as gastric accommodation and emptying, the initial 3D reconstruction is used as reference to process adjacent image stacks automatically. This generates four-dimensional (4D) reconstructions of dynamic volume change over time. Compared with manual processing, this semiautomatic system reduced the user input required to analyze a MRI gastric emptying study (estimated 100 vs. 10,000 mouse clicks). This analysis was not subject to variation in volume measurements seen between three human observers. In conclusion, the image processing platform presented processed large volumes of MRI data, such as that produced by gastric accommodation and emptying studies, with minimal user input. 3D and 4D reconstructions of the stomach and, potentially, other gastrointestinal organs are produced faster and more accurately than manual methods. This system will facilitate the application of MRI in gastrointestinal research and clinical practice.
Keywords: magnetic resonance imaging, gastrointestinal tract, gastrointestinal function, image processing, 3D reconstruction
imaging the gastrointestinal (GI) tract is required to understand digestive function in health and disease. Established investigations such as endoscopy and computed tomography provide an accurate assessment of GI anatomy; however, these are not suitable for the assessment of digestive function during and after a meal. Magnetic resonance (MR) imaging (MRI) provides wide-field, three-dimensional (3D) images with excellent soft tissue contrast without the use of harmful ionizing radiation. Researchers have developed and validated MRI techniques to assess a wide range of digestive functions such as gastric accommodation, motility, and emptying (2, 3, 7, 8, 13, 18, 20, 24, 25, 27–31). Recent studies have applied these techniques to gain insight into the pathophysiology of gastroesophageal reflux disease (11, 19), dyspepsia (13, 14, 34), gastric emptying disorders (2, 7, 24), and the irritable bowel syndrome (15, 23). This body of work demonstrates the potential of MRI to explain the causes of digestive symptoms, provide a positive diagnosis of functional GI diseases, and direct rational clinical management.
Studies have shown that cross-sectional, two-dimensional (2D) imaging cannot describe the complex anatomy of the GI tract (10, 11). Three-dimensional (3D) MR images of the region of interest (ROI) can be reconstructed from multiple 2D cross-sectional “slices.” These are then analyzed to provide quantitative measurements that describe the structure and function of the GI tract (“biomarkers”). This process represents an important technical challenge. First, because the cross-sectional images contain multiple organs, the ROI (e.g., stomach) must be identified and separated from rest of the image, a step known as segmentation. Then the 3D surface of the segmented organ needs to be reconstructed. Alternatively, the 3D volumes can be created by a region growing technique (6). Finally, a series of 3D images must be obtained over time to describe dynamic “four-dimensional” (4D) digestive function (e.g., gastric accommodation and emptying). The manual analysis of this complex imaging data is very time consuming and this has limited the adoption of this technique to a few specialist centers.
This study presents a new image analysis platform that uses a semiautomatic approach involving arbitrary slicing and automated seed point ordering to reconstruct and measure 3D GI structures from a large set of 2D MR image data. This system then extends the analysis to subsequent sets of MR images to provide measurements of dynamic 4D GI function with minimal user intervention. The primary hypothesis tested is that this semiautomatic image analysis platform provides rapid and accurate measurement of gastric function. We estimated the time required to complete the semiautomatic analysis and assessed the agreement of measurements acquired by this analysis with the results of manual analysis of the same data by three independent observers (Assessors A, B, and C). The semiautomatic image analysis platform was then applied in a pilot study to document the change in gastric volumes during and after infusion of a test meal. Additionally, the flexibility of the system was demonstrated by reconstruction of the highly complex anatomy of the small bowel.
MATERIALS AND METHODS
Image Acquisition
Gastric imaging.
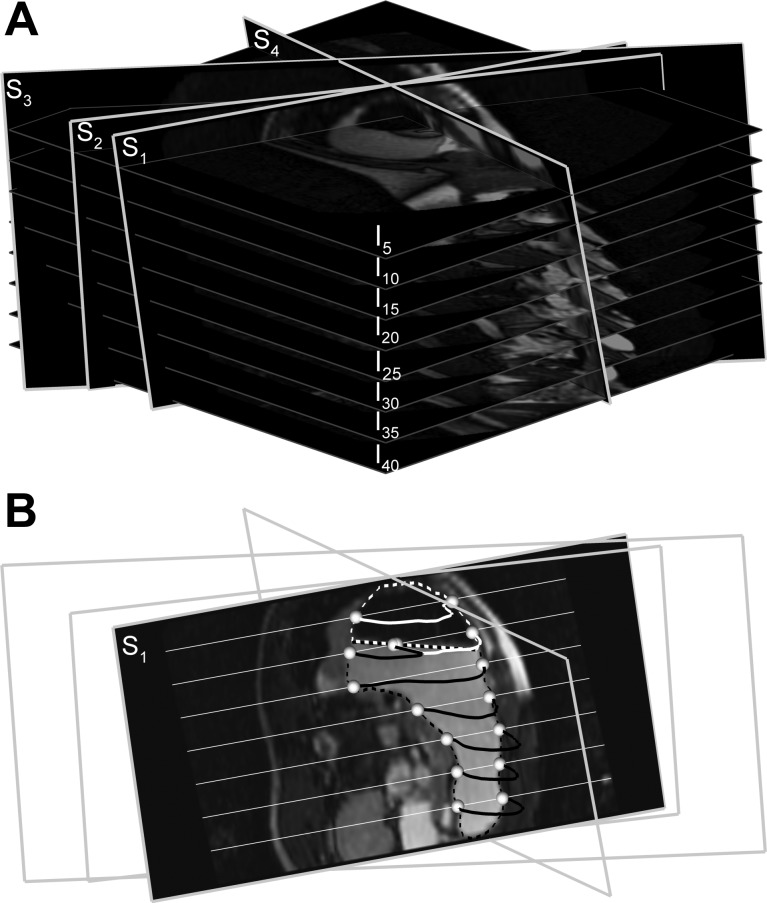
MR data used in this study were acquired from 16 healthy subjects (9 men, age 20–37 yr) participating in a study of gastric function (22). The study was approved by the local ethics committee, and written, informed consent was obtained. Subjects underwent three studies each in which MR scans were performed on 60 occasions at 1-min intervals each comprising of 40 images spanning the abdominal cavity. Contrast between the meal and stomach wall was accentuated by using a paramagnetic contrast agent Gd-DOTA (Dotarem; Laboratorie Guerbet, Aulnay-sous-Bois, France). The meal appears bright and the intragastric air dark (Fig. 1).
Fig. 1.
A: slicing of a stack of 40 images (every 5th image is shown; I5–I40) along arbitrary slice planes (S1–S4) to generate virtual magnetic resonance (MR) images. B: interpolated virtual MR image for slice plane S1 is shown. Contents of the stomach include air (black region, white outline) and meal with contrast agent (brighter region, black outline). The white and black dotted lines show the edges of the meal and air in the stomach, respectively, in original MR images that intersect with the contours of the stomach in the virtual MR images at seed points (white spheres). The white straight lines that intersect with the slice plane S1 are image planes I5–I40.
Intestinal imaging.
To evaluate the ability of the image analysis system in reconstructing a more complex 3D structure, we also used MR images of the small intestine (35). The study protocol was approved by the institutional ethics committee, and the single participant gave written, informed consent prior to enrolment. To optimize small bowel distension, the participant ingested a mixture of 1,000 ml water with 0.8 g/kg body wt psyllium fiber (Metamucil regular, Procter & Gamble) labeled with 20 ml of 0.5 mol/l Gd-DOTA (meglumine gadoterate, DOTAREM, Guerbet France). Four 250-ml doses of this mixture were administered by mouth over 4 h. MRI was then performed.
Image Analysis System
Each step required for 3D analysis of the GI tract from MRI was performed by using a graphical user interface designed using MATLAB R2009a (MathWorks, Natick, MA). Mathematical and algorithmic details are provided in the appendix. The image analysis system provides two complementary approaches that are selected by the user on the basis of the anatomical complexity of the ROI. The first approach, used to assess relatively simple 3D geometry (e.g., stomach), involves semiautomatic edge detection on virtual images along arbitrary planes set by the user, which generates seed points that are joined to form 2D contours in the original images from which the 3D image is reconstructed. The second approach, used for more complex structures (e.g., small intestine), involves a thresholding approach in 3D in which distinct contrast between the ROI and its surroundings is used to build 2D and 3D images.
Image slicing.
Virtual MR images are created along arbitrary slicing planes with trilinear interpolation by manually selecting three points over the 2D image stack in such way that the planes pass through the ROI (Fig. 1A). Segmentation of these images generates the contours (dotted lines in Fig. 1B) that intersect original images at a minimum of two points along the edges of the ROI. The intersecting points generated then serve as the “seed points” (white spheres in Fig. 1B) for fully automatic edge detection in the original 2D images. The number of virtual images necessary for a study is independent of the number of original MR images (a minimum of two) but is dictated by the complexity of the 3D structure of the ROI.
Segmentation of virtual images.
The virtual images are segmented by using three alternative image segmentation methodologies: 1) thresholding, 2) ray search, and 3) livewire. These techniques each have advantages and limitations that are considered below. The use of a particular technique is determined by the user based on by the anatomical complexity of the ROI and image characteristics.
THRESHOLDING.
Image intensity within the ROI is used as a threshold value to segment the images for ROI with 1) near-uniform image intensity and 2) distinct soft tissue contrast between the ROI and surrounding organs (32). Contrast agents (e.g., Gd-DOTA) may be used to facilitate this process. To add flexibility, the user can interactively set a tolerance on the threshold image intensity. The tolerance determines the upper and lower limits of the desired range of image intensity. This technique requires a single click to select a point within the ROI. Thresholding has minimal user intervention and is fastest of all methods of segmentation.
RAY SEARCH TECHNIQUE.
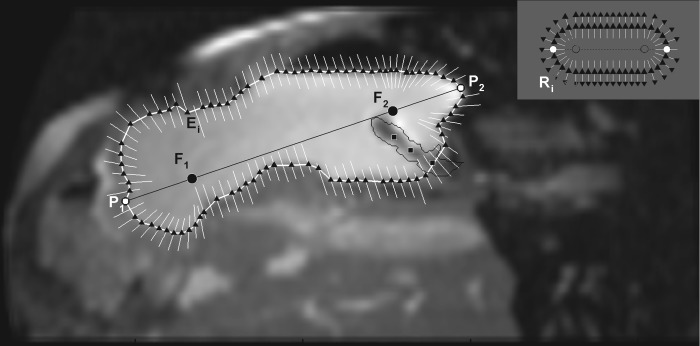
In this technique (Fig. 2) the foci (F1 and F2) of an ellipse approximating one contiguous ROI are obtained from two manually identified edge points (P1 and P2). Ray vectors are cast from the foci to search for edges of the ROI (Fig. 2, inset) based on criteria involving dot-product of image intensity gradient and the ray vectors (details in appendix). The search along a ray is limited by using dynamically updated information about the last edge point to avoid detecting the edge of neighboring organs.
Fig. 2.
Ray search technique for segmentation of the region of interest (ROI). The points P1 and P2 are clicked to identify the approximate longest diameter of the ROI from which the foci (F1 and F2) are generated at 20% distance from the clicked points along the diameter. The black triangles show the edge points (Ei) detected by ray search. Along any particular ray (white lines), if there is no black triangle, it indicates that the edge of the ROI (i.e., stomach) was not detected. The location of each ray also shows the dynamic update of the ray position based on the previous position of the ROI (i.e., detected edge of the stomach wall). In the absence of this update procedure, the rays form an oblong shape as shown in the inset. R indicates the ray vectors cast and subscript i is the number of rays cast for a particular ROI. A 3 × 3 Gaussian filter was then applied that removed noise from the MR image but renders other abdominal contents slightly blurry. The black squares within the stomach show points clicked to identify a balloon-tipped catheter in the stomach, which is enclosed by the thin black line, the edge points within which are ignored by the algorithm.
LIVEWIRE SEGMENTATION.
For this method initial seed points on the edges of the ROI are necessary as input to detect edges by using the livewire algorithm (5, 17). The algorithm calculates “costs” associated with all the pixels in the image to determine the “minimum cost path” connecting the seed points. Cost is expressed in terms of various metrics of spatial variation in image intensity. The minimum cost path between each pair of consecutive seed points calculated by the algorithm constitutes the edge of the ROI that connects them. Seed points, semiautomatically generated and ordered (described in Automated seed point generation and ordering), serve as input to an automated livewire algorithm. If errors occur then seed points can also be corrected by manual mouse clicks. For organs like the stomach, where the ROI contains contrasting intensities (i.e., intragastric air and meal), seed point ordering and automated livewire segmentation are performed separately for both components.
Automated seed point generation and ordering.
After edge detection on the virtual image planes, seed points are automatically generated at the intersection point of contours with the original image planes. Automated edge detection using livewire requires seed points to be ordered in their original image planes to form polygons that approximate corresponding ROI edges (Fig. 3). The algorithm developed for seed point ordering fits convex hull polygons (12) connecting the seed points in each image slice. If any seed point is left out, a virtual “magnetic force” proportional to the negative of image intensity gradient deforms the sides of the polygon. The side that reaches an interior seed point first is split into two halves by treating the point as a new vertex. The procedure is repeated until all seed points are linked.
Fig. 3.
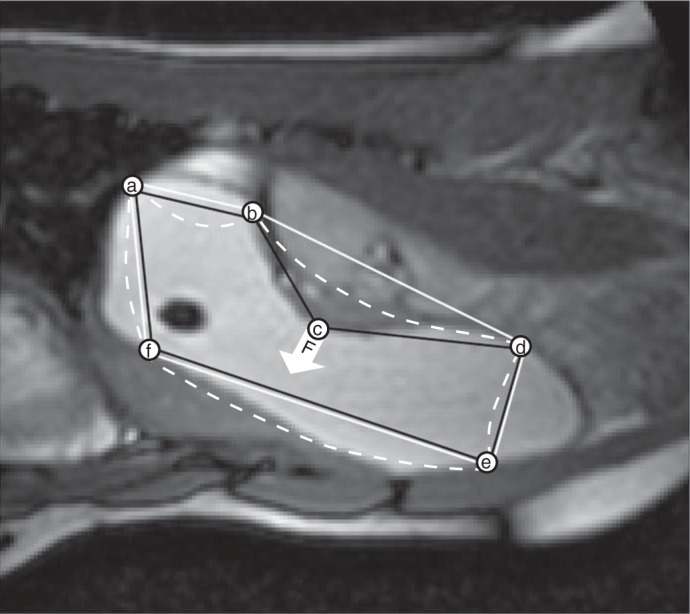
Magnetic linking procedure for ordering seed points (a to f) to form a polygon that approximates the edge of the ROI. A convex hull (17) polygon (a–b–d–e–f) is fitted through the seed points (solid white line). Because of concavities a few seed points (e.g., point c) do not form part of the convex hull as shown by the point c that is not at a vertex of the white convex hull polygon. The intensity gradient of the image at this “out-of-position” seed point is used as a “magnetic force” (F) on the sides of the convex polygon which attracts or repels the sides (white dashed lines). Whichever side first arrives at the out-of-position seed point is divided into two parts by including this seed point as a vertex leading to an appropriately ordered (a–b–c–d–e–f) concave polygon of seed points (black line). The process continues until all seed points are part of the polygon that approximates the edge of the ROI.
3D reconstruction.
By using the segmented contours, the 3D surface of the ROI is generated by the approach of Cong and Parvin (9), in which the function φ(x,y,z) is calculated such that φ(x,y,z) = 0 on the 3D reconstructed surface (5, 17). Here z corresponds to the image stacking direction (details in appendix).
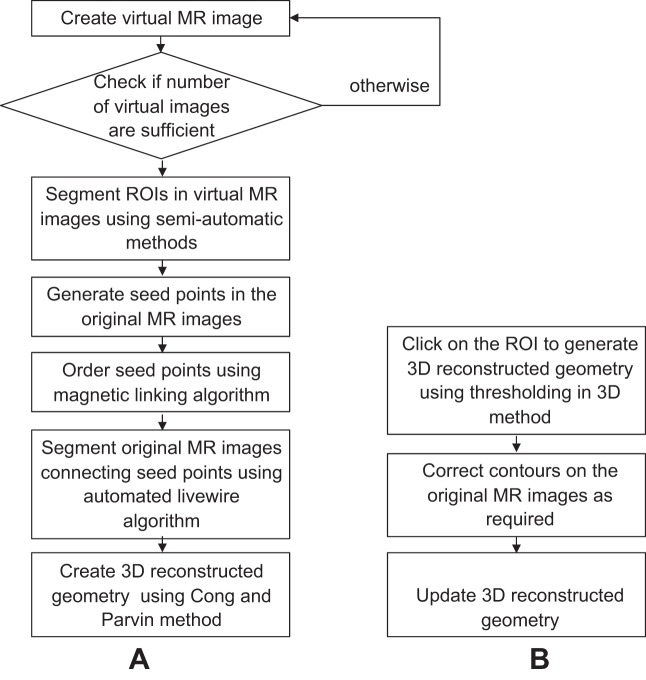
An alternative thresholding in 3D approach is preferred for 3D reconstruction of complex geometries (e.g., small intestine) because, in such cases, the Cong and Parvin approach requires considerable manual intervention for correcting erroneous segmentation and seed point ordering. Thresholding in 3D bypasses edge detection and generates a 3D surface directly from the ROI of the whole 2D image stack based on image intensity. The range of image intensity can be adjusted manually as for thresholding in 2D. Usually two to three mouse clicks are required to sample the image intensities of the ROI. Once the 3D image has been reconstructed, the user can examine the MR images and select regions by manually clicking on the 2D images to add them to or remove them from the 3D geometry. Figure 4 depicts key steps for both approaches to 3D reconstruction.
Fig. 4.
Flow chart of the 2 approaches used in this image analysis platform. In the first approach 3–4 virtual images were extracted from the 2D image stack, then these virtual images were segmented. By using the contours generated on the segmented virtual images, seed points were generated on the original images. The seed points were connected in specific order by magnetic linking and automated livewire algorithms to generate contour stacks ready for 3D reconstruction by the Cong and Parvin approach (9). In the second approach 3D reconstructed geometry is generated directly from the sets of 2D images with a single click and defined thresholds of image intensity, and then the resulting 3D geometry is manually corrected where needed and the 3D geometry is updated.
Dynamic automatic processing: imaging 4D GI function.
After one stack of images is processed by the methods described above, preceding or succeeding image stacks are segmented automatically with the initial set of segmented images as reference. An algorithm is applied that automatically interpolates 8–12 points on the segmented contours of the reference images, which are then “fitted” to the edges of the ROI in the current image by using an algorithm that finds the best match between the reference and the current images based on the local image properties surrounding the points and the intensity gradient. If the match between corresponding images of the reference and the current data set is below 80%, an alert to verify the results is generated. Following verification and/or correction, the fitted points are then used as seed points for the livewire algorithm to segment the images and subsequently to create 3D reconstructions. The sequence of 3D reconstructed images of the ROI taken over time provides 4D data that can visualize dynamic GI function in terms of volume change and alterations in gastric morphology.
Validation of Semiautomatic vs. Manual Segmentation and 3D Reconstruction
The estimated numbers of mouse clicks required to produce 4D reconstructions of gastric emptying by manual and semiautomatic image processing platform were compared. Manual segmentation of the ROI in all 60 MRI scans acquired in the 1-h study (i.e., 60 × 40 = 2,400 images) was impractical. Thus the comparison was based on 23 MR scans (i.e., 23 × 40 = 920 images) that were manually segmented. In contrast, the full set of 60 MRI scans segmented by the semiautomatic imaging processing system. Total gastric volumes obtained from manual segmentation of MRI data by three experienced researchers using published methodology were compared with those derived from the semiautomatic algorithms by linear regression analysis using SPSS 13.0 (SPSS, Chicago, IL). The assessment of interobserver agreement between manual and semiautomatic analysis was repeated by using only the 23 MRI scans. This allowed direct comparisons of key measurements based on the same set of data.
RESULTS
In this section the performances of the semiautomatic image processing system using the image slicing, magnetic linking, and automated livewire approach are compared with that of the manual image processing system.
Reconstruction of 3D Gastric Structure and 4D Gastric Function
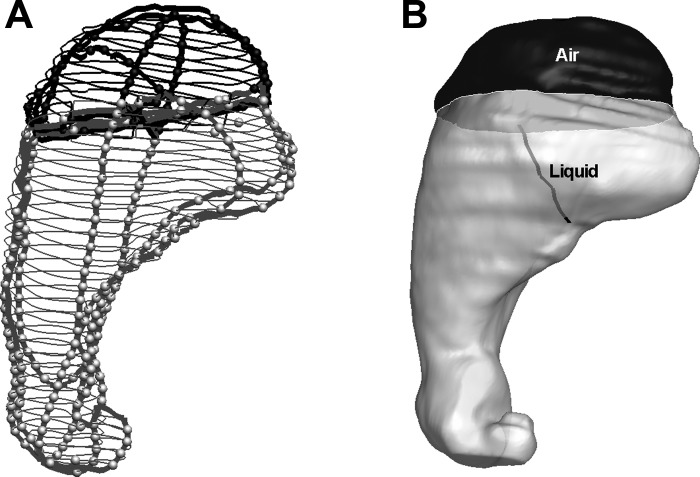
Figure 5 shows a representative 3D reconstruction of the stomach from the set of images shown in Fig. 1. Four virtual images slices are generated and on each of them the contours for regions containing liquid meal (gray dashed lines in Fig. 5A) and air (black dashed lines) are determined by the ray search method. The seed points, generated from intersection of these contours with the original image planes (liquid, light gray spheres; air, black spheres), were used for automatic segmentation of ROIs containing liquid and air by the livewire algorithm followed by 3D reconstruction (Fig. 5B). Analysis and reconstruction of the full set of images by the semiautomatic processing platform visualized the dynamic change in 3D gastric morphology (“functional anatomy”) during accommodation and emptying after infusion of a 800-ml test meal in a normal subject (Fig. 6, Table 1).
Fig. 5.
A representative 3D reconstruction of the stomach from the MRI data shown in Fig. 1. Four virtual MR images are generated along arbitrary slicing planes. A: edge contours of the stomach in virtual and original image planes. Gray and black colors represent intragastric liquid and air region. Thicker lines represent contours on virtual images and thinner lines contours on original images. The light gray and black spheres show the seed points within the contours for liquid (bright) and air (dark), respectively. B: following segmentation of the original 2D MR images, 3D geometry of both liquid and air in the stomach and an envelope encompassing both were reconstructed. The black line indicates the positioning of a silicon catheter assembly inserted through the lower esophageal sphincter with its balloon tip at the liquid-air interface.
Fig. 6.
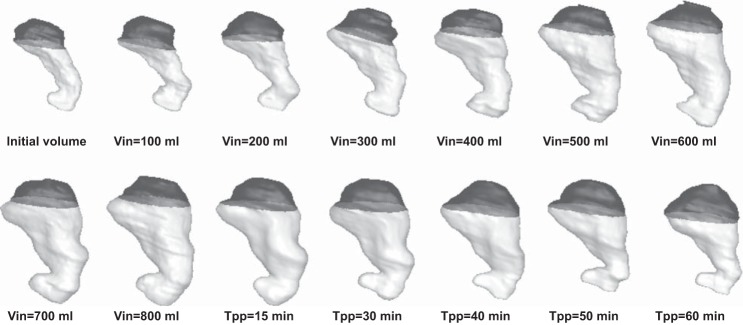
3D images of the stomach reconstructed from MRI data by use of an image processing platform showing changes in stomach volume and morphology during and after 800-ml liquid nutrient meal ingestion in a normal subject. Images are presented from before meal infusion, after each 100-ml meal infusion (designated by Vin) and 15, 30, 45, and 60 min postinfusion (designated by Tpp), respectively. The darker region corresponds to the liquid inside stomach, while the lighter region shows gastric air. The total gastric volumes and gastric content volumes calculated after 3D reconstructions are given in Table 1.
Table 1.
TGV and GCV of the stomach for 800-ml meal infusion for a particular study before meal infusion, after each 100 ml meal infusion, and 15, 30, 45 and 60 min postinfusion as calculated after 3D reconstruction
| TGV, ml | GCV, ml | |
|---|---|---|
| Infusion volume, ml | ||
| 0 | 243.86 | 133.34 |
| 100 | 298.47 | 161.73 |
| 200 | 395.37 | 249.99 |
| 300 | 485.04 | 339.77 |
| 400 | 569.17 | 422.72 |
| 500 | 693.75 | 552.54 |
| 600 | 792.94 | 645.95 |
| 700 | 876.12 | 726.63 |
| 800 | 973.72 | 821.74 |
| Postinfusion time, min | ||
| 15 | 938.19 | 751.91 |
| 30 | 811.05 | 632.08 |
| 40 | 732.29 | 547.39 |
| 50 | 664.17 | 450.04 |
| 60 | 548.02 | 320.23 |
TGV, total gastric volume; GCV, gastric content volumes.
The stomach geometries are depicted in Fig. 6.
Manual vs. Semiautomated Method: Analysis Time
Each of the three human observers drew contours of the entire (liquid + air) stomach in each image by selecting 5–20 points per image, totaling 400–450 points per stack of 40 images. As stated above, because of the time-consuming nature of this manual segmentation, only 23 of the 60 MR scans acquired in each study were analyzed, requiring total 9,000–10,000 mouse clicks. Typically, an experienced user requires 8 h (i.e., 1 working day) to complete this task.
In the semiautomated system 9–12 mouse clicks were required to generate three to four virtual images for each stack of images followed by segmentation of intragastric air and liquid in each virtual image, requiring an additional 16–30 mouse clicks. Seed points were automatically generated from the segmented virtual images and joined to form contours by using the automatic livewire algorithm for both ROIs containing intragastric air and liquid. This was followed by 3D reconstruction of separate air and liquid ROIs that could be then joined into a single image. Dynamic automatic processing is used for image segmentation and 3D reconstruction of the remaining 59 sets following the completion of one data set.
The semiautomated analysis required a total of ∼100 mouse clicks to produce 3D reconstructions of all 60 MR scans acquired during the study. Typically the time required for the assessors to identify the borders of the ROI and check every set of images for errors in automatic processing was 1 h human time (reduced if only 23 of 60 images were processed). Occasional images with low contrast (e.g., air volume in 6–8 images) required correction after automatic segmentation. In addition, the automated analysis required 1–2 h of computer time (on a Dual Core 2.33 GHz Intel PC with 2 GB RAM).
Manual vs. Semiautomated Method: Agreement
Comparison of total gastric volumes derived by using the manual and the semiautomated methods show the characteristic rise and fall of gastric volumes after ingestion of a test meal (Fig. 7A). Measurements of gastric function from the semiautomatic analysis were the same whether based on all 60 images or the 23 images manually analyzed by investigators. The overall fit of the regression model to the data was excellent in all cases (R2 > 0.97); however, there were interobserver differences in absolute volume measurements (Table 2).
Fig. 7.
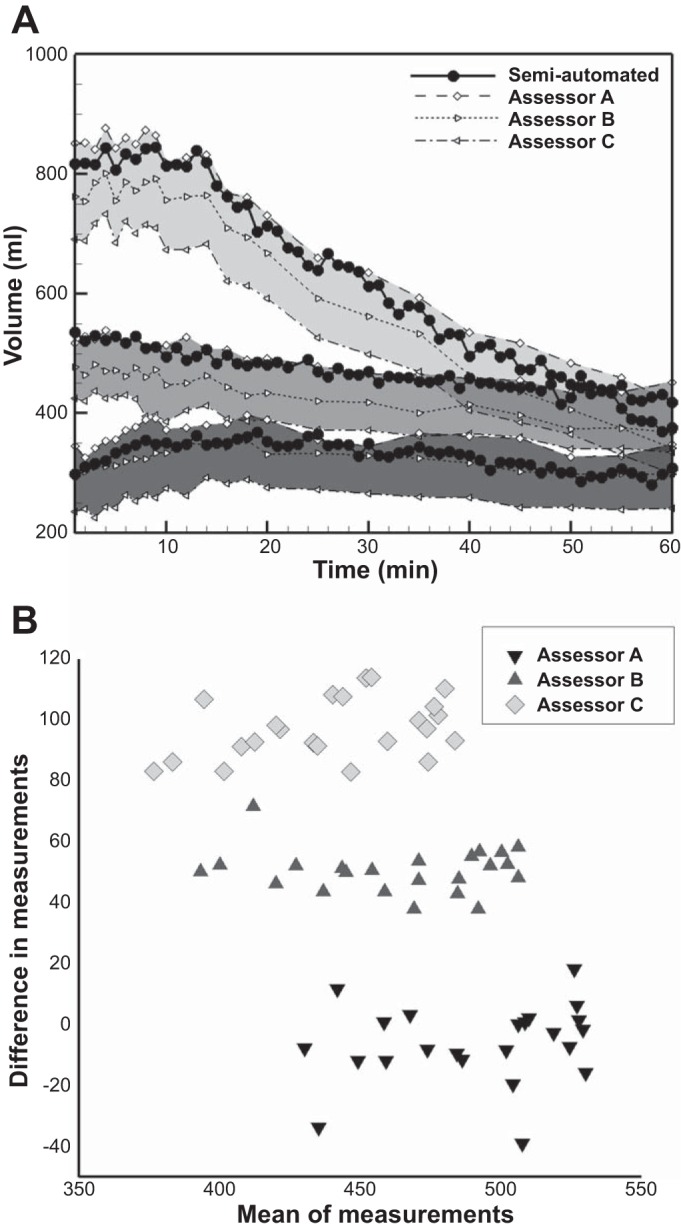
A: comparison of total gastric volumes by manual and semiautomated image analysis. Liquid meals of different volumes were infused into the stomach through a nasogastric catheter (dark gray shading, 200 ml; medium gray shading, 400 ml; pale gray shading, 800 ml). The characteristic rise and fall in gastric volume after meal infusion reflects the dynamic balance between meal volume, secretion volume, and gastric emptying over time. Black-filled circles indicate measurement of gastric volume in all 60 scans by the semiautomated system. Open symbols indicate measurement of gastric volume in 23 MR scans by the manual system. Note the systematic offset of volume measurements between each of 3 assessors A, B, and C (represented by different markers). B: Bland-Altman plot showing variations in gastric volume measurements between the assessors compared with that measured by the semiautomatic method for a normal subject (n = 23). The difference between the volume measurements by each assessor and the semiautomatic measurement has been plotted against the mean between them. The plot demonstrates the individual bias between the assessors.
Table 2.
Linear regression of measurements of gastric volume between manual method and semiautomated image analysis from all studies (n = 23 for both methods)
| x | y | Linear Fit y = a + bx | R2 | P Value for a | P Value for b |
|---|---|---|---|---|---|
| Semiautomated | Assessor A | y = 41.11 + 0.97x | 0.99 | P < 0.001 | P < 0.001 |
| Semiautomated | Assessor B | y = 7.85 + 0.95x | 0.99 | P = 0.07 | P < 0.001 |
| Semiautomated | Assessor C | y = −29.68 + 0.96x | 0.97 | P < 0.001 | P < 0.001 |
Gastric volume measurements by Assessor A and to a lesser extent B are consistently biased toward higher values (a is positive in the linear fit) and those of Assessor C are biased toward lower values (a is negative) for gastric volumes.
Detailed review of the original measurements revealed that Assessors B and C tended to select data points/drew contours on the inside the stomach wall, producing lower measurements of gastric volumes, whereas Assessor A drew the contours outside the stomach wall, obtaining higher measurements of gastric volumes. Thus there was a systematic bias of individual manual assessors for measurements of gastric volume with respect to the semiautomated system.
Intraclass correlation (ICC) analysis (Table 3) shows the difference in the level of agreement between the gastric volumes measured by the assessors with that measured by the semiautomatic technique in terms of absolute measurement. Despite systematic over- or underestimation by manual assessors, the ICC correlation coefficient for key metrics derived from the data was very good (>0.9 in all the cases).
Table 3.
ICC analysis
| ICC Coefficient | Assessor A | Assessor B | Assessor C |
|---|---|---|---|
| Absolute value | 0.990 | 0.972 | 0.854 |
| Consistency | 0.996 | 0.994 | 0.992 |
Intraclass correlation (ICC) analysis between the semiautomatic and manual volume measurements showed the difference in the level of agreement between the gastric volumes measured by the assessors with that measured by the semiautomatic technique in terms of absolute measurement, even though all the assessors were consistent in their measurements indicating the presence of systemic bias.
Handling Complex Geometry: 3D Reconstruction of Small Intestine
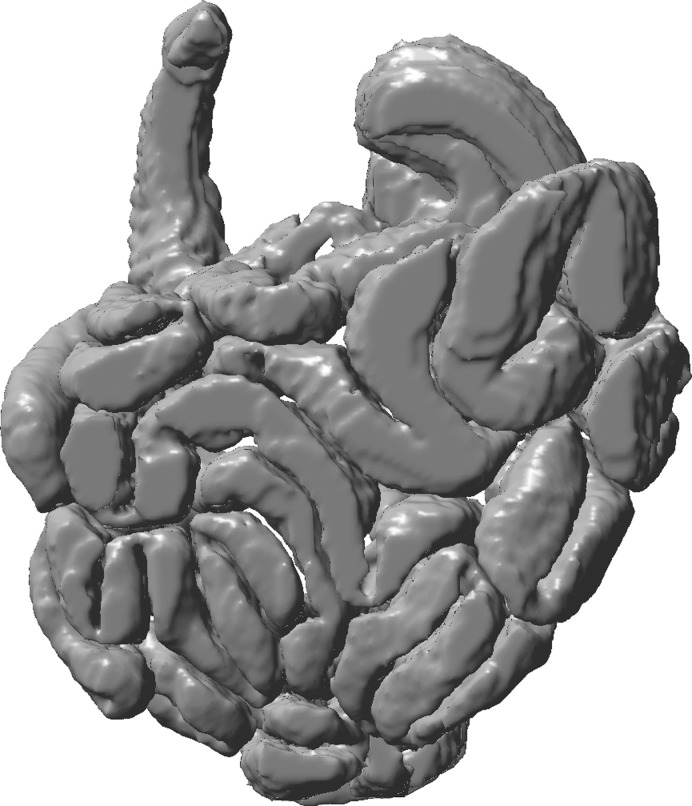
The capability of the system to analyze complex structures is demonstrated by the small intestine (Fig. 8). 3D reconstruction from the data was performed by using the thresholding in 3D approach with one to three clicks for sampling intensity of ROI. Further manual editing was required to correct the 3D geometry generated by 2D to 3D interactive editing. This amounted to a total ∼1,000 clicks and 3–4 h processing time for the entire small intestine (Dual Core 2.33 GHz Intel PC with 2 GB RAM).
Fig. 8.
Complex anatomy of the small intestine reconstructed from MRI data by the thresholding in 3D approach.
DISCUSSION
This paper introduces a rapid, accurate, and semiautomated image analysis system for 3D and 4D reconstruction of gastric structure and function from MRI data. The system is capable of describing the functional anatomy of the stomach during and after a meal. Pilot data demonstrate that this platform can also describe the highly complex structure of small intestine.
The semiautomated system reduced the time and effort required to measure gastric volume from MR images. An estimated 100 mouse clicks were required in the semiautomatic process including all 60 image stacks, compared with nearly 10,000 mouse clicks for manual analysis of only 23 image stacks from the same data set. Consequently, the “human time” required to measure gastric volumes was reduced from around 8 h to 1 h. This is similar to the time required to analyze many clinical MRI studies (26). Validation studies were performed to ensure that these efficiencies were achieved without a loss in measurement accuracy compared with manual analysis (Table 2). Gastric volumes derived by the semiautomated system demonstrate excellent agreement with those obtained by experienced investigators (R2 > 0.97, P < 0.001 in all cases); however, gastric volumes measured by two observers were consistently lower than with the semiautomated system, whereas those of a third observer were higher (Fig. 7A). This is important because this kind of systematic bias in gastric volume measurements will impact on measurements including gastric accommodation after the meal and gastric emptying half-time (21). Absolute gastric volume measurements reveal ∼70 ml interobserver variations between individual observers (Tables 2 and 3, Fig. 7B). The semiautomated method is free from such bias and other sources of variation between human observers. It remains susceptible to noise and lack of contrast. For the test meal this was minimized by application of a paramagnetic contrast agent; however, errors did occur on occasion during assessment of gastric air. Note that, in such cases when the semiautomatic system is unable to identify the border of the ROI (e.g., stomach), the user is alerted to the potential errors by an automated alert to facilitate the verification process.
Earlier studies used orthogonal slicing of a stack of images to generate virtual images used a “turtle” method for ordering of seed points (1, 9); however, this cannot be used in complex anatomical objects such as the stomach and other GI organs. Here nonorthogonal slicing of the image stacks ensured that virtual images captured complex anatomy and the “magnetic” linking procedure ordered the seed points. When selecting virtual image planes it is necessary to assure that the initial planes pass through the ROI to reduce the number of such planes required and the time required to complete the study. This selection of images improves with experience. Furthermore automatic localization of the seed points from one image stack to subsequent ones dramatically reduced the user input required in dynamic MR studies of gastric function. Automatic edge detection is dependent on the similarity between two consecutive stacks of images and hence performs better at higher temporal resolution. The minimum rate of acquisition of images required for efficient processing of image data will depend on the physiological process under investigation. In the case of gastric emptying the frequency of error messages from the semiautomatic system was not different for the full [60 image stacks (1/min)] or censored (23 image stacks) data set.
The image analysis system incorporates three different techniques for manual image segmentation that can be selected according to their respective advantages and limitations. Thresholding requires only one mouse click and can be successfully implemented for any shapes, but variations in image intensity of the ROI, or the presence of abutting structures with similar image intensities to that of the ROI, disrupt its functionality. Ray casting is developed to work based on two clicks but fails when the object shape deviates too much from typical circular/elliptical forms. Livewire offers high user interactivity, but, since it involves computationally expensive calculation of the cost matrix for every pair of linked seed points in every image slice, the processing time tends to be slow for larger data sets. For this reason the full image analysis system provides the three different options to quickly and accurately process a wide variety of image types. It remains the case that the efficiency of all options decreases if the image contrast is poor and the image intensities are not uniform throughout the ROIs. The set of editing tools integrated into the system further assist the user to correct erroneous contours that can occur if image quality is poor.
The system also offers the flexibility of two different approaches for generating 3D reconstructed geometry: 1) 3D reconstruction using Cong and Parvin's approach following segmentation of virtual images, seed point ordering, and automated segmentation of the original images and 2) thresholding in 3D. The first method, based on nonorthogonal slicing of the image stacks, works efficiently when each image does not contain more than two or three disjointed clusters of ROI as seen for the stomach, but with an increased number of disjointed clusters of ROI per image slice, as seen for the small bowel, seed points ordering become a challenge leading to erroneous segmentation. Conversely, the thresholding-in-3D approach is suitable for multiple disjointed clusters of ROI but is disrupted by variation in image intensity within ROI (e.g., air and liquid) and also when adjacent structures have similar image intensities as that of ROI. Thus the two methods are complementary for imaging of 3D morphology of different GI organs.
The major limitation of all image analysis systems is that no single technique can provide image segmentation and 3D reconstruction of all possible ROIs. The semiautomatic image analysis platform provides a toolbox of complementary techniques that can be used to assess the complex 3D structure and 4D function of GI organs such as the stomach and small intestine. A further limitation is that some experience is required to select the orientations of the virtual MR image planes for obtaining sufficient numbers of seed points distributed homogeneously along the edge of the ROIs. However, it quickly becomes easy to visualize the orientation of the virtual planes and how these intersect with the ROIs throughout the 2D image stack. User input is also required to set parameters (e.g., the upper and lower limit threshold of the image intensity) that facilitate segmenting the virtual image. Variation in these parameters can subtly alter the shape and size of the 3D reconstruction; however, the impact of these choices on measurements of gastric function is small and was not formally assessed. Finally it should be noted that the number of manual clicks and the time reported for image processing of gastric MRI data by the semiautomatic and manual approaches was not recorded by the computer. Reported results are estimates; however, the savings in time and work are large and formal statistical analysis would only serve to emphasize this.
In summary, the semiautomatic image analysis system enables rapid processing of the large amounts of data that are produced during studies of GI function. Reconstructions in 3D and 4D made it possible to visualize gastric accommodation and emptying with far greater spatial resolution than established technologies such as scintigraphy, barostat, or SPECT (31). The sequence of 3D images captures the volumetric changes in the stomach during and after infusion of an 800-ml test meal in a normal subject (Fig. 6). The corresponding total gastric volumes and gastric content volumes of the stomach are given in Table 1. A characteristic rise and fall in gastric volume after meal infusion is present. This reflects the dynamic balance between meal volume, secretion volume, and gastric emptying over time (16, 18, 22). Further analysis provides novel information concerning the tonic relaxation and contraction of the proximal and distal stomach and how the distribution of gastric contents changes during gastric accommodation and emptying (4). By using the same image analysis approach it is possible also to observe the intragastric distribution of medications or labeled nutrient within the stomach (33). To date the application of dynamic MR studies of GI function has been limited by the practical demands and time required for data analysis; however, with the introduction of this rapid and accurate system the time required to assess gastric function could be reduced to that of other applications (e.g., MR angiography) performed in clinical practice (26). The 3D images provided by this system also visualize the morphology of GI organs that are difficult to appreciate from 2D cross-sectional images. The pilot data from the small bowel demonstrate that the semiautomatic image analysis platform can be adapted without difficulty to assess even the most complex of organs (Fig. 8). This is of value because we know even less about the structure and function of mid and lower GI tract than we do about the stomach. Ultimately it is hoped that the availability of this technology will realize the potential of MRI also for the diagnosis of conditions characterized by abnormal GI structure and function. Insight into the causes of symptoms and disease from dynamic 3D images of the stomach and other organs may help guide rational clinical management and promote the development of new, more effective medical and surgical treatments.
GRANTS
S. Banerjee, S. Dixit, and A. Pal were supported by the Indian Institute of Technology Kanpur. M. Fox was supported by the NIHR Nottingham Digestive Diseases Centre. The collaboration between our centers was supported by an International Exchange grant from the Royal Society, UK.
DISCLOSURES
No conflicts of interest, financial or otherwise, are declared by the author(s).
AUTHOR CONTRIBUTIONS
S.B., S.D., M.F., and A.P. conception and design of research; S.B., S.D., and A.P. analyzed data; S.B., M.F., and A.P. interpreted results of experiments; S.B. and A.P. prepared figures; S.B. and A.P. drafted manuscript; S.B., M.F., and A.P. edited and revised manuscript; S.B., S.D., M.F., and A.P. approved final version of manuscript.
ACKNOWLEDGMENTS
We are grateful for the assistance in acquiring the MR images and for the critical review and edits provided by Andreas Steingoetter and Jelena Curcic.
S. Banerjee is currently serving as Assistant Professor at the National Institute of Technology Agartala, Agartala, Tripura, India.
M. Fox is currently serving as Professor of Gastroenterology and Lead Consultant at the Center for Reflux and Swallowing Disorders, Functional GI Diagnostics Laboratory, Division of Gastroenterology and Hepatology, University Hospital Zürich, Zürich, Switzerland.
S. Dixit is currently serving as Research Associate at the Biological Sciences Department, Sunnybrook Hospital, Toronto, Canada.
Appendix
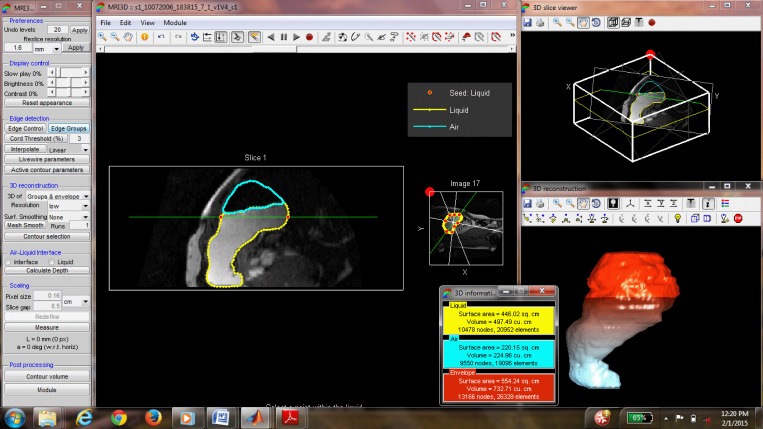
Figure A1 shows a screenshot of the graphical user interface developed with MATLAB R2009a (MathWorks). The mathematical details of the image analysis algorithms described under methods is presented below.
Fig. A1.
Screenshot of the graphical user interface of the 3D image analysis.
Ray Search Technique
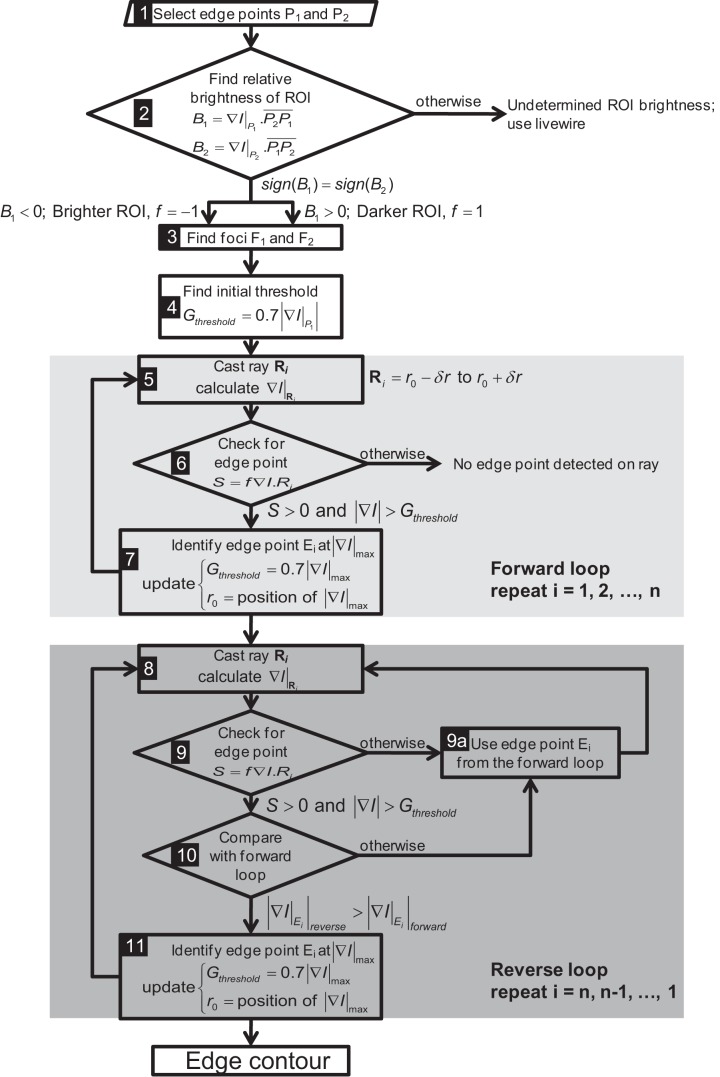
Figure A2 shows the flowchart of the ray search algorithm. Following two clicks by the user to identify two edge points (P1 and P2 in Fig. 2), rest of the steps are performed completely automatically. First the relative brightness of the ROI is calculated by step 2 (Fig. A2). Then the foci F1 and F2 are generated such that P̄1F1 = P̄2F2 = 0.2P̄1P2. A preliminary analysis showed that the ellipticities (ratio of major to minor axes a/b of an approximate ellipse) of the gastric contours are typically in the range of 1.2–1.7. The foci of an ellipse are at a distance of d = a from the nearest major axis ends. For a/b = 1.667, d/a = 0.2, which is the value used to identify the foci when there is no prior knowledge of the ellipticity of the ROI.
Fig. A2.
Flow chart of the algorithm of ray search segmentation.
Following selection of two points by mouse click on the edge of the ROI, it is determined whether the contour is darker or brighter. The pattern of image intensity changes along a set of points on P1P2 around P1 and P2 starting from inside the ROI dictates the nature of the ROI. If the pattern is similar and it moves from high intensity inside the ROI to low intensity outside, then it is termed as brighter ROI, and vice versa. In these cases the rays are cast from the foci of the ellipse to detect the edges based on the criteria given as
| (A1) |
where ∇I is the gradient of image intensity, f = ±1 for brighter and darker ROIs, respectively, and Gthreshold = 0.7|∇I|max of the last identified edge point; i designates number of rays cast. The search along a ray is limited by using dynamically updated information about the last edge point to avoid the edge detection of neighboring organs.
On the other hand, if the pattern of changes in intensity value for the two points does not match, then it indicates that the ROI contains both bright and dark regions, which is not unusual for an organ like the stomach. In that case, it is advised to use other segmentation method or to detect edges of the darker and brighter ROI separately. However, in that case the algorithm treats the ROI as the darker one and detects the edge.
Using condition A1, the edge contour is generated in two passes. In the first pass, forward loop, edge points i = 1, . . ., n are identified sequentially. The next “reverse loop” pass confirms the edge point sequentially from i = n, . . ., 1. This is done to avoid potential error in specifying threshold magnitude of intensity gradient Gthreshold. To find edge point Ei, during forward loop Gthreshold = 0.7|∇I|Ei−1, but during reverse loop Gthreshold = 0.7|∇I|Ei+1. As a result, an edge point that may not satisfy condition A1 in forward loop may be identified in the reverse loop or vice versa. Factor 0.7 allows 30% variability in intensity gradient between successive edge points. In Fig. 2, n = 100 rays are cast to find <100 edge points.
In MR studies of GI function, feeding and/or manometry catheter(s) are sometimes introduced into the lumen. The catheter appears within the image and may disrupt the ray search. Such objects can be identified and selected by additional mouse clicks (black squares in Fig. 2) after the two clicks for selecting P1 and P2 (step 1 in Fig. A2), following which the boundary of the object is detected by using a similar algorithm in which rays are cast radially from the clicked points and condition A1 is applied. Then the edge points within the object boundary are selectively ignored by the algorithm. This additional step is incorporated in both steps 6 and 9.
The ray search algorithm fails when the relative brightness of the ROI is not determinable (step 2 in Fig. A2) or the ROI has high concavities. In these cases livewire can be used for segmentation. Therefore the ray search algorithm is less robust compared with livewire. However, the computational expense of the ray search algorithm is significantly less compared with the livewire algorithm. In livewire, calculation of the cost function using the graph search method is computationally expensive, especially with high-resolution images, making the process slow. Therefore the ray search algorithm provides an easier and faster alternative to livewire segmentation requiring minimal user input.
Livewire Segmentation
Livewire segmentation is based on a graph searching algorithm in which the optimal path between a start node and a set of goal nodes is found out, with each pixel of the image considered as a node. The minimum cumulative cost path from a start pixel to a goal pixel is defined to be the optimal path, where cumulative cost of a path is the sum of local costs of the links or edges connecting the start and end two pixels. Since the goal is to find the edge of a particular ROI in an image, the minimum cost path is set to be the path (i.e., connected pixels) showing strong edge features. So these paths should have low local cost. Local costs are computed as a weighted sum of different metrics of spatial variation in image intensity.
Letting lc(a,b) represent the local cost on the directed link from pixel a to a neighboring pixel b, the local cost function (lc) is
| (A2) |
where FL, FG, and FR are the functional for Laplacian zero-crossing, gradient magnitude, and gradient direction, respectively, and the w's are the corresponding weighing factors.
The Laplacian zero-crossing is a binary edge feature that approximates the second partial derivative of the image. If PL(b) is the Laplacian of an image P at pixel b, then
| (A3) |
Laplacian zero-crossing, being binary in nature, detects edges but does not distinguish between strong high-gradient edges and weak, low-gradient edges. However, a direct correlation between edge strength and local cost is provided by gradient magnitude (G) given by
| (A4) |
where Px and Py represent the partial derivatives of an image P in x and y, respectively.
To produce low cost for high-gradient magnitude, G is scaled and inverted to generate FG such that
| (A5) |
which is further normalized by Euclidean distance.
To account for sharp changes in boundary direction a functional of gradient direction is also incorporated in lc. The unit vector defined by Px and Py is called gradient direction. If R(a) is the unit vector normal (rotated clockwise) to the gradient direction at point, then
| (A6) |
where
Here E(a,b) is the edge vector between pixels a and b. The edge vector or link between neighboring pixels can be horizontal, vertical, or diagonal in direction.
A two-dimensional dynamic programming based on optimal graph search algorithm called Dijkstra's theorem calculates the local cost map, and after minimum cost paths are computed to all pixels the lowest cost path from start pixel to goal pixel are found out.
Algorithm of Magnetic Linking for Seed Point Ordering
Magnetic linking procedure involves a virtual “magnetic force” F = −f∇I where f = ±1 for brighter or darker ROI, respectively, and ∇I is the gradient of image intensity. The force is evaluated at interior seed points that are not part of the convex hull polygon encompassing the seed points. The virtual magnetic force can attract or repel any side toward or away from the corresponding interior seed point depending on the direction of the force relative to the location of the sides of the polygon. In Fig. 3, sides a–b, b–d, and d–e are attracted to the interior seed point c, but sides e–f and f–a are repelled from it. Ignoring any elastic tension within the side and using the equation of motion d2s/dt2 = F, the time required for a side to reach the attracting point is t = , where s is the position vector of the point of intersection of the side and the line of action of the force F relative to the attracting seed point. Time t is calculated for sides having an attracting force from an interior seed point only. If the point of intersection of the side and the line of action of force F lies outside the side, the position vector of the nearest vertex of the side relative to the attracting seed point is used as s. The minimum value of t, tmin for each interior seed point is tabulated and the interior seed point with smallest tmin is used to split the corresponding side provided that the two newly generated sides (e.g., b–c and c–d in Fig. 3) do not intersect any nonneighboring sides (e.g., e–f and d-a in Fig. 3). The algorithm was tested with real images as well as computer-generated images of high degree of complexity.
Dynamic Automatic Processing
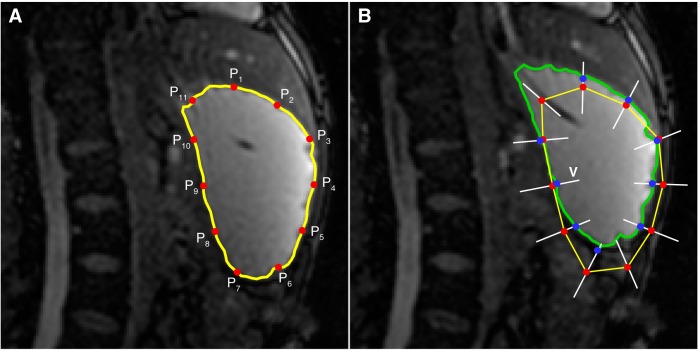
Following segmentation of one set of images, the preceding and succeeding stacks of images are segmented automatically by fitting 8–12 interpolated edge points from reference image to the current image followed by livewire segmentation using these as seed points. The method is illustrated in Fig. A3. The interpolated points (P1–P11 in Fig. A3A) from the reference image are copied to the current image (red circles in Fig. A3B). Then these points are fitted by applying a search along the equal bisector (V) of the vertex angles. The coefficients of correlation C of pixel intensities surrounding a point Pi (xp, yp) in the reference image Ir and points (x*, y*) spaced 1 pixel apart along V in the current image Ic are calculated using
| (A7) |
Fig. A3.
Illustration of the dynamic autoprocessing methodology. The segmented contour (yellow) from the reference image (A) is interpolated linearly to generate 11 points (P1–P11) to be fitted on the current image (B). By search for best match along equal bisector lines (white lines V) of the vertex angle the points are “fitted” (blue circles in B) to the current image. The ROI is then segmented (green contour) by livewire by using the fitted points as seed points.
where and are average pixel intensities. In Eq. A7 pixel intensities from a box of size (2N+1)×(2N+1) are used to compare the reference and the current image. The point on V at which C is highest and the direction of the intensity gradients ∇Ir and ∇Ic in reference and current images, respectively, are similar (i.e., ∇Ir.∇Ic > 0) is the “fitted” location (blue circles) of a point Pi in the current image. To ensure that the algorithm only uses well-fitted points, 20% of the points with lowest coefficients of correlation are eliminated (e.g., points P6 and P11 in Fig. A3B). Among the remaining points, if the lowest coefficient of correlation is below 0.8 an alert for verification of the data is raised. Then the livewire algorithm completes segmentation of the ROI automatically using the fitted seed points.
REFERENCES
- 1.Ailiani AC, Neuberger T, Brasseur JG, Banco G, Wang Y, Smith NB, Webb AG. Quantitative analysis of peristaltic and segmental motion in vivo in the rat small intestine using dynamic MRI. Magn Reson Med 62: 116–126, 2009. [DOI] [PubMed] [Google Scholar]
- 2.Ajaj W, Goehde SC, Papanikolaou N, Holtmann G, Ruehm SG, Debatin JF, Lauenstein TC. Real time high resolution magnetic resonance imaging for the assessment of gastric motility disorders. Gut 53: 1256–1261, 2004. [DOI] [PMC free article] [PubMed] [Google Scholar]
- 3.Ajaj W, Thomas L, Papanikolaou N, Holtmann G, Goehde SC, Ruehm SG, Debatin JF. Real-time high-resolution MRI for the assessment of gastric motility: pre- and postpharmacological stimuli. J Magn Reson Imaging 19: 453–458, 2004. [DOI] [PubMed] [Google Scholar]
- 4.Banerjee S, Fox MR, Kwiatek MA, Steingoetter A, Schwizer W, Pal A. Regional variation of gastric accommodation and emptying: a study using 3D model developed from non-invasive magnetic resonance imaging (MRI) (Abstract). Gastroenterology 142: S308, 2012. [Google Scholar]
- 5.Barrett WA, Mortensen EN. Interactive live-wire boundary extraction. Med Image Anal 1: 331–341, 1997. [DOI] [PubMed] [Google Scholar]
- 6.Bharucha AE, Karwoski RA, Fidler J, Holmes DR 3rd, Robb RA, Riederer SJ, Zinsmeister AR. Comparison of manual and semiautomated techniques for analyzing gastric volumes with MRI in humans. Am J Physiol Gastrointest Liver Physiol 307: G582–G587, 2014. [DOI] [PMC free article] [PubMed] [Google Scholar]
- 7.Bharucha AE, Manduca A, Lake DS, Fidler J, Edwards P, Grimm R, Zinmeister AR, Riederer SJ. Gastric motor disturbances in patients with idiopathic rapid gastric emptying. Neurogastroenterol Motil 23: 617–e252, 2009. [DOI] [PMC free article] [PubMed] [Google Scholar]
- 8.Carbone SF, Tanganelli I, Capodivento S, Ricci V, Volterrani L. Magnetic resonance imaging in the evaluation of the gastric emptying and antral motion: feasibility and reproducibility of a fast not invasive technique. Eur J Radiol 75: 212–214, 2010. [DOI] [PubMed] [Google Scholar]
- 9.Cong G, Parvin B. An algebraic solution to surface recovery from cross-sectional contours. Graph Models Image Proc 61: 222–243, 1999. [Google Scholar]
- 10.Curcic J, Fox M, Kaufman E, Forras-Kaufman Z, Hebbard GS, Roy S, Pal A, Schwizer W, Fried M, Treier R, Boesiger P. Gastroesophageal junction: structure and function as assessed by using MR imaging. Radiology 257: 115–124, 2010. [DOI] [PubMed] [Google Scholar]
- 11.Curcic J, Roy S, Schwizer A, Kaufman E, Forras-Kaufman Z, Menne D, Hebbard GS, Treier R, Boesiger P, Steingoetter A, Fried M, Schwizer W, Pal A, Fox M. Abnormal structure and function of the esophagogastric junction and proximal stomach in gastroesophageal reflux disease. Am J Gastroenterol 109: 658–667, 2014. [DOI] [PubMed] [Google Scholar]
- 12.de Berg M, Cheong O, van Kreveld M, Overmars M. Computational Geometry: Algorithms and Applications (3rd ed.). Berlin: Springer, 2008. [Google Scholar]
- 13.Fidler J, Bharucha AE, Camilleri M, Camp J, Burton D, Grimm R, Riederer SJ, Robb RA, Zinsmeister AR. Application of magnetic resonance imaging to measure fasting and postprandial volumes in humans. Neurogastroenterol Motil 21: 42–51, 2009. [DOI] [PMC free article] [PubMed] [Google Scholar]
- 14.Fruehauf H, Steingoetter A, Fox MR, Kwiatek MA, Boesiger P, Schwizer W, Fried M, Thumshirn M, Goetze O. Characterization of gastric volume responses and liquid emptying in functional dyspepsia and health by MRI or barostat and simultaneous C-acetate breath test. Neurogastroenterol Motil 21: 697–e637, 2009. [DOI] [PubMed] [Google Scholar]
- 15.Garsed K, Chernova J, Hastings M, Lam C, Marciani L, Singh G, Henry A, Hall I, Whorwell P, Spiller RC. A randomised trial of ondansetron for the treatment of irritable bowel syndrome with diarrhoea. Gut 63: 1617–1625, 2014. [DOI] [PMC free article] [PubMed] [Google Scholar]
- 16.Goetze O, Treier R, Fox M, Steingoetter A, Fried M, Boesiger P, Schwizer W. The effect of gastric secretion on gastric physiology and emptying in the fasted and fed state assessed by magnetic resonance imaging. Neurogastroenterol Motil 21: e725–e742, 2009. [DOI] [PubMed] [Google Scholar]
- 17.Hamarneh G, Yang J, McIntosh C, Langille M. 3D live-wire-based semi-automatic segmentation of medical images. In: Medical Imaging 2005. Image Processing: 13–17 February 2005, San Diego, California, USA, edited by Fitzpatrick JM, Reinhardt JM. Bellingham, WA: SPIE, 2005, p. 1597–1603. [Google Scholar]
- 18.Hoad CL, Parker H, Hudders N, Costigan C, Cox E, Perkins A, Blackshaw P, Marciani L, Spiller RC, Fox M, Gowland P. Measurement of gastric meal and secretion volumes using magnetic resonance imaging. Phys Med Biol 60: 1367–1383, 2015. [DOI] [PMC free article] [PubMed] [Google Scholar]
- 19.Kaufman E, Curcic J, Pal A, Forras-Kaufman Z, Treier R, Schwizer W, Fried M, Boesiger P, Fox M. The structure and function of the gastro-esophageal junction in health and reflux disease assessed by magnetic resonance imaging and high resolution manometry (Abstract). Gastroenterology 136: A-17, 2009. [Google Scholar]
- 20.Kunz P, Crelier GR, Schwizer W, Borovicka J, Kreiss C, Fried M, Boesiger P. Gastric emptying and motility: assessment with MR imaging—preliminary observations. Radiology 207: 33–40, 1998. [DOI] [PubMed] [Google Scholar]
- 21.Kwiatek MA, Fox MR, Steingoetter A, Menne D, Pal A, Fruehauf H, Kaufman E, Forras-Kaufman Z, Brasseur JG, Goetze O, Hebbard GS, Boesiger P, Thumshirn M, Fried M, Schwizer W. Effects of clonidine and sumatriptan on postprandial gastric volume response, antral contraction waves and emptying: an MRI study. Neurogastroenterol Motil 21: 928–e71, 2009. [DOI] [PubMed] [Google Scholar]
- 22.Kwiatek MA, Menne D, Steingoetter A, Goetze O, Forras-Kaufman Z, Kaufman E, Fruehauf H, Boesiger P, Fried M, Schwizer W, Fox MR. Effect of meal volume and calorie load on postprandial gastric function and emptying: studies under physiological conditions by combined fiber-optic pressure measurement and MRI. Am J Physiol Gastrointest Liver Physiol 297: G894–G901, 2009. [DOI] [PubMed] [Google Scholar]
- 23.Marciani L, Cox EF, Hoad CL, Pritchard S, Totman JJ, Foley S, Mistry A, Evans S, Gowland PA, Spiller RC. Postprandial changes in small bowel water content in healthy subjects and patients with irritable bowel syndrome. Gastroenterology 138: 469–477, 477.e1, 2010. [DOI] [PubMed] [Google Scholar]
- 24.Marciani L, Pritchard SE, Hellier-Woods C, Costigan C, Hoad CL, Gowland PA, Spiller RC. Delayed gastric emptying and reduced postprandial small bowel water content of equicaloric whole meal bread versus rice meals in healthy subjects: novel MRI insights. Eur J Clin Nutr 67: 754–758, 2013. [DOI] [PMC free article] [PubMed] [Google Scholar]
- 25.Marciani LYP, Wright J, Moore RJ, Evans DF, Spiller RC, Gowland PA. Echoplanar imaging in GI clinical practice: assessment of gastric emptying and antral motility in four patients. J Magn Reson Imaging 12: 343–346, 2000. [DOI] [PubMed] [Google Scholar]
- 26.Menke J, Larsen J. Meta-analysis: accuracy of contrast-enhanced magnetic resonance angiography for assessing steno-occlusions in peripheral arterial disease. Ann Intern Med 153: 325–334, 2010. [DOI] [PubMed] [Google Scholar]
- 27.Nishino M, Iwata S, Hayakawa K, Kanao S, Morimoto T, Mukaihara S, Hatabu H. Functional evaluation of the postoperative gastrointestinal tract using kinematic MR imaging: quantitative assessment of peristaltic activity. Eur J Radiol 53: 263–267, 2005. [DOI] [PubMed] [Google Scholar]
- 28.Sauter M, Curcic J, Menne D, Goetze O, Fried M, Schwizer W, Steingoetter A. Measuring the interaction of meal and gastric secretion: a combined quantitative magnetic resonance imaging and pharmacokinetic modeling approach. Neurogastroenterol Motil 24: 632–e273, 2012. [DOI] [PubMed] [Google Scholar]
- 29.Schwizer W, Fraser R, Borovicka J, Asal K, Crelier G, Kunz P, Boesiger P, Fried M. Measurement of proximal and distal gastric motility with magnetic resonance imaging. Am J Physiol Gastrointest Liver Physiol 271: G217–G222, 1996. [DOI] [PubMed] [Google Scholar]
- 30.Schwizer W, Maecke H, Fried M. Measurement of gastric emptying by magnetic resonance imaging in humans. Gastroenterology 103: 369–376, 1992. [DOI] [PubMed] [Google Scholar]
- 31.Schwizer W, Steingoetter A, Fox M. Magnetic resonance imaging for the assessment of gastrointestinal function. Scand J Gastroenterol 41: 1245–1260, 2006. [DOI] [PubMed] [Google Scholar]
- 32.Sezgin M, Sankur B. Survey over image thresholding techniques and quantitative performance evaluation. J Electronic Imaging 13: 146–165, 2004. [Google Scholar]
- 33.Sweis R, Kaufman E, Anggiansah A, Wong T, Dettmar P, Fried M, Schwizer W, Avvari RK, Pal A, Fox M. Post-prandial reflux suppression by a raft-forming alginate (Gaviscon Advance) compared with a simple antacid documented by magnetic resonance imaging and pH-impedance monitoring: mechanistic assessment in healthy volunteers and randomised, controlled, double-blind study in reflux patients. Aliment Pharmacol Ther 37: 1093–1102, 2013. [DOI] [PubMed] [Google Scholar]
- 34.van der Voort IR, Schmidtmann M, Kobelt P, Wiedenmann B, Monnikes H. Paroxetin, a selective 5-hydroxytryptamine RE-uptake inhibitor, increases postprandial gastric volumes and decreases symptoms in patients with postprandial distress syndrome (PDS) functional dyspepsia (FD) (Abstract). Gastroenterology 134: A-158, 2008. [Google Scholar]
- 35.Wyss M, Froehlich JM, Patak MA, Juli CF, Scheidegger MB, Zollikofer CL, Wentz KU. Gradient-enhanced volume rendering: an image processing strategy to facilitate whole small bowel imaging with MRI. Eur Radiol 17: 1081–1088, 2007. [DOI] [PubMed] [Google Scholar]


