Abstract
Drug resistance often critically limits the efficacy of molecular targeted drugs. Although pharmacological inhibition of phosphatidylinositol 3-kinase (PI3K) is an attractive therapeutic strategy for cancer therapy, molecular determinants for efficacy of PI3K inhibitors (PI3Kis) remain unclear. We previously identified that overexpression of insulin-like growth factor 1 receptor (IGF1R) contributed to the development of drug resistance after long-term exposure to PI3Kis. In this study, we examined the involvement of basal IGF1R expression in intrinsic resistance of drug-naïve cancer cells to PI3Kis and whether inhibition of IGF1R overcomes the resistance. We found that cancer cells highly expressing IGF1R showed resistance to dephosphorylation of Akt and subsequent antitumor effect by ZSTK474 treatment. Knockdown of IGF1R by siRNAs facilitated the dephosphorylation and enhanced the drug efficacy. These cells expressed tyrosine-phosphorylated insulin receptor substrate 1 at high levels, which was dependent on basal IGF1R expression. In these cells, the efficacy of ZSTK474 in vitro and in vivo was improved by its combination with the IGF1R inhibitor OSI-906. Finally, we found a significant correlation between the basal expression level of IGF1R and the inefficacy of ZSTK474 in an in vivo human cancer panel, as well as in vitro. These results suggest that basal IGF1R expression affects intrinsic resistance of cancer cells to ZSTK474, and IGF1R is a promising target to improve the therapeutic efficacy. The current results provide evidence of combination therapy of PI3Kis with IGF1R inhibitors for treating IGF1R-positive human cancers.
Keywords: Drug resistance, insulin-like growth factor 1 receptor, insulin-like growth factor 1 receptor tyrosine kinase inhibitors, phosphatidylinositol 3-kinase, phosphatidylinositol 3-kinase inhibitors
Advances in our understanding of cancer biology have enabled us to develop molecular targeted drugs for cancer therapy. One possible target for molecular targeted therapy is phosphatidylinositol 3-kinase (PI3K), which represents a family of lipid kinases that phosphorylate phosphatidylinositol.1,2 Among the PI3Ks, class 1A PI3K transduces signals received from activated tyrosine kinase receptors (RTKs) such as epidermal growth factor receptor and insulin-like growth factor 1 receptor (IGF1R) to its downstream effectors including Akt and mammalian target of rapamycin (mTOR), which play fundamental roles in tumor proliferation.3–6 We previously reported ZSTK474 as the first PI3K inhibitor (PI3Ki) showing a potent in vivo antitumor effect.7 Subsequently, several PI3Kis have been reported and some, including ours, are currently in clinical evaluation.8
Drug resistance often critically limits the efficacy and outcome of cancer chemotherapy; this would seem to be true for molecular targeted drugs found to date.9 Drug resistance can generally be categorized as either intrinsic or acquired. For example, cancer cells harboring a gain of function mutation of the KRAS gene show intrinsic resistance to cetuximab.10 In contrast, the acquired resistance to tyrosine kinase inhibitors (TKIs) has been shown to be mediated by several different mechanisms, including the acquisition of a “gatekeeper” mutation in the targeted kinase and the activation of parallel or downstream signaling pathways to circumvent the activity of the drugs.9,11,12 We and others have shown that cancer cells harboring a KRAS mutation showed intrinsic resistance to PI3Kis.13,14 However, cancer cells that acquired the gatekeeper mutation have not yet been found. We previously reported that long-term exposure of cancer cells to ZSTK474 in vitro led to the acquisition of drug resistance to PI3Kis. In that study, we did not detect a gatekeeper mutation in PIK3CA; instead, we found that these cells constitutively expressed IGF1R in high levels and its expression was indispensable for the acquired resistance phenotype.15 IGF1R is one of the RTKs that has been implicated in several types of cancer, including breast, prostate, and lung cancer, and is known to be one of the predominant receptors in mitogenesis, transformation, and protection from apoptosis.16–20 However, it is still unclear whether basal expression of IGF1R in PI3Ki-naïve cells affects their susceptibility to the PI3Ki.
In the present study, we examined the functional involvement of basal IGF1R expression in the intrinsic resistance using cancer cells highly expressing IGF1R. We also examined whether the combination with IGF1R-TKIs improves the efficacy of ZSTK474 on IGF1R-expressing cancer cells in vitro and in vivo. Finally, the relationship of IGF1R expression to the intrinsic resistance was examined using in vitro and in vivo human cancer panels.
Materials and Methods
Cell lines and cell culture
The following cell lines from the JFCR39 cell line set were used in this study: lung cancer, A549; colon cancer, KM12; gastric cancer, MKN28 and St-4; glioblastoma, SNB75; and prostate cancer, PC3.21 Cells were grown in RPMI-1640 (Wako Pure Chemical, Osaka, Japan) supplemented with 1 μg/mL kanamycin and 5% (v/v) FBS (Nichirei Biosciences, Tokyo, Japan) as described previously.13,21 Authentication of cell lines was done by short tandem repeat analysis using PowerPlex16 Systems (Promega, Madison, WI, USA; data not shown).
Drugs
ZSTK474 was synthesized by the Research Laboratory of Zenyaku Kogyo Co., Ltd. (Tokyo, Japan). NVP-BEZ235, OSI-906, and NVP-AEW541 were obtained from Selleck Chemicals (Houston, TX, USA), ChemieTek (Indianopolis, IN, USA) and Cayman Chemical Co. (Ann Arbor, MI, USA), respectively. These compounds were dissolved in DMSO for in vitro experiments.
Immunoblot analysis
Immunoblot assays were carried out on cell extracts as described previously13 using a primary antibody for IGF1R-β (#3018), phosphorylated IGF1R at Tyr1135 (#3918), phosphorylated Akt at Thr308 (#4056) or Ser473 (#4058), phosphorylated ribosomal S6 protein at Ser235/236 (#4858), insulin receptor substrate 1 (IRS1; #2382), phosphorylated IRS1 at Ser636/639 (#2388) (Cell Signaling Technology, Danvers, MA, USA), and phosphorylated IRS1 at Tyr612 (44816G) (Invitrogen, Carlsbad, CA, USA) as the probe. Visualization and quantification of the bound antibody was carried out using an anti-rabbit immunoglobulin secondary antibody labeled with Alexa Fluor 680 (Invitrogen) and the Odyssey Infrared Imaging System (LI-COR Biosciences, Lincoln, NE, USA).
Determination of drug efficacy in vitro
Drug efficacy was assessed as changes in total cellular protein after 48 h of drug treatment using a sulforhodamine B assay. The drug concentration required for a 50% reduction in the net protein increase (GI50) was calculated as described previously.22,23
Assay for RNA interference
The siRNAs against IGF1R (siIGF1R-1 and siIGF1R-2) were purchased from Invitrogen as described previously.15 Cells were transfected with 33.3 nmol/L siIGF1R-1, siIGF1R-2, or Stealth RNAi Negative Control Medium GC Duplex using Lipofectamine 2000 (2 μL). These cells were used for the cell growth assay and for immunoblot analysis as described previously.15
Isobologram analysis
Concentrations of ZSTK474 and IGF1R-TKIs were plotted on the x and y coordinates of the isobologram, respectively. Three isoeffect curves (modes 1, 2a, and 2b) were created according to the method of Steel and Peckham.24 The area enclosed by all three lines represents the “envelope of additivity.” Experimental data points falling to the left of the envelope signify synergy, and those falling to the right of the envelope signify a subadditive relationship.
Animal experiments
Animal care and treatment were carried out in accordance with the guidelines of the animal use and care committee of the Japanese Foundation for Cancer Research. MKN28 xenografts were generated by s.c. inoculation of MKN28 cells in female BALB/c mice (Charles River Laboratories Japan, Yokohama, Japan). The generated tumor fragment of size 3 × 3 × 3 mm was inoculated into each nude mouse. When the tumors reached 100–300 mm3 in size, the mice were randomly divided into four groups consisting of vehicle control, OSI-906 alone, ZSTK474 alone, and the combination of OSI-906 and ZSTK474 (each group containing six mice) (day 0). Mice in single-agent treatment groups were treated orally once a day with either ZSTK474 (200 mg/kg suspended in 5% hydroxypropylmethylcellulose in water) or OSI-906 (20 mg/kg dissolved in 25 mmol/L L(+)-tartaric acid [Wako Pure Chemical]) from day 0 to 15. Mice in the combination treatment group were administered 2 days on/1 day off with OSI-906 (20 mg/kg) and ZSTK474 (200 mg/kg) from day 0 to 15. OSI-906 was given first followed by ZSTK474 4 h later. Tumor volume was monitored as described previously.13
Immunohistochemistry
To examine basal expression of IGF1R protein in a panel of 24 tumor xenografts (JFCR24 xenografts), we used a tissue microarray (TMA) consisting of JFCR24 xenografts.25 Sections (4 μm thick) of the TMA block were deparaffinized in xylene and taken through a series of graded alcohols to water. Antigen retrieval was accomplished through wet autoclave pretreatment (20 min at 121°C) in Cell Conditioning Solution 1 (Ventana Medical Systems, Tucson, AZ, USA). The sections were then incubated with primary antibody against IGF1R (G11; Ventana Medical Systems) for 16 min at 37°C. The EnVision+ system peroxidase method (EnVision+ kit; Dako, Glostrup, Denmark) was used for immunochemical staining of IGF1R with the sections also being counterstained with hematoxylin. Using immunohistochemical staining data for IGF1R, JFCR24 xenografts were divided into three groups: IGF1R-positive group consisting of eight cell lines, NCI-H23, NCI-H460, KM12, HCT-15, MKN28, MKN74, RXF-631L, and LOX-IMVI; IGF1R-negative group consisting of 12 cell lines, A549, DMS273, HCC2998, HCT-116, St-4, MKN1, HBC-4, BSY-1, OVCAR8, SK-OV-3, DU-145, and PC3; and the marginal group consisting of four cell lines, HT-29, MDA-MB-231, OVCAR5, and U251. The representative staining images are shown in Figure S5.
Results
Basal expression levels of IGF1R protein in ZSTK474-naïve human cancer cells and the effect of ZSTK474 on inhibition of PI3K-downstream signaling molecules
To examine whether IGF1R expression is associated with the intrinsic resistance to ZSTK474 in PI3Ki-naïve cancer cells, we assessed by immunoblot analysis the basal expression level of IGF1R protein in each of the JFCR39 cancer cells without ZSTK474 treatment. Most of the cell lines expressed IGF1R at detectable levels (Fig.1a). A significant correlation was observed between IGF1R expression and inefficacy of ZSTK474 (r = 0.41, P = 0.01, Fig.1b) and NVP-BEZ235 (r = 0.45, P = 0.004, data not shown). Of those highly expressing IGF1R, we picked two cell lines, MKN28 and St-4. These cell lines showed modest sensitivity to ZSTK474 (GI50 = 2.2 and 1.8 μmol/L, respectively), compared with SNB75 and PC3 (GI50 = 0.16 and 0.14 μmol/L, respectively), which hardly expressed IGF1R (Fig.2a).
Fig 1.
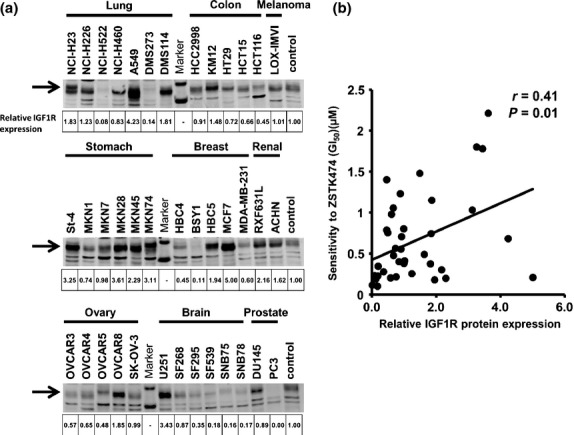
Basal expression levels of insulin-like growth factor 1 receptor (IGF1R) protein and the correlation with intrinsic resistance to ZSTK474 in JFCR39 cell lines. (a) Cells without ZSTK474 treatment were harvested and the expression of IGF1R protein in each of the JFCR39 cell lines was examined by immunoblot analysis. Expression level of IGF1R in each sample was normalized to that in the “control” sample (mixture of lysates prepared from all 39 cells). Quantitative data are median values of three independent experiments; images show representative results. (b) Correlation between GI50 concentrations of ZSTK474 and IGF1R protein expression across the JFCR39 cancer cell lines. Pearson correlation coefficients and P-values were calculated for demonstrating statistical significance.
Fig 2.
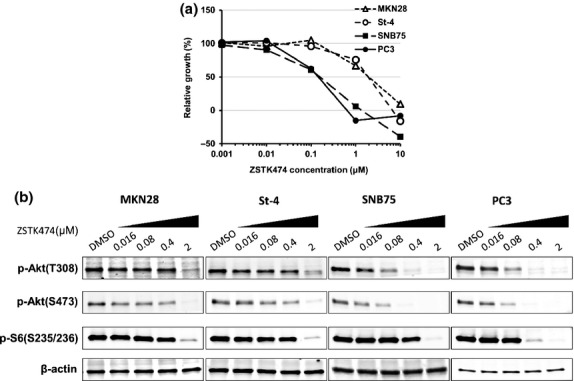
Effect of ZSTK474 on inhibiting cell proliferation and phosphatidylinositol 3-kinase (PI3K)-downstream signaling. (a) Dose–response curves of ZSTK474 in MKN28, St-4, SNB75, and PC3 cells. Cell growth was assessed by sulforhodamine B assay. (b) Activation status of PI3K-downstream signaling molecules in MKN28, St-4, SNB75, and PC3 cells after exposure to ZSTK474. Cells were treated with the indicated concentrations of ZSTK474 for 3 h. Cells were then harvested and immunoblot analysis of phosphorylated (p-)Akt (T308 and S473) and ribosomal S6 protein (S6, S235/236) were carried out.
To examine the effect of ZSTK474 on the PI3K-downstream signaling pathway in these cell lines, we investigated the expression levels of phosphorylated Akt (T308 and S473) after exposure to ZSTK474. In MKN28 and St-4 cells, phosphorylated Akt significantly decreased 3 h after exposure to 2 μmol/L ZSTK474, a dose equal to its GI50. In contrast, in SNB75 and PC3 cells, phosphorylated Akt disappeared after exposure to 0.4 μmol/L ZSTK474 (Fig.2b). The result indicated that cancer cells highly expressing IGF1R showed resistance to dephosphorylation of Akt triggered by ZSTK474 treatment and that the dephosphorylation of Akt is associated with inhibition of cell proliferation.
Knockdown of IGF1R enhances the efficacy of ZSTK474 on inhibition of cell proliferation and PI3K-downstream signaling in intrinsically resistant cancer cells
To investigate the functional involvement of IGF1R overexpression in influencing the sensitivity of cells to PI3Kis, we examined the effect of siRNA-mediated depletion of IGF1R in PI3Ki-sensitive or -resistant cancer cells. Transfection of MKN28 and St-4 cells with IGF1R siRNA effectively reduced the IGF1R protein expression, and concomitantly enhanced the antiproliferating effect of ZSTK474 (Fig.3a,b). Similar results were obtained in other IGF1R-overexpressing human cancer cell lines such as A549 (lung adenocarcinoma) and KM12 (colorectal cancer) (Fig. S1).
Fig 3.
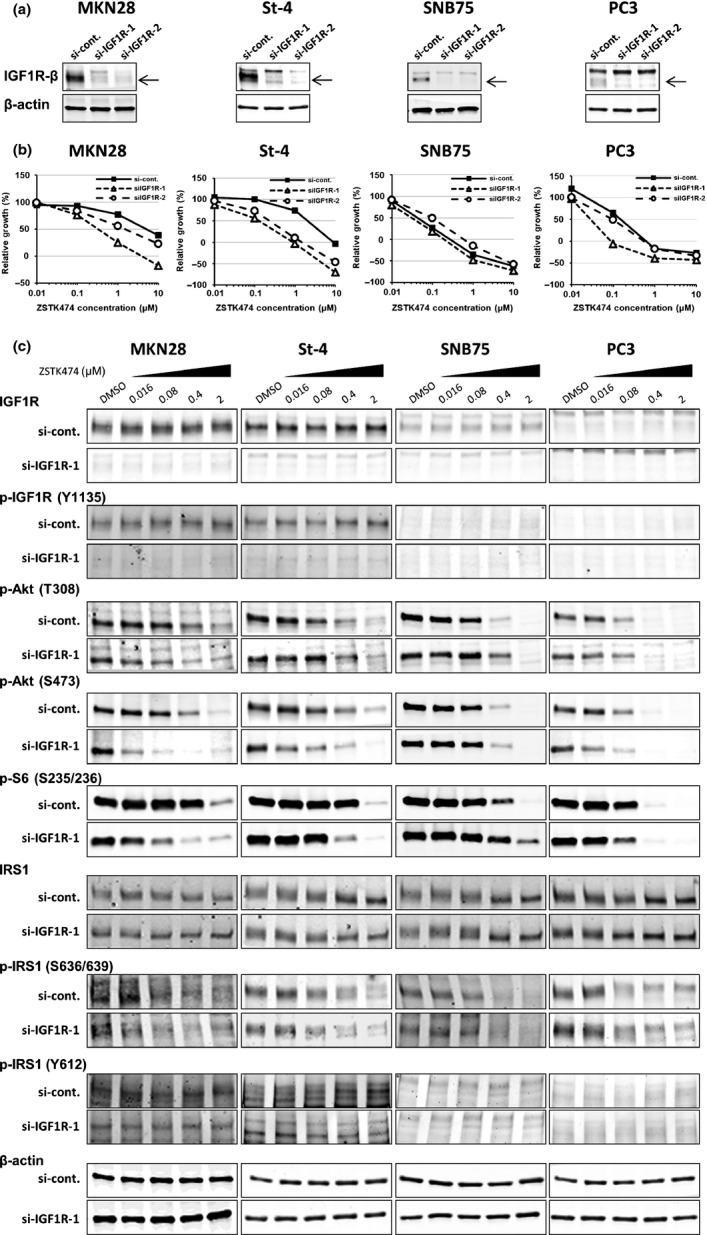
Effect of insulin-like growth factor 1 receptor (IGF1R) siRNAs on activity of ZSTK474 to inhibit cell proliferation and phosphatidylinositol 3-kinase downstream signaling. (a) Knockdown of IGF1R protein expression using IGF1R siRNAs. MKN28, St-4, SNB75, and PC3 cells were transfected with control siRNA (si-cont.) or IGF1R siRNAs (siIGF1R-1 or siIGF1R-2) and the expression of IGF1R protein was measured by immunoblot analysis. (b) Dose–response curves of ZSTK474 against cell growth in MKN28, St-4, SNB75, and PC3 cells after transfection with control siRNA or IGF1R siRNAs. Cell growth was assessed by sulforhodamine B assay. Assays were carried out in duplicate and the data are representative of two independent experiments. (c) MKN28, St-4, SNB75, and PC3 cells were transfected with either control siRNA or IGF1R siRNA, and then exposed to ZSTK474 at the indicated concentrations for 3 h. Cells were then harvested and immunoblot analyses of indicated proteins were carried out.
We next examined the role of IGF1R overexpression on dephosphorylation of Akt and ribosomal S6 protein after exposure to ZSTK474. In MKN28 cells, specific knockdown of IGF1R made it easier to dephosphorylate Akt (T308 and S473) and S6 (S235/S236) by ZSTK474, as compared to control cells (Fig.3c). Similarly, it facilitated dephosphorylation of Akt on S473 and S6 in St-4 cells (Fig.3c). From these results we concluded that overexpression of IGF1R in cancer cells made the PI3K/Akt pathway resistant to inactivation by ZSTK474, which caused intrinsic resistance to ZSTK474.
Effect of ZSTK474 on phosphorylation status of IRS1 protein
IRS1 is a substrate of IGF1R tyrosine kinase, and phosphorylation of IRS1 on multiple tyrosine residues including Y612 is involved in the propagation of the growth signal from IGF1R to PI3K.16,26,27 Moreover, IRS1 is known to be phosphorylated on multiple serine residues by S6K1 upon hyperactivation of the PI3K/mTOR signaling pathway, which mediates feedback suppression of this pathway.27–29 We examined the phosphorylation of IRS1 after treatment with ZSTK474 and found in each of the four cell lines tested, irrespective of IGF1R expression, ZSTK474 triggered dephosphorylation of the S636/639 residues of IRS1, similar to S6 protein, another substrate for S6K1 (Fig.3c). Serine dephosphorylation coincided with an increase in the electrophoretic mobility of total IRS1 protein (Fig.3c).28 Moreover, specific knockdown of IGF1R made it easier to dephosphorylate S636/639 residues by ZSTK474, as compared to control cells, similar to Akt and S6 selectively in MKN28 and St-4 cells highly expressing IGF1R (Fig.3c). In contrast, tyrosine phosphorylation of IRS1 (p-IRS1 (Y612)) was induced by ZSTK474 treatment in St-4 cells (Fig.3c). Interestingly, the expression of tyrosine-phosphorylated IRS1 (p-IRS1 (Y612)) was greatly reduced by specific knockdown of IGF1R in both cell lines highly expressing IGF1R (Fig. S2). The present results indicated that tyrosine phosphorylation of IRS1 was dependent on IGF1R expression in MKN28 and St-4 cells.
Synergistic effect of the combination of ZSTK474 and IGF1R-TKI in intrinsically resistant cancer cells in vitro and in vivo
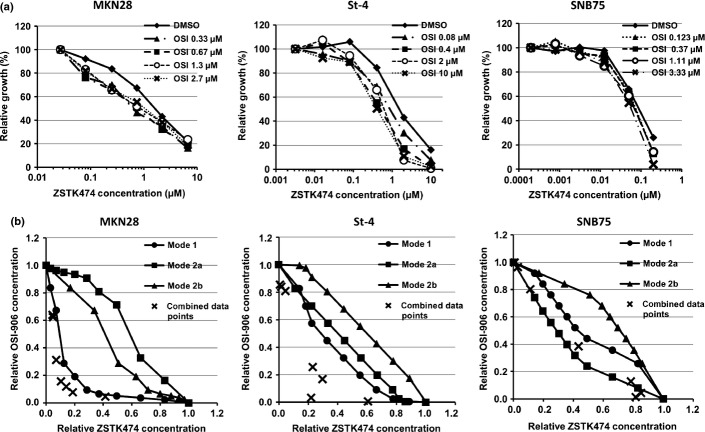
As overexpression of IGF1R seemed to be functionally involved in intrinsic resistance to ZSTK474, we next tested the combination effects of IGF1R-TKI with ZSTK474 in IGF1R-overexpressing cancer cells in vitro. After treatment of MKN28 and St-4 cells with IGF1R-TKI, either OSI-906 or NVP-AEW541, they became more sensitive to ZSTK474 (Figs4a,S3a). Isobologram analysis revealed that the antitumor effect of ZSTK474 in combination with IGF1R-TKI was much greater than their calculated additive effect, thus suggesting that this drug combination has a synergistic effect in these cells (Figs4b,S3b). Similar results were obtained in A549 and KM12 cells overexpressing IGF1R, but not in SNB75 cells, which hardly expressed IGF1R (Figs4,S3,S4).
Fig 4.
Effects of OSI-906 combined with ZSTK474 on cell growth in vitro. (a) Dose–response curves of ZSTK474 against cell growth in the presence or absence of OSI-906. MKN28, St-4, and SNB75 cells were co-treated with the indicated doses of ZSTK474 and OSI-906 for 48 h. Relative growth at each dose of OSI-906 in the absence of ZSTK474 was normalized as 100%. (b) Three isoeffect curves (modes 1, 2a, and 2b) were created according to the method of Steel and Peckham.24 Evaluation of the effects of combining ZSTK474 and OSI-906 by isobologram analysis of the same data as in (a). Assays were carried out in duplicate and the present data are representative of two independent experiments.
To examine the combined effect of IGF1R-TKI with ZSTK474 to IGF1R-overexpressing tumors in vivo, we s.c. implanted MKN28 cells in nude mice and tested the antitumor efficacy of this combination. Combined treatment with OSI-906 and ZSTK474 inhibited tumor growth to a greater extent than treatment with either drug alone (Fig.5a). The combination was also well tolerated as it showed only a modest loss in body weight (Fig.5b). Immunoblot analysis revealed that Akt and S6 were greatly dephosphorylated in samples receiving the combination therapy, as compared to those treated with either drug alone (Fig.5c). These results indicate that the combination of IGF1R-TKI with ZSTK474 is a promising strategy to overcome the intrinsic resistance of PI3Ki-naïve cancer cells overexpressing IGF1R in vivo, as well as in vitro.
Fig 5.
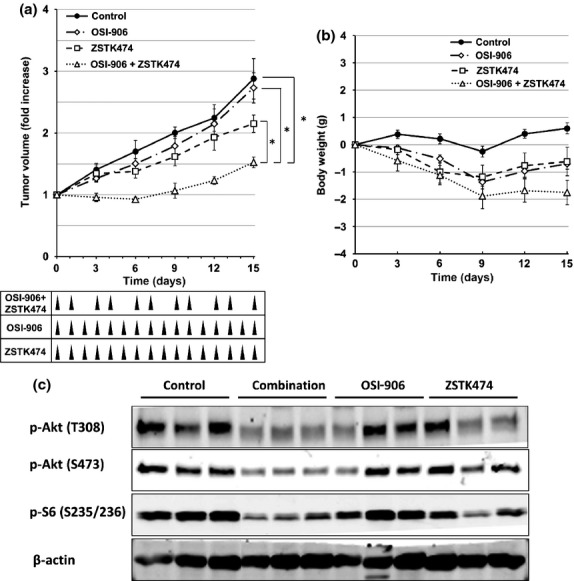
Effects of OSI-906 in combination with ZSTK474 on the tumor growth of MKN28 xenografts in vivo. (a, b) Antitumor effect (a) and body weight change (b) after treatment with vehicle (control, closed circles), OSI-906 (20 mg/kg, open diamonds), ZSTK474 (200 mg/kg, open squares), or the combination of OSI-906 and ZSTK474 (open triangles). Mice bearing MKN28 xenografts in each group were treated for 16 days. Mice in single-agent treatment groups were treated orally once a day with either ZSTK474 or OSI-906 from day 0 to 15. Mice in the combination treatment group were administered 2 days on/1 day off with OSI-906 and ZSTK474 from day 0 to 15. Tumor volumes and mouse weights were measured every 3 days. Data are means ± SE for six mice per group. *P < 0.01, determined by Welch's t-test (two-sided). (c) Activation status of phosphatidylinositol 3-kinase downstream signaling molecules in MKN28 tumor xenografts. The tumors were resected from mice 5 h after the final administration of the experiment on day 15, as shown in (a). Expression levels of phosphorylated (p-)Akt (T308 and S473) and ribosomal S6 protein (S235/236) were examined by immunoblot analysis.
Correlation between intrinsic resistance to PI3K inhibitor and basal expression levels of IGF1R protein in ZSTK474-naïve human cancer xenografts
Thus far, we have shown that basal expression levels of IGF1R correlate with inefficacy of ZSTK474 across the JFCR39 cancer cell line set and overexpression of IGF1R confers intrinsic resistance to ZSTK474 using two IGF1R-overexpressing cancer cell lines, MKN28 and St-4. We next examined whether this correlation is also true in vivo using a panel of 24 human tumor xenografts (JFCR24 xenografts) derived from 24 transplantable cell lines selected from the JFCR39 panel.25 To this end, we measured IGF1R expression in tumor samples by immunohistochemistry using a TMA consisting of JFCR24 xenografts (Fig. S5).25 We found a significant correlation between IGF1R expression and inefficacy of ZSTK474, as determined by treated/control values after drug administration (T/C (%))13 (Fig.6). These results suggest that IGF1R expression is associated with the intrinsic resistance to ZSTK474 in vivo, as well as in vitro.
Fig 6.
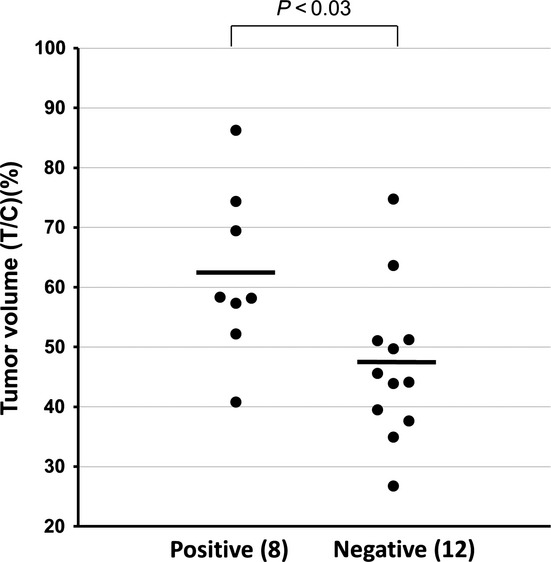
Difference in antitumor efficacy of ZSTK474 between insulin-like growth factor 1 receptor (IGF1R)-positive and -negative ZSTK474-naïve human cancer xenografts. JFCR24 xenografts were divided into three groups: IGF1R-positive group (eight tumors); IGF1R-negative group (12 tumors); and the marginal group (four tumors). In vivo efficacies of ZSTK474 (treated/control [T/C] values [%] after daily treatment with 200 mg/kg for 2 weeks) were determined previously.13 Welch's t-test (two-sided) was used to determine the statistical significance of difference in the T/C values of ZSTK474 in the IGF1R-positive group and those in the IGF1R-negative group.
Discussion
In our previous study, to examine the mechanism of drug resistance of PI3Kis, we established ZSTK474-resistant cancer cell lines from four human cancer cell lines after long-term exposure of cancer cells to ZSTK474. Interestingly, all four cell lines that acquired resistance to ZSTK474 overexpressed IGF1R, and their resistance was overcome by expression knockdown of IGF1R.15 The overexpression of IGF1R seemed to confer resistance to cancer cells through hyperactivation of the PI3K pathway, as we could dephosphorylate Akt and downregulate the pathway by adding ZSTK474 in excess. When we knocked down the expression of IGF1R, we could downregulate the pathway and inhibit cell proliferation by adding ZSTK474 at a similar concentration to that in their parental cell lines. In our current study, similar results were obtained in PI3Ki-naïve cancer cell lines highly expressing IGF1R, such as MKN28 and St-4; they showed resistance to ZSTK474-triggered dephosphorylation of Akt and S6 protein and the subsequent antitumor effect, and the resistance was cancelled by expression knockdown of IGF1R. These results indicate that overexpression of IGF1R could be one of the causes of intrinsic resistance to inhibition of PI3K/Akt signaling and the subsequent antitumor effect induced by ZSTK474 treatment.
Insulin-like growth factor 1 receptor is an RTK, and phosphorylates multiple tyrosine residues of IRS1 to activate PI3K and its downstream signal pathway including Akt, mTOR, and S6K1.16,26 However, hyperactivation of the PI3K/mTOR pathway imposes a negative feedback, which attenuates the PI3K signal through multiple mechanisms. For example, activated S6K1 phosphorylates IRS1 on multiple serine residues.30 The serine-phosphorylated form of IRS1 is known to attenuate the signal from IGF1R to PI3K through inhibition of tyrosine phosphorylation of IRS1 and/or inhibition of tertiary complex formation including IGF1R, PI3K, and IRS1.29,31,32 In the present study, the level of the serine-phosphorylated form of IRS1 was significantly decreased within 3 h of exposure to ZSTK474 in all four cell lines examined, suggesting relief from the negative feedback program. In contrast, the tyrosine-phosphorylated form of IRS1 on Y612 was induced in St-4 cells by ZSTK474 treatment, in accordance with suppression of serine phosphorylation, whereas it remained unchanged in MKN28 cells. In both cell lines, expression knockdown of IGF1R resulted in a reduction in the level of the tyrosine-phosphorylated form of IRS1, it facilitated dephosphorylation of Akt and S6, and sensitized the cells to exposure to ZSTK474. These results strongly suggested that basal expression of IGF1R caused resistance to PI3Kis, via activation of the PI3K/Akt pathway through tyrosine phosphorylation of IRS1. Insulin-like growth factor 1 receptor knockdown facilitated dephosphorylation of Akt on T308 in MKN28 cells, but had minimal effect on T308 residue compared with S473 residue in St-4 cells. It is known that phosphorylation of Akt on S473 and T308 is regulated by different molecules, mTORC2 and PDK1, respectively;4,33 however, it remains to be elucidated why IGF1R knockdown had different effects on dephosphorylation of Akt on these two residues. Of note, we previously showed that IGF1R was overexpressed in cancer cells that acquired resistance to PI3Kis after long-term exposure to ZSTK474 for more than 1 year.15 However, in this study, exposure to ZSTK474 for up to 24 h did not upregulate IGF1R expression in St-4 or MKN28 cells (data not shown), indicating that induction of IGF1R would not be involved in the resistant phenotype.34,35
In recent years, development of predictive biomarkers as companion diagnostics for molecular targeted drugs has become an important requirement.36–38 However, there are no clinically validated biomarkers for predicting the therapeutic efficacy of PI3Kis. In this study, we showed that the basal expression level of IGF1R had a significant correlation with inefficacy of ZSTK474 across the JFCR39 cell lines in vitro, and the JFCR24 xenografts in vivo, suggesting that IGF1R expression could be a predictive biomarker for ZSTK474 inefficacy in PI3Ki-naïve cancer cells. We also showed that the combination of ZSTK474 with OSI-906 is effective for treating IGF1R-overexpressing cancers in vitro and in vivo. Combination therapy of a PI3Ki, BYL-719, with an anti-IGF1R antibody, ganitumab, is under clinical trial for treating breast cancers harboring a PI3K hotspot mutation (https://clinicaltrials.gov/ct2/show/NCT01708161). Another example of combination therapy using a PI3K pathway inhibitor and an IGF1R-TKI is everolimus and OSI-906 for patients with refractory metastatic colorectal cancer (https://clinicaltrials.gov/ct2/show/NCT01154335). In these studies, no biomarkers for patient selection were identified except PIK3CA mutation. In the present study, we showed that the combination of ZSTK474 and OSI-906 is effective for tumor cells highly expressing IGF1R, irrespective of the mutation status of the PIK3CA gene. We expect that this combination would be a promising therapy for treating tumors expressing IGF1R. In regard to other RTKs including epidermal growth factor receptor and human epidermal growth factor receptor 2 and 3 proteins, no significant correlation with the efficacy of ZSTK474 across the JFCR39 cell line set was observed in our previous study.13 Moreover, none of these RTKs except IGF1R were upregulated in the cancer cells that acquired resistance to ZSTK474.15 These observations strongly suggested that IGF1R is a unique RTK gene that could be used as a predictive biomarker for inefficacy to PI3K inhibitors.
We found that the combination of IGF1R inhibitor and ZSTK474 was superior to single agents in IGF1R-positive cancer cells in vivo. In this experiment, we observed non-negligible body weight loss in the combination treatment group compared to the single agent treatment groups. Although the body weight of mice in the combination treatment group stopped falling on day 9 in our preclinical model, the safety of the combination therapy will become an issue in the future, to develop the therapeutic strategy for treating human cancer patients.
In summary, we have shown that PI3Ki-naïve cancer cells highly expressing IGF1R exhibited resistance to ZSTK474, but combining ZSTK474 with an IGF1R-TKI exerted a significant therapeutic response in such cancer cells, compared to each drug alone. Moreover, the relationship of IGF1R expression to the intrinsic resistance was found using in vitro and in vivo human cancer panels. These observations will be of use for determining therapeutic strategies for treating IGF1R-positive human cancers.
Acknowledgments
This work was supported in part by The National Cancer Center Research Development Fund (23-A-15 and 26-A-5) to S. Dan.
Disclosure Statement
Shingo Dan (2012, 2013, and 2014) and Takao Yamori (2010 and 2011) have a research fund from Zenyaku Kogyo Co., Ltd., which is the proprietary company of ZSTK474; Sho Isoyama, Hisashi Yoshimi, and Nachi Namatame are employees of Zenyaku Kogyo Co., Ltd.
Supporting Information
Additional supporting information may be found in the online version of this article:
Fig. S1.Effect of insulin-like growth factor 1 receptor (IGF1R) siRNAs on protein expression of IGF1R and sensitivity to ZSTK474 in A549 and KM12 cells.
Fig. S2.Effect of insulin-like growth factor 1 receptor (IGF1R) siRNA on expression of tyrosine-phosphorylated form of IRS1 on Y612 upon treatment with ZSTK474.
Fig. S3.Effects of NVP-AEW541 in combination with ZSTK474 on the cell growth of MKN28, St-4, A549, KM12, and SNB75 cells in vitro.
Fig. S4.Effects of OSI-906 in combination with ZSTK474 on growth of A549 and KM12 cells in vitro.
Fig. S5.Basal expression of insulin-like growth factor 1 receptor (IGF1R) protein in JFCR24 tumor xenografts.
References
- Cantley LC. The phosphoinositide 3-kinase pathway. Science. 2002;296:1655–7. doi: 10.1126/science.296.5573.1655. [DOI] [PubMed] [Google Scholar]
- Engelman JA, Luo J, Cantley LC. The evolution of phosphatidylinositol 3-kinases as regulators of growth and metabolism. Nat Rev Genet. 2006;7:606–19. doi: 10.1038/nrg1879. [DOI] [PubMed] [Google Scholar]
- Samuels Y, Wang Z, Bardelli A, et al. High frequency of mutations of the PIK3CA gene in human cancers. Science. 2004;304:554. doi: 10.1126/science.1096502. [DOI] [PubMed] [Google Scholar]
- Vivanco I, Sawyers CL. The phosphatidylinositol 3-Kinase AKT pathway in human cancer. Nat Rev Cancer. 2002;2:489–501. doi: 10.1038/nrc839. [DOI] [PubMed] [Google Scholar]
- Shepherd PR, Withers DJ, Siddle K. Phosphoinositide 3-kinase: the key switch mechanism in insulin signalling. Biochem J. 1998;333(Pt 3):471–90. doi: 10.1042/bj3330471. [DOI] [PMC free article] [PubMed] [Google Scholar]
- Engelman JA. Targeting PI3K signalling in cancer: opportunities, challenges and limitations. Nat Rev Cancer. 2009;9:550–62. doi: 10.1038/nrc2664. [DOI] [PubMed] [Google Scholar]
- Yaguchi S, Fukui Y, Koshimizu I, et al. Antitumor activity of ZSTK474, a new phosphatidylinositol 3-kinase inhibitor. J Natl Cancer Inst. 2006;98:545–56. doi: 10.1093/jnci/djj133. [DOI] [PubMed] [Google Scholar]
- Shuttleworth SJ, Silva FA, Cecil AR, et al. Progress in the preclinical discovery and clinical development of class I and dual class I/IV phosphoinositide 3-kinase (PI3K) inhibitors. Curr Med Chem. 2011;18:2686–714. doi: 10.2174/092986711796011229. [DOI] [PMC free article] [PubMed] [Google Scholar]
- Daub H, Specht K, Ullrich A. Strategies to overcome resistance to targeted protein kinase inhibitors. Nat Rev Drug Discov. 2004;3:1001–10. doi: 10.1038/nrd1579. [DOI] [PubMed] [Google Scholar]
- Lievre A, Bachet JB, Le Corre D, et al. KRAS mutation status is predictive of response to cetuximab therapy in colorectal cancer. Cancer Res. 2006;66:3992–5. doi: 10.1158/0008-5472.CAN-06-0191. [DOI] [PubMed] [Google Scholar]
- Holohan C, Van Schaeybroeck S, Longley DB, Johnston PG. Cancer drug resistance: an evolving paradigm. Nat Rev Cancer. 2013;13:714–26. doi: 10.1038/nrc3599. [DOI] [PubMed] [Google Scholar]
- Garraway LA, Janne PA. Circumventing cancer drug resistance in the era of personalized medicine. Cancer Discov. 2012;2:214–26. doi: 10.1158/2159-8290.CD-12-0012. [DOI] [PubMed] [Google Scholar]
- Dan S, Okamura M, Seki M, et al. Correlating phosphatidylinositol 3-kinase inhibitor efficacy with signaling pathway status: in silico and biological evaluations. Cancer Res. 2010;70:4982–94. doi: 10.1158/0008-5472.CAN-09-4172. [DOI] [PubMed] [Google Scholar]
- Engelman JA, Chen L, Tan X, et al. Effective use of PI3K and MEK inhibitors to treat mutant Kras G12D and PIK3CA H1047R murine lung cancers. Nat Med. 2008;14:1351–6. doi: 10.1038/nm.1890. [DOI] [PMC free article] [PubMed] [Google Scholar]
- Isoyama S, Dan S, Nishimura Y, et al. Establishment of phosphatidylinositol 3-kinase inhibitor-resistant cancer cell lines and therapeutic strategies for overcoming the resistance. Cancer Sci. 2012;103:1955–60. doi: 10.1111/cas.12004. [DOI] [PMC free article] [PubMed] [Google Scholar]
- Rosenzweig SA, Atreya HS. Defining the pathway to insulin-like growth factor system targeting in cancer. Biochem Pharmacol. 2010;80:1115–24. doi: 10.1016/j.bcp.2010.06.013. [DOI] [PMC free article] [PubMed] [Google Scholar]
- Kojima S, Inahara M, Suzuki H, Ichikawa T, Furuya Y. Implications of insulin-like growth factor-I for prostate cancer therapies. Int J Urol. 2009;16:161–7. doi: 10.1111/j.1442-2042.2008.02224.x. [DOI] [PubMed] [Google Scholar]
- Pollak M. The insulin and insulin-like growth factor receptor family in neoplasia: an update. Nat Rev Cancer. 2012;12:159–69. doi: 10.1038/nrc3215. [DOI] [PubMed] [Google Scholar]
- Gridelli C, Rossi A, Bareschino MA, Schettino C, Sacco PC, Maione P. The potential role of insulin-like growth factor receptor inhibitors in the treatment of advanced non-small cell lung cancer. Expert Opin Investig Drugs. 2010;19:631–9. doi: 10.1517/13543781003767434. [DOI] [PubMed] [Google Scholar]
- Sachdev D. Targeting the type I insulin-like growth factor system for breast cancer therapy. Curr Drug Targets. 2010;11:1121–32. doi: 10.2174/138945010792006816. [DOI] [PubMed] [Google Scholar]
- Yamori T. Panel of human cancer cell lines provides valuable database for drug discovery and bioinformatics. Cancer Chemother Pharmacol. 2003;52(Suppl 1):S74–9. doi: 10.1007/s00280-003-0649-1. [DOI] [PubMed] [Google Scholar]
- Monks A, Scudiero D, Skehan P, et al. Feasibility of a high-flux anticancer drug screen using a diverse panel of cultured human tumor cell lines. J Natl Cancer Inst. 1991;83:757–66. doi: 10.1093/jnci/83.11.757. [DOI] [PubMed] [Google Scholar]
- Yamori T, Matsunaga A, Sato S, et al. Potent antitumor activity of MS-247, a novel DNA minor groove binder, evaluated by an in vitro and in vivo human cancer cell line panel. Cancer Res. 1999;59:4042–9. [PubMed] [Google Scholar]
- Steel GG, Peckham MJ. Exploitable mechanisms in combined radiotherapy-chemotherapy: the concept of additivity. Int J Radiat Oncol Biol Phys. 1979;5:85–91. doi: 10.1016/0360-3016(79)90044-0. [DOI] [PubMed] [Google Scholar]
- Isoyama S, Yoshimi H, Dan S, et al. Development of an immunohistochemical protein quantification system in conjunction with tissue microarray technology for identifying predictive biomarkers for phosphatidylinositol 3-kinase inhibitors. Biol Pharm Bull. 2012;35:1607–13. doi: 10.1248/bpb.b12-00327. [DOI] [PubMed] [Google Scholar]
- Gallagher EJ, LeRoith D. The proliferating role of insulin and insulin-like growth factors in cancer. Trends Endocrinol Metab. 2010;21:610–8. doi: 10.1016/j.tem.2010.06.007. [DOI] [PMC free article] [PubMed] [Google Scholar]
- Copps KD, White MF. Regulation of insulin sensitivity by serine/threonine phosphorylation of insulin receptor substrate proteins IRS1 and IRS2. Diabetologia. 2012;55:2565–82. doi: 10.1007/s00125-012-2644-8. [DOI] [PMC free article] [PubMed] [Google Scholar]
- Mothe I, Van Obberghen E. Phosphorylation of insulin receptor substrate-1 on multiple serine residues, 612, 632, 662, and 731, modulates insulin action. J Biol Chem. 1996;271:11222–7. doi: 10.1074/jbc.271.19.11222. [DOI] [PubMed] [Google Scholar]
- Zick Y. Ser/Thr phosphorylation of IRS proteins: a molecular basis for insulin resistance. Sci STKE. 2005;2005:pe4. doi: 10.1126/stke.2682005pe4. [DOI] [PubMed] [Google Scholar]
- Harrington LS, Findlay GM, Lamb RF. Restraining PI3K: mTOR signalling goes back to the membrane. Trends Biochem Sci. 2005;30:35–42. doi: 10.1016/j.tibs.2004.11.003. [DOI] [PubMed] [Google Scholar]
- O'Reilly KE, Rojo F, She QB, et al. mTOR inhibition induces upstream receptor tyrosine kinase signaling and activates Akt. Cancer Res. 2006;66:1500–8. doi: 10.1158/0008-5472.CAN-05-2925. [DOI] [PMC free article] [PubMed] [Google Scholar]
- Wan X, Harkavy B, Shen N, Grohar P, Helman LJ. Rapamycin induces feedback activation of Akt signaling through an IGF-1R-dependent mechanism. Oncogene. 2007;26:1932–40. doi: 10.1038/sj.onc.1209990. [DOI] [PubMed] [Google Scholar]
- Sarbassov DD, Guertin DA, Ali SM, Sabatini DM. Phosphorylation and regulation of Akt/PKB by the rictor-mTOR complex. Science. 2005;307:1098–101. doi: 10.1126/science.1106148. [DOI] [PubMed] [Google Scholar]
- Chandarlapaty S, Sawai A, Scaltriti M, et al. AKT inhibition relieves feedback suppression of receptor tyrosine kinase expression and activity. Cancer Cell. 2011;19:58–71. doi: 10.1016/j.ccr.2010.10.031. [DOI] [PMC free article] [PubMed] [Google Scholar]
- Chakrabarty A, Sanchez V, Kuba MG, Rinehart C, Arteaga CL. Feedback upregulation of HER3 (ErbB3) expression and activity attenuates antitumor effect of PI3K inhibitors. Proc Natl Acad Sci U S A. 2012;109:2718–23. doi: 10.1073/pnas.1018001108. [DOI] [PMC free article] [PubMed] [Google Scholar]
- Paez JG, Janne PA, Lee JC, et al. EGFR mutations in lung cancer: correlation with clinical response to gefitinib therapy. Science. 2004;304:1497–500. doi: 10.1126/science.1099314. [DOI] [PubMed] [Google Scholar]
- La Thangue NB, Kerr DJ. Predictive biomarkers: a paradigm shift towards personalized cancer medicine. Nat Rev Clin Oncol. 2011;8:587–96. doi: 10.1038/nrclinonc.2011.121. [DOI] [PubMed] [Google Scholar]
- Philip R, Carrington L, Chan M. US FDA perspective on challenges in co-developing in vitro companion diagnostics and targeted cancer therapeutics. Bioanalysis. 2011;3:383–9. doi: 10.4155/bio.11.1. [DOI] [PubMed] [Google Scholar]
Associated Data
This section collects any data citations, data availability statements, or supplementary materials included in this article.
Supplementary Materials
Fig. S1.Effect of insulin-like growth factor 1 receptor (IGF1R) siRNAs on protein expression of IGF1R and sensitivity to ZSTK474 in A549 and KM12 cells.
Fig. S2.Effect of insulin-like growth factor 1 receptor (IGF1R) siRNA on expression of tyrosine-phosphorylated form of IRS1 on Y612 upon treatment with ZSTK474.
Fig. S3.Effects of NVP-AEW541 in combination with ZSTK474 on the cell growth of MKN28, St-4, A549, KM12, and SNB75 cells in vitro.
Fig. S4.Effects of OSI-906 in combination with ZSTK474 on growth of A549 and KM12 cells in vitro.
Fig. S5.Basal expression of insulin-like growth factor 1 receptor (IGF1R) protein in JFCR24 tumor xenografts.


