Abstract
The individual weight loss response to obesity treatment is diverse. Here we test the hypothesis that the weight loss response to the CB1 receptor antagonist rimonabant is influenced by endogenous levels of receptor agonists. We show that baseline anandamide levels and body weight independently contribute to predict the treatment response to rimonabant in rodents, demonstrating that addition of biomarkers related to mode of action is relevant for a personalized health care approach to obesity treatment.
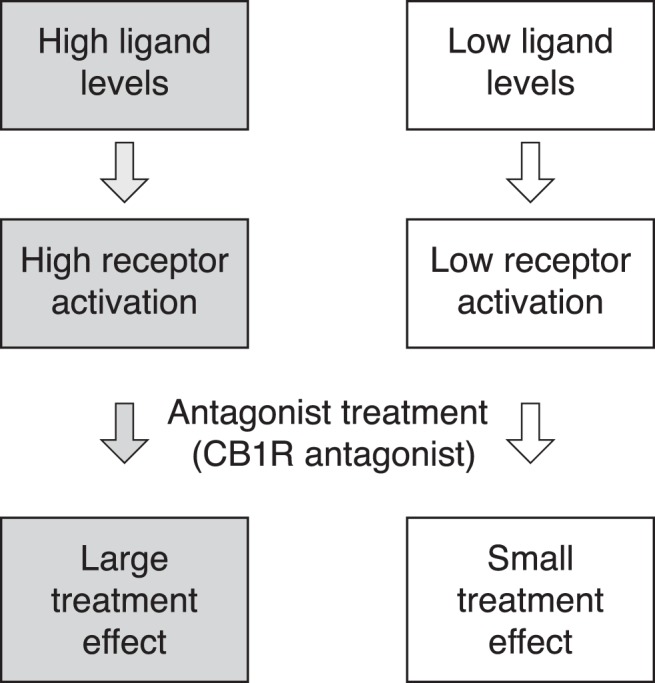
Personalized health care is in its infancy in metabolic disease, despite the fact that there are large individual differences in response to treatment. In contrast, personalized health care is used in clinical practice in oncology, using baseline biomarkers that predict response to treatment. An example is trastuzumab (Herceptin) that targets the HER2 receptor and is approved for use in patients with overexpression of the HER2 receptor (1, 2). In obesity, predictive models for weight loss based on baseline characteristics or early weight loss response to treatment have been investigated (3, 4). However, to our knowledge there are no examples of predictive baseline biomarkers related to the mechanism of drug action in obesity. To explore mechanism of action–related biomarkers, we used rimonabant, a cannabinoid type 1 receptor (CB1R) antagonist. Whereas an overactive endocannabinoid (eCB) system in obesity has been suggested (5), the individual weight loss response to CB1R antagonists is diverse. In the Rimonabant in Obesity (RIO) study, for example, 27.0% lost at least 10% of body weight, but half of the subjects experienced less than 5% weight loss (6). To explore mechanism-specific biomarkers as a means for selecting responders, we hypothesized that the effect of a receptor antagonist would depend on the prevailing endogenous tone of the receptor (Figure 1). The concept was tested in rodents by relating rimonabant-induced weight loss to baseline endogenous ligand levels, ie, the impact of endogenous receptor tone on CB1R weight loss response. Anandamide (N-arachidonoyl-ethanolamide; AEA) and 2-arachidonoylglycerol (2-AG) are the endogenous ligands for the CB1R (7–9). We also included the eCB-related N-acylethanolamines oleoylethanolamide (OEA) and palmitoylethanolamide (PEA). Although these eCB-related lipids have little or no affinity for the CB1R, they may potentiate the effects of eCBs via “entourage” actions (eg, increasing receptor affinity and/or decreasing enzymatic degradation of AEA) and/or, in the case of OEA, counter the eCB effects via an anorexic action (10).
Figure 1.

Illustration of the personalized health care strategy tested in the current study.
Materials and Methods
Animals
Experiments were in accordance with internationally accepted principles for the care and use of laboratory animals and were approved by the Danish Ethical Committee for Animal Research. Male Sprague-Dawley rats (15 diet-induced obesity [DIO] and 15 diet-resistant [DR] rats; Rheoscience) were housed individually with lights on from 5 am to 5 pm at controlled temperature with ad libitum access to water and a high-energy diet (4.41 kcal/g; carbohydrate, 51.4 kcal %; fat, 31.8 kcal %; and protein, 16.8 kcal %; diet 12266B; Research Diets). Rats were 19 to 20 weeks old at the initiation of the study and had been fed a high-energy diet for 15 to 16 weeks. The body weights of the DIO and DR rats before initiation of treatment were 531.4 ± 15.6 and 443.5 ± 5.0 g, respectively. To resemble the situation in humans and to aim for an extended range of body weight responses, the cohort was selected from the same strain of rats enriched for the upper and lower quartiles with respect to weight gain (DIO vs DR subgroups), chosen to add a wide spread within and overlap between baseline weights.
Experimental protocol
The animals received gavage (po; 5 mL/kg) administration of the CB1R antagonist rimonabant [5-(4-chlorophenyl)-1-(2,4-dichlorophenyl)-4-methyl-N-(1-piperidinyl)-1H-pyrazole-3-carboxamide; synthesized at AstraZeneca R&D], at 10 μmol/kg (cf. Ref. 11) daily at 2 pm for 14 days.
Blood samples were handled to minimize release of eCB from blood cells (12), and plasma was stored at −80°C. AEA, 2-AG, OEA, PEA, and rimonabant were analyzed by liquid chromatography–tandem mass spectrometry on a Quattro Premier-XE mass spectrometer (Waters). Plasma (100 μL) was extracted with methyl-tert-butyl-ether/isohexane (50:50, by volume) after addition of deuterated internal standards (Cayman Chemicals). The extract was dissolved in 50% acetonitrile and chromatographed on a HyPURITY C18 column (50 × 2.1 mm, 3 μm) at 0.3 mL/min with a 5-minute linear gradient from 37% acetonitrile, 63% 5 mM ammonium acetate in water, and 0.02% formic acid to 50% acetonitrile, 49% isopropanol, 1% 5 mM ammonium acetate, and 0.02% formic acid. The transitions for multiple reaction monitoring in positive electrospray ionization mode were m/z 348 > 62 for AEA, m/z 356 > 63 for AEA-d8, m/z 326 > 62 for OEA, m/z 300 > 62 for PEA, m/z 304 > 62 for PEA-d4, m/z 379 > 287 for 2-AG, m/z 384 > 287 for 2-AG-d5, and m/z 463 > 363 for rimonabant. Limits of quantification were determined to be 0.5 nM for AEA, OEA, and PEA, 20 nM for 2-AG, and 0.3 nM for rimonabant.
Data and statistics
Adjusted weight loss was calculated as the posttreatment weight, adjusted for natural weight gain, minus baseline weight. Based on historical weight gain curves (Rheoscience) in untreated 19-week-old rats, the natural weight change was estimated to be 3.1 and 1.8 g/d for the DIO and DR rats, respectively. Data from 1 DR rat were omitted because of difficulties in measuring ligand levels in this sample.
Analyses and graphical presentations were done using R (http://www.R-project.org/). Results are presented as means ± SEM unless otherwise stated. Changes in eCB and eCB-related ligand concentrations were tested with paired-sample t tests.
A composite biomarker score was constructed as a linear combination of eCB and eCB-related ligands, body weight at baseline, and interaction terms of the first order. To systematically decide which terms to include in the composite biomarker, we used a branch-and-bound algorithm (R package: Leaps, v2.9). The optimal model (composite biomarker score) was selected using the model with the lowest Bayesian information criterion value.
Results and Discussion
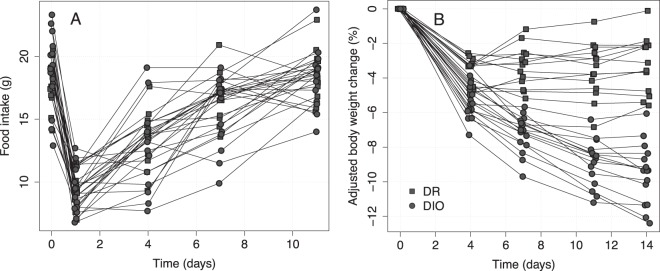
In humans, there are large genetics-derived differences in body weight regulation. To reflect this in our study, we used a cohort of rats from the same general background strain (Sprague-Dawley), but that display a varying propensity to develop diet-induced obesity, with the aim of obtaining a broad range of individual responses to administration of rimonabant. At baseline, the weight and food intake ranges were 392 to 626 g and 12.9 to 23.3 g/d, respectively, and overlapped between the DIO and DR cohort subgroups. The 24-hour food intake after administration of rimonabant, sampled at intervals from day 0 to day 11, is presented in Figure 2A. As expected, the food intake dropped significantly from the baseline upon administration of rimonabant and with time returned to almost baseline levels with no signs of overeating, thus consistent with the concomitant leveling off in body weight loss (13). The individual body weight response to rimonabant treatment ranged from −0.1% to −12.4% at day 14, adjusted for the normal body weight change in untreated rats (Figure 2B; absolute body weights after rimonabant treatment for the DIO and DR rat subgroups were 523.1 ± 13.0 and 453.6 ± 4.3 g, respectively).
Figure 2. Individual measurements of food intake (A) and adjusted body weight change (B) from baseline.

DR and DIO represent the 2 subgroups of the mixed cohort in the study.
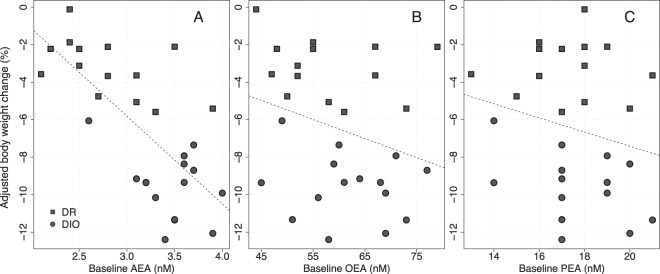
The ranges in plasma levels of eCBs and related ligands were 1.1 to 4.0 nM for AEA, 27 to 179 nM for OEA, and 5 to 83 nM for PEA. Plasma 2-AG easily isomerizes to 1-AG (14), and the “2-AG” analysis data in the literature frequently refer to summed 2-AG + 1-AG sample levels. Because we wished to avoid assumptions regarding the degree of isomerization in individual samples vs origin, we thus chose to be conservative and excluded 2-AG from the mathematical prediction models. The mean AEA, OEA, and PEA concentrations at baseline were 3.1 ± 0.1, 59.9 ± 1.8, and 17.6 ± 0.4 nM, respectively. On average, comparing baseline to end of treatment, AEA, OEA, and PEA levels decreased by 0.9 ± 0.1 nM (P < .0001), 16.2 ± 2.2 nM (P < .0001), and 5.3 ± 0.6 nM (P < .0001), respectively. Both at baseline and after treatment, the AEA levels, but neither the OEA nor PEA levels, were significantly higher in the DIO (3.5 ± 0.1 nM and 2.5 ± 0.1 nM) vs DR (2.8 ± 0.1 nM and 1.9 ± 0.1 nM) subgroup of the study cohort (P < .001, not shown) (cf also Figure 3 and Supplemental Table 1).
Figure 3. Correlation between adjusted body weight change and plasma levels at baseline for AEA (A), OEA (B), and PEA (C).

The dashed lines are the least-squares regression lines. DR and DIO represent the 2 subgroups of the mixed cohort in the study.
To investigate whether the amounts of eCB and eCB-related ligands circulating in the blood were predictive for determining the effect of CB1R antagonist treatment, the correlation between weight reduction in response to rimonabant and ligand plasma concentration at baseline was tested using a simple linear regression model. The baseline level of AEA correlates to the treatment response measured as body weight change during the treatment period (P < .0001, r2 = 0.50) (Figure 3A), whereas the related ligands, OEA and PEA (Figure 3, B and C), did not correlate to the treatment response (P = .14, r2 = 0.08 and P = .27, r2 = 0.05, respectively). AEA levels correlated with body weight at baseline (P < .01, r2 = 0.23).
We also included baseline body weight in the model because a higher baseline body mass index has been associated with greater weight loss (15–17). As expected, the degree of weight change was highly correlated to baseline body weight (BLBW) with a larger body weight reduction in response to rimonabant in rats with higher body weight at baseline. However, although in a model combining BLBW and AEA, BLBW is the strongest predictor for weight change, an F test shows that AEA adds a clearly significant contribution to the predictive power of the model (P < .001). This attests to the prognostic gain by inclusion of a direct target-related marker reflecting the endogenous tone on the CB1 receptor to the overall correlation.
Among the possible subset combinations of AEA, OEA, PEA, and BLBW, to form a composite biomarker, the optimal model having the smallest Bayesian information criterion value and only significant terms could be described by the following model:
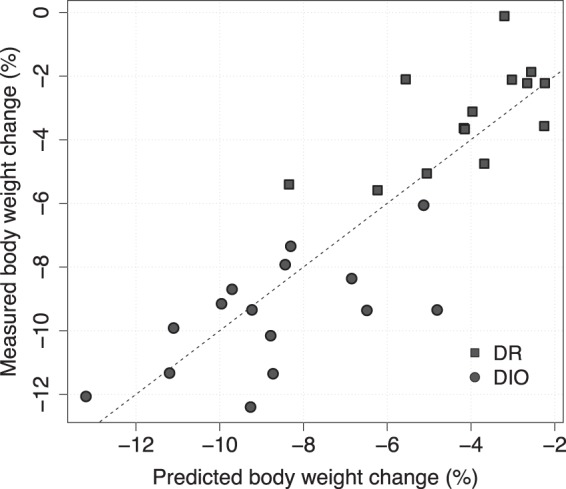
As shown in Figure 4, this model is highly significant (P < .0001, r2 = 0.72).
Figure 4. Measured vs predicted body weight change using the composite biomarker model (P < .0001).

The dashed line is the unity line and corresponds to perfect prediction. DR and DIO represent the 2 subgroups of the mixed cohort in the study.
The present study shows for the first time that baseline levels of the endogenous CB1R ligand AEA may predict the individual body weight response to CB1R antagonist treatment, with a more pronounced weight loss in rats with high AEA levels at baseline. Consistent with previous observations (11) and AstraZeneca unpublished data, we also demonstrated a strong correlation between baseline body weight and response to CB1R antagonist treatment in the rat: the higher starting weight, the more efficacious the outcome of rimonabant medication. This is in line with rimonabant clinical studies, in which the effects appeared greatest in the most obese group of patients, although no individual correlations were presented (17).
We hypothesized that the magnitude of response to treatment with an antagonist would be greater in the presence of high endogenous levels of agonists. This was confirmed, and results demonstrated that baseline levels of AEA and baseline body weight independently contributed to predict the response to rimonabant treatment, providing the first evidence that addition of biomarkers related to the mode of action is relevant for a personalized health care approach to obesity treatment. In addition to its role in energy balance, the eCB system is involved in the regulation of glucose and lipid metabolism (5). Further studies are needed to examine whether circulating endogenous ligand levels may also predict the metabolic benefits of CB1R antagonism. Our findings suggest that a personalized health care strategy in obesity, taking into account the activity of the drug target, here exemplified by the CB1R, merits further investigation.
Acknowledgments
Current address for S.H.: Department of Molecular and Clinical Medicine, Institute of Medicine, The Sahlgrenska Academy at Gothenburg University, SE-413 45 Gothenburg, Sweden; and Department of Radiology, Oncology and Radiation Science, Uppsala University, Academic Hospital, SE-751 85 Uppsala, Sweden.
The study was funded by AstraZeneca and the in vivo part carried out on behalf of the authors by Rheoscience A/S, Rødovre, Denmark.
Disclosure Summary: C.K., M.K., and B.C. are employed by AstraZeneca. S.H. and G.I.H. were previously employed by AstraZeneca. C.K., S.H., M.K., and B.C. have equity interests in AstraZeneca.
Footnotes
- AEA
- anandamide
- 2-AG
- 2-arachidonoylglycerol
- BLBW
- baseline body weight
- CB1R
- cannabinoid type 1 receptor
- DIO
- diet-induced obesity
- DR
- diet-resistant
- eCB
- endocannabinoid
- OEA
- oleoylethanolamide
- PEA
- palmitoylethanolamide.
References
- 1. Cobleigh MA, Vogel CL, Tripathy D, et al. Multinational study of the efficacy and safety of humanized anti-HER2 monoclonal antibody in women who have HER2-overexpressing metastatic breast cancer that has progressed after chemotherapy for metastatic disease. J Clin Oncol. 1999;17:2639–2648. [DOI] [PubMed] [Google Scholar]
- 2. Slamon DJ, Leyland-Jones B, Shak S, et al. Use of chemotherapy plus a monoclonal antibody against HER2 for metastatic breast cancer that overexpresses HER2. N Engl J Med. 2001;344:783–792. [DOI] [PubMed] [Google Scholar]
- 3. Torgerson JS, Carlsson B, Stenlöf K, Carlsson LM, Bringman E, Sjöström L. A low serum leptin level at baseline and a large early decline in leptin predict a large 1-year weight reduction in energy-restricted obese humans. J Clin Endocrinol Metab. 1999;84:4197–4203. [DOI] [PubMed] [Google Scholar]
- 4. Napolitano A, Miller SR, Murgatroyd PR, et al. Prediction of weight loss and regain following dietary, lifestyle, and pharmacologic intervention. Clin Pharmacol Ther. 2012;91:1027–1034. [DOI] [PubMed] [Google Scholar]
- 5. Silvestri C, Di Marzo V. The endocannabinoid system in energy homeostasis and the etiopathology of metabolic disorders. Cell Metab. 2013;17:475–490. [DOI] [PubMed] [Google Scholar]
- 6. Van Gaal L, Pi-Sunyer X, Després JP, McCarthy C, Scheen A. Efficacy and safety of rimonabant for improvement of multiple cardiometabolic risk factors in overweight/obese patients: pooled 1-year data from the Rimonabant in Obesity (RIO) program. Diabetes Care. 2008;31(Suppl 2):S229–S240. [DOI] [PubMed] [Google Scholar]
- 7. Devane WA, Hanus L, Breuer A, et al. Isolation and structure of a brain constituent that binds to the cannabinoid receptor. Science. 1992;258:1946–1949. [DOI] [PubMed] [Google Scholar]
- 8. Mechoulam R, Ben-Shabat S, Hanus L, et al. Identification of an endogenous 2-monoglyceride, present in canine gut, that binds to cannabinoid receptors. Biochem Pharmacol. 1995;50:83–90. [DOI] [PubMed] [Google Scholar]
- 9. Pertwee RG, Howlett AC, Abood ME, et al. International Union of Basic and Clinical Pharmacology. LXXIX. Cannabinoid receptors and their ligands: beyond CB1 and CB2. Pharmacol Rev. 2010;62:588–631. [DOI] [PMC free article] [PubMed] [Google Scholar]
- 10. Borrelli F, Izzo AA. Role of acylethanolamides in the gastrointestinal tract with special reference to food intake and energy balance. Best Pract Res Clin Endocrinol Metab. 2009;23:33–49. [DOI] [PubMed] [Google Scholar]
- 11. Vickers SP, Webster LJ, Wyatt A, Dourish CT, Kennett GA. Preferential effects of the cannabinoid CB1 receptor antagonist, SR141716, on food intake and body weight gain of obese (fa/fa) compared to lean Zucker rats. Psychopharmacology (Berl). 2003;167:103–111. [DOI] [PubMed] [Google Scholar]
- 12. Vogeser M, Hauer D, Christina Azad S, Huber E, Storr M, Schelling G. Release of anandamide from blood cells. Clin Chem Lab Med. 2006;44:488–491. [DOI] [PubMed] [Google Scholar]
- 13. Thornton-Jones ZD, Kennett GA, Benwell KR, et al. The cannabinoid CB1 receptor inverse agonist, rimonabant, modifies body weight and adiponectin function in diet-induced obese rats as a consequence of reduced food intake. Pharmacol Biochem Behav. 2006;84:353–359. [DOI] [PubMed] [Google Scholar]
- 14. Zoerner AA, Gutzki FM, Batkai S, et al. Quantification of endocannabinoids in biological systems by chromatography and mass spectrometry: a comprehensive review from an analytical and biological perspective. Biochim Biophys Acta. 2011;1811:706–723. [DOI] [PubMed] [Google Scholar]
- 15. Ben-Menachem E, Axelsen M, Johanson EH, Stagge A, Smith U. Predictors of weight loss in adults with topiramate-treated epilepsy. Obes Res. 2003;11:556–562. [DOI] [PubMed] [Google Scholar]
- 16. Niswender K, Pi-Sunyer X, Buse J, et al. Weight change with liraglutide and comparator therapies: an analysis of seven phase 3 trials from the liraglutide diabetes development programme. Diabetes Obes Metab. 2013;15:42–54. [DOI] [PubMed] [Google Scholar]
- 17. Sanofi Aventis Advisory Committee. FDA Briefing Document NDA 21-888, Zimulti (rimonabant) Tablets, 20 mg. June 13, 2007. http://www.fda.gov/ohrms/dockets/ac/07/briefing/2007-4306b1-fda-backgrounder.pdf Accessed June 30, 2013.


