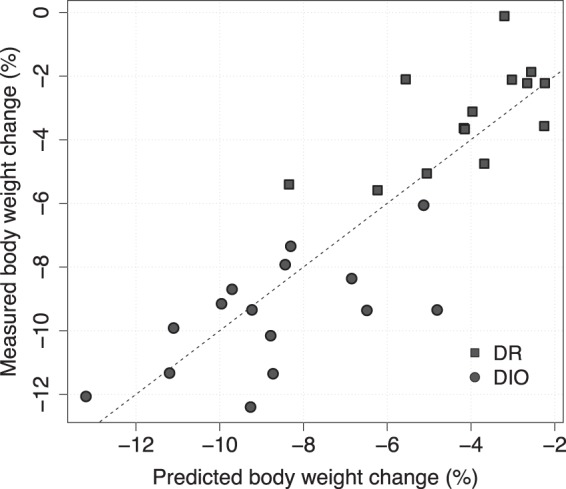
Figure 4. Measured vs predicted body weight change using the composite biomarker model (P < .0001).

The dashed line is the unity line and corresponds to perfect prediction. DR and DIO represent the 2 subgroups of the mixed cohort in the study.

The dashed line is the unity line and corresponds to perfect prediction. DR and DIO represent the 2 subgroups of the mixed cohort in the study.