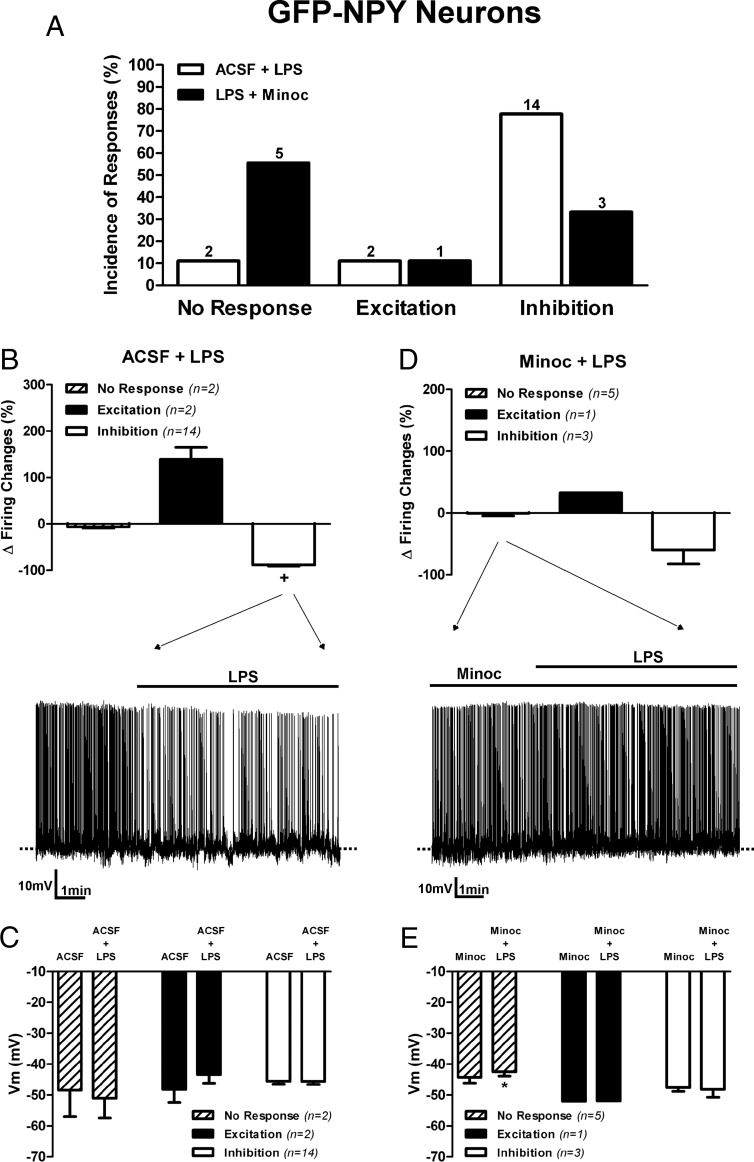
Figure 3. TLR4 activation inhibits most GFP-NPY neurons in mice.
A, Summary of the incidence of ARC GFP-NPY neuronal responses to LPS (10 μg/mL) in the absence or presence of Minoc (100 μM). B, Bar graphs and representative example of the effects LPS on GFP-NPY mean firing activity. C, Mean changes in membrane potential. D, Bar graphs and representative example of the effects LPS in the presence of Minoc on GFP-NPY mean firing activity. E, Mean changes in membrane potential (n = number of neurons). Data are represented as mean ± SEM. +, P < .05 (paired t test within its own group). *, P < .05 compared with Minoc (no LPS) group (paired t test).

