

Abstract
Peptides derived from the proopiomelanocortin (POMC) precursor are critical for the normal regulation of many physiological parameters, and POMC deficiency results in severe obesity and metabolic dysfunction. Conversely, augmentation of central nervous system melanocortin function is a promising therapeutic avenue for obesity and diabetes but is confounded by detrimental cardiovascular effects including hypertension. Because the hypothalamic population of POMC-expressing neurons is neurochemically and neuroanatomically heterogeneous, there is interest in the possible dissociation of functionally distinct POMC neuron subpopulations. We used a Cre recombinase-dependent and hypothalamus-specific reactivatable PomcNEO allele to restrict Pomc expression to hypothalamic neurons expressing leptin receptor (Lepr) in mice. In contrast to mice with total hypothalamic Pomc deficiency, which are severely obese, mice with Lepr-restricted Pomc expression displayed fully normal body weight, food consumption, glucose homeostasis, and locomotor activity. Thus, Lepr+ POMC neurons, which constitute approximately two-thirds of the total POMC neuron population, are sufficient for normal regulation of these parameters. This functional dissociation approach represents a promising avenue for isolating therapeutically relevant POMC neuron subpopulations.
The proopiomelanocortin (Pomc) gene encodes a propeptide that is processed posttranslationally into a number of bioactive peptides, including ACTH, α-, β-, and γ-MSH and β-endorphin (1). Within the brain, Pomc is expressed principally in the arcuate nucleus of the hypothalamus. POMC peptides regulate multiple physiological parameters including appetite, energy expenditure, glucose homeostasis, lipid metabolism, blood pressure (BP), and heart rate (2–8). The critical physiological role of the Pomc gene and its peptide products is demonstrated by the striking obesity and metabolic dysfunction resulting from loss-of-function mutations of Pomc in humans and mice (9, 10). These effects are mediated by hypothalamic neurons expressing Pomc because they can be recapitulated by the hypothalamus-specific disruption of Pomc expression (11, 12). Conversely, melanocortin augmentation causes reduced food consumption, increased energy expenditure, and loss of body weight (13–15). However, melanocortin augmentation also causes potentially adverse physiological effects, including hypertension, tachycardia, and increased sexual drive (4, 5, 16–20).
Hypothalamic POMC neurons are heterogeneous in several respects. They differ from one another in their expression of the neurotransmitters glutamate, γ-aminobutyric acid, and acetylcholine as well as the receptors for leptin, insulin, and serotonin (21–25). Furthermore, different hypothalamic POMC neurons appear to project to distinct target sites within the brain and spinal cord (26–30). The neurochemical and neuroanatomical heterogeneity of POMC neurons, combined with their broad functional repertoire, has led to the postulation of functionally distinct POMC neuron subpopulations. Functional dissociation of these subpopulations may have therapeutic significance. For example, selective activation of POMC neurons or the melanocortin receptors driving hypophagia, increased energy expenditure, and weight loss without simultaneous activation of the subset of POMC neurons or receptors driving hypertension, tachychardia, and sexual arousal might be therapeutically beneficial.
In this study, we used a hypothalamus-specific null reactivatable Pomc allele to restrict hypothalamic Pomc expression to neurons expressing the leptin receptor (Lepr) in mice. Leptin is an adipokine hormone that conveys a feedback signal from adipose tissue and coordinates energy balance and metabolism, partly by direct engagement of LEPR on POMC neurons (31, 32). This approach provides a means to probe the specific function of the Lepr+ POMC neuron subpopulation and serves as a blueprint for further functional dissociation of POMC neuron subpopulations.
Materials and Methods
Animals
PomcdsRED, PomcEGFP, LeprCre, and PomcNEO mice were generated and propagated as previously described on a C57BL/6J genetic background (12, 25, 31, 33). The PomcdsRED and PomcEGFP transgenes have their respective fluorescent protein cDNA, Simian virus 40-polyA signal and transcriptional stop sequence inserted into the 5′ untranslated end of Pomc exon 2 at position +3.2 kb between the intron/exon splice junction and the ATG start codon for POMC translation. The 22.3 kb PomcEGFP transgene includes all genomic sequences from −13.3 kb to +8.0 kb relative to the transcriptional start site in exon 1. Subsequent to generating the PomcEGFP mice, we determined that sequences between −6.8 and −2.1 kb and between +3.2 and +8.0 kb were not necessary for hypothalamic neuron-specific gene expression; therefore, these sequences were deleted to simplify construction of the 13.3 kb PomcdsRed transgene. Our published data indicate that the individual transgenic strains each have greater than 90% coexpression with endogenous POMC in the arcuate nucleus (25, 31, 34). Supplemental Figure 1 shows the colocalization of native Discosoma sp. (ds) Red fluorescence and POMC immunoreactivity in a complete set of serial coronal sections throughout the rostrocaudal length of the medial basal hypothalamus of a PomcdsRED mouse. LeprEYFP mice were generated in like manner to LeprEGFP mice (35) but using a RosaEYFP instead of RosaEGFP reporter mouse line (Jackson Laboratory). All mice were genotyped by PCR using genomic DNA obtained from tail samples and specific oligonucleotide primer pairs. Only female compound heterozygous LeprCre/+; PomcNEO/+ mice bred to male PomcNEO/+ mice were used for the production of PomcLEPR mice because transmission of the two alleles by male breeders uniformly yielded widespread somatic recombination instead of the desired specificity in Lepr neurons.
The mice were group housed, except where noted, in ventilated cages under controlled light (12 hours on/12 hours off) and temperature (21.5–22.5°C) conditions with ad libitum access to drinking water and laboratory chow containing 28.0% kcal protein, 12.1% kcal fat, and 59.8% kcal carbohydrate. All experiments were conducted under approved Institutional Animal Care and Use Committee protocols and followed the Public Health Service guidelines for the humane care and use of experimental animals.
Immunohistochemistry
Mice were deeply anesthetized with tribromoethanol and transcardially perfused with 10% sucrose followed by 4% paraformaldehyde. Brains were extracted, postfixed in 4% paraformaldehyde overnight at 4°C, and then cryoprotected in 30% sucrose in PBS overnight at 4°C. Brains were sectioned either sagitally or coronally on a freezing microtome (Leica SM2010R) at 30 μm thickness. For dual immunofluorescence, free-floating sections were blocked with 1% normal goat serum and 0.1% Triton X-100 for 1 hour. Sections were then incubated with primary antibodies at room temperature overnight [rabbit anti-POMC, 1:1000; Phoenix Pharmaceuticals; chicken anti-green fluorescent protein (GFP), 1:1000; Abcam; rabbit anti-dsRED, 1:1000; Clontech]. After PBS washes, sections were incubated with goat secondary antibodies (conjugated to fluorescein isothiocyanate or Alexa Fluor 568) for 2 hours at room temperature, washed again, and mounted on gelatin-coated slides. Slides were air dried and coverslipped with polyvinyl alcohol mounting medium (Sigma).
For immunohistochemical labeling of phosphorylation of signal transducer and activator of transcription 3 (pSTAT3), a similar protocol was followed but, prior to blocking, endogenous peroxidase activity was depleted with 1% H2O2 in PBS for 30 minutes. A rabbit-anti-pSTAT3 primary antibody (1:250; Cell Signaling) was used followed by a biotinylated donkey anti-rabbit secondary antibody (1:250; Jackson ImmunoResearch). For detection, the Vectastain ABC kit (Vector Labs) was used, followed by development with the metal enhanced diaminobenzidine substrate kit (Thermo Scientific). Slides were dehydrated and coverslipped with dibutyl phthalate in xylene (DPX). Recombinant mouse leptin, a generous gift from Amylin, Inc, was suspended in PBS and administered as a single ip injection of 5 mg/kg body weight 30 minutes prior to perfusion for immunohistochemical detection of pSTAT3.
Sections were imaged on a Nikon 90i fluorescence microscope for quantitative analysis and a Leica SP5 confocal microscope for representative images. Black pSTAT3 diaminobenzidine labeling was false colored for display purposes. For quantitative analysis, four different sections of each brain nucleus per animal were counted. Fiber density analysis was automated in Nikon Elements software by thresholding signal within a region of interest and quantifying the density of thresholded signal as described previously (34). A minimum of four mice per genotype/treatment combination were analyzed.
Physiological assessment
For glucose tolerance tests (n = 5–9 per group), mice were fasted overnight (5:00 pm to 9:00 am). Mice were injected ip with 2 g/kg dextrose. Blood glucose levels were monitored in tail blood with an AlphaTRAK 2 glucose meter (Abbott Laboratories). Area under the curve was calculated with fasting glucose as the baseline. For insulin tolerance tests (n = 4–8 per group), mice were fasted for 6 hours (9:00 am to 3:00 pm) and then injected ip with 0.5 U/kg Humulin R human insulin (Eli Lilly). Blood glucose levels were monitored in tail blood as above. For the analysis of fasting plasma insulin (n = 3–10 per group), tail blood was collected and centrifuged at 4000 rpm for 15 minutes. Plasma supernatant was collected and the Ultra Sensitive mouse insulin ELISA kit (Crystal Chem) was used to quantify insulin content.
For automated metabolic assessment (n = 8 per group), animals were first acclimated to single housing in home cages for 1 week and then tested in the comprehensive lab animal monitoring system (CLAMS) apparatus (Columbus Instruments) for 72 hours. O2 consumption (VO2), CO2 production (VCO2), X activity, and Z activity were collected in 20-minute bins. The final 24 hours of recordings are presented. Subsequent to CLAMS analysis, body composition was measured by nuclear magnetic resonance (Mini-Spec LF90II; Bruker Optics). Cardiovascular function (n = 5–8 per group) was measured with a noninvasive tail cuff plethysmographic recording system (IITC Life Science).
For d-fenfluramine administration studies, male mice (6–7 per group) were acclimated to individual housing for 1 week and to ip injections of 0.9% saline for 2 days and then fasted overnight. Mice were injected ip with 0.9% saline or 5 mg/kg d-fenfluramine (Tocris). Food was provided immediately after injection and consumption was measured after 1 hour. The experimental design was within subjects, with each mouse randomized to receive either saline or d-fenfluramine on the first test day and the opposite treatment on the second test day, with at least 5 days in between each treatment.
Statistical analysis
Differences in Lepr/Pomc coexpression across different anatomical levels were analyzed by ANOVA. For immunohistochemical cell counts and fiber densities, PomcLEPR mice were compared with PomcWT mice by a two-tailed t test. For physiological parameters lean mass, fat mass, food intake, fasting plasma insulin, glucose tolerance test area under the curve (AUC), insulin tolerance test AUC, oxygen consumption, respiratory exchange ratio, X activity, Z activity, systolic BP, and heart rate, PomcNEO and PomcLEPR groups were independently compared with PomcWT by a two-tailed t test. Food consumption in response to d-fenfluramine was analyzed by repeated-measures ANOVA with genotype and drug treatment as the independent variables. For all comparisons, P < .05 was considered significant.
Results
Lepr is expressed in a majority of hypothalamic POMC neurons
Robust detection of endogenous Lepr transcript or LEPR protein in neurons has proven challenging (36, 37). To circumvent this problem, we used LeprEYFP reporter mice. In an additional approach, we used immunoreactivity for leptin-induced pSTAT3 as a sensitive readout of cell-autonomous LEPR activity (38). To identify POMC neurons, we used either POMC precursor immunoreactivity (IR) or two previously validated transgenic reporter lines, PomcdsRED mice (25, 34) and PomcEGFP mice (31). Supplemental Figure 1 shows the overlap of POMC immunoreactivity and native dsRed fluorescence in a complete series of coronal sections throughout the rostrocaudal extent of the hypothalamus from a PomcdsRED mouse. We combined these Lepr and Pomc detection methods in five different permutations and observed that 50%–80% of hypothalamic POMC neurons express Lepr, with the exact proportion dependent on the detection methods used (Figure 1). Furthermore, we observed no regional variation in Lepr/Pomc coexpression along the rostral-caudal axis of the arcuate nucleus (Figure 1, B and C). For visualization of the reference level at −1.34 mm relative to bregma, see panel D.v in Supplemental Figure 1. In addition to the hypothalamus, a small population of neurons in the nucleus of the solitary tract (NTS) in the caudal medulla expresses Pomc (39). We also observed heterogeneity in these neurons, with 30%–40% of them coexpressing Lepr (Figure 1E).
Figure 1. A majority of hypothalamic POMC neurons coexpress Lepr.

A, Representative dual-labeling images of 8-week-old mice showing that some POMC neurons (red) coexpress Lepr (green), resulting in a yellow/orange signal (solid arrowheads), whereas others do not (open arrowheads). Both rostral (−1.46 mm from bregma) and caudal (−1.94 mm from bregma) images of the arcuate nucleus are shown for each combination of labeling techniques. Scale bar, 100 μm. 3V, third ventricle. B and C, Quantification of Lepr expression in POMC neurons at different coronal levels of the hypothalamus, based on labeling Lepr and Pomc, respectively, with pSTAT3 and PomcdsRED (B) or with LeprEYFP and PomcdsRED (C) (n = 4). D and E, Quantification of Lepr expression in POMC neurons throughout the hypothalamus (D) and NTS (E) using different combinations of labeling techniques (n = 4). Data presented as mean ± SEM.
Restricted expression of hypothalamic Pomc in Lepr neurons
To achieve subpopulation-restricted hypothalamic Pomc expression, we used a hypothalamus-specific null reactivatable PomcNEO allele (12). This allele carries a loxP-flanked neomycin resistance transcription-blocking cassette knocked into the hypothalamic Pomc neuron-specific enhancer region located 10–12 kb upstream of the transcriptional start site. Homozygous PomcNEO mice have unaltered pituitary and brainstem Pomc expression but almost undetectable hypothalamic expression (12). Cre-mediated excision of the cassette leads to eutopic expression of the mutant Pomc allele in POMC neurons located in the arcuate nucleus (Figure 2A).
Figure 2. Partial restoration of Pomc expression in PomcLEPR mice.

A, Generation of PomcLEPR mice. LeprCre mice were crossed with PomcNEO mice to selectively restore Pomc expression to Lepr+ neurons. B, Schematic of efferent projections from POMC neurons. Thickness of lines indicates relative density of efferent fibers in target region. C, Representative images of POMC-IR in hypothalamus (sagittal sections, 8 wk old mice) of experimental genotypes. Scale bar, 100 μm. D, Quantification of hypothalamic POMC-IR perikarya from coronal sections (n = 4). E, Representative images of POMC-IR efferent fibers in target regions (sagittal sections, 8 wk old mice). Scale bar, 100 μm. F, Quantification of POMC-IR efferent fiber density in target regions (n = 4). G, PomcLEPR data from panel F expressed relative to PomcWT fiber density. Data are presented as mean ± SEM. *, P < .05. ac, anterior commissure; AMG, amygdala; BST, bed nucleus of the stria terminalis; BSTMV, medial ventral bed nucleus of the stria terminalis; CeA, central amygdaloid nucleus; LPAG, lateral periaqueductal gray; LPO, lateral preoptic area; LV, lateral ventricle; ox, optic chiasm; PAG, periaqueductal gray; PaLM, lateral magnocellular paraventricular hypothalamic nucleus; POA, preoptic area; PT, paratenial thalamic nucleus; PVA, anterior paraventricular thalamic nucleus; PVH, paraventricular hypothalamic nucleus; PVT, paraventricular thalamic nucleus; Re, reuniens thalamic nucleus; st, stria terminalis; 3V, third ventricle; 4V, fourth ventricle.
To achieve the reactivation of Pomc specifically in the subpopulation of Lepr-expressing POMC neurons, we used LeprCre mice (33). These mice contain a Cre recombinase sequence preceded by an internal ribosome entry site knocked in to the LepRb (long form)-specific exon 18 of the Lepr gene. We intercrossed LeprCre and PomcNEO mice to generate the following three experimental genotypes used in our studies: 1) LeprCre/+;Pomc+/+ (PomcWT) mice, which served as positive controls with full eutopic Pomc expression; 2) Lepr+/+;PomcNEO/NEO (PomcNEO) mice, which served as negative controls with a complete absence of hypothalamic Pomc expression; and 3) LeprCre/+; PomcNEO/NEO (PomcLEPR) mice, which were expected to express Pomc eutopically only in the Lepr+ subpopulation of arcuate POMC neurons.
POMC neurons in the hypothalamus send efferent projections to multiple forebrain areas as well as the midbrain periaqueductal gray (Figure 2B). PomcLEPR mice had approximately 67% as many hypothalamic POMC-IR neurons as PomcWT mice, consistent with the proportion of POMC neurons normally expressing Lepr (Figure 2, C and D), whereas POMC-IR was completely absent in PomcNEO mice (Figure 2C, middle panel).
We assessed the anatomical distribution of POMC-IR efferents throughout the brain in PomcWT and PomcLEPR mice and analyzed the density of these POMC-IR fibers by semiquantitative immunofluorescence in all brain regions in which they were detectable (Figure 2, E–G). In PomcWT mice, there was a clear trend of declining POMC-IR fiber density from more medial-rostral to more lateral or caudal regions (Figure 2F). For example, the preoptic area had approximately 7 times greater fiber density than the amygdala and periaqueductal gray. PomcLEPR mice had significantly reduced POMC-IR fiber density in most forebrain areas. Interestingly, there was a trend for Lepr+ neuron-restricted Pomc expression to restore fiber density closer to full wild-type levels in the central nucleus of the amygdala and periaqueductal gray (Figure 2G). This indicates that Lepr+ POMC neurons proportionally project more laterally and caudally than Lepr-negative POMC neurons. Nevertheless, Lepr+ POMC neurons clearly provide a substantial percentage of the total efferent innervation to all POMC neuron target nuclei.
Lepr-restricted Pomc expression normalizes energy and glucose homeostasis
PomcNEO mice of both sexes develop severe obesity due to the absence of hypothalamic Pomc expression (males: Figure 3, A and B; females: Figure 4, A and B). Restoration of Pomc expression only to Lepr+ neurons, which constitute approximately 67% of the total POMC neuron population, was sufficient to completely normalize body weight and body composition (males: Figure 3, A and B; females: Figure 4, A and B). The hyperphagia of PomcNEO mice was also normalized by restoration of Pomc expression to Lepr+ neurons (Figure 3C). Despite the development of marked hyperinsulinemia and insulin resistance (males: Figure 3, D–F; females: Figure 4, C–E), PomcNEO mice were only mildly, if at all, glucose intolerant (males: Figure 3, G and H; females: Figure 4, F and G). Restoration of Pomc expression only to Lepr+ neurons was sufficient to normalize insulin levels, insulin sensitivity, and glucose homeostasis (males: Figure 3, D–H; females: Figure 4, C–G).
Figure 3. Normalized energy balance and glucose homeostasis in male PomcLEPR mice.
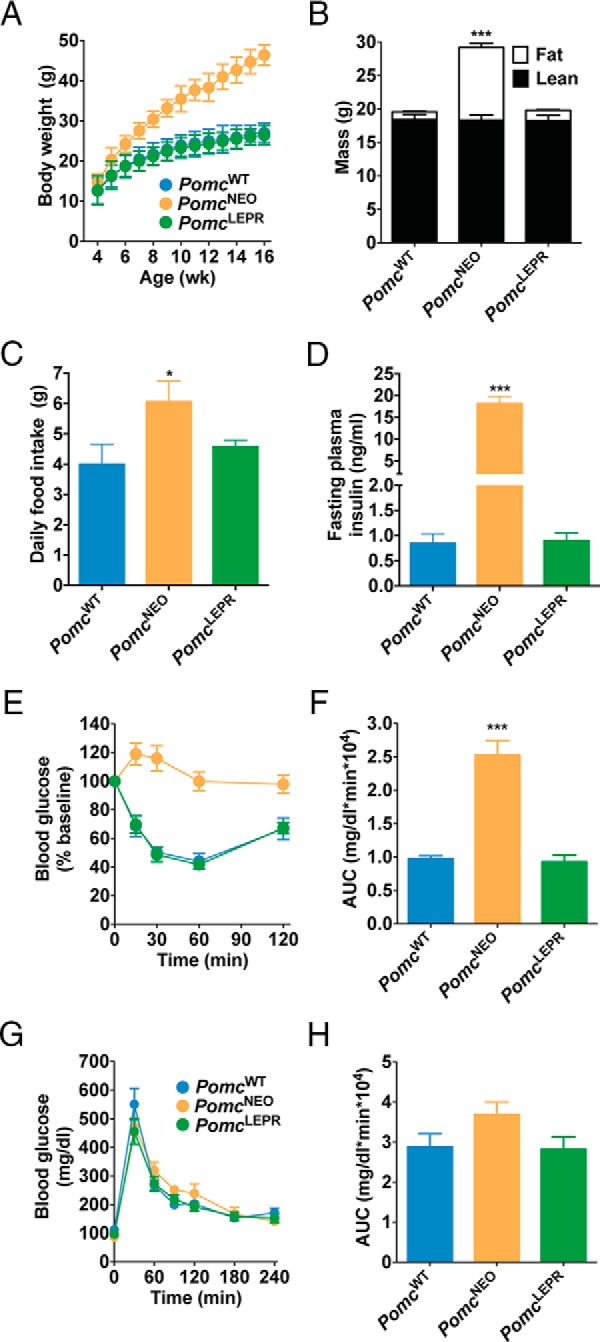
A, Body weight (n = 8–12). B, Body composition measured by NMR at age 8 weeks (n = 8). C, Twenty-four-hour food intake at age 32 weeks (n = 4–6). D, Fasting plasma insulin at age 32 weeks (n = 3–7). E and F, Insulin tolerance test, showing blood glucose levels over time (E) and calculated AUC (F) at age 32 weeks (n = 6–8). G and H, Glucose tolerance test at age 5 weeks, showing blood glucose levels over time (G) and calculated AUC (H) (n = 5–9). Data are presented as mean ± SEM. *, P < .05, ***, P < .001 compared with PomcWT.
Figure 4. Normalized energy balance and glucose homeostasis in female PomcLEPR mice.
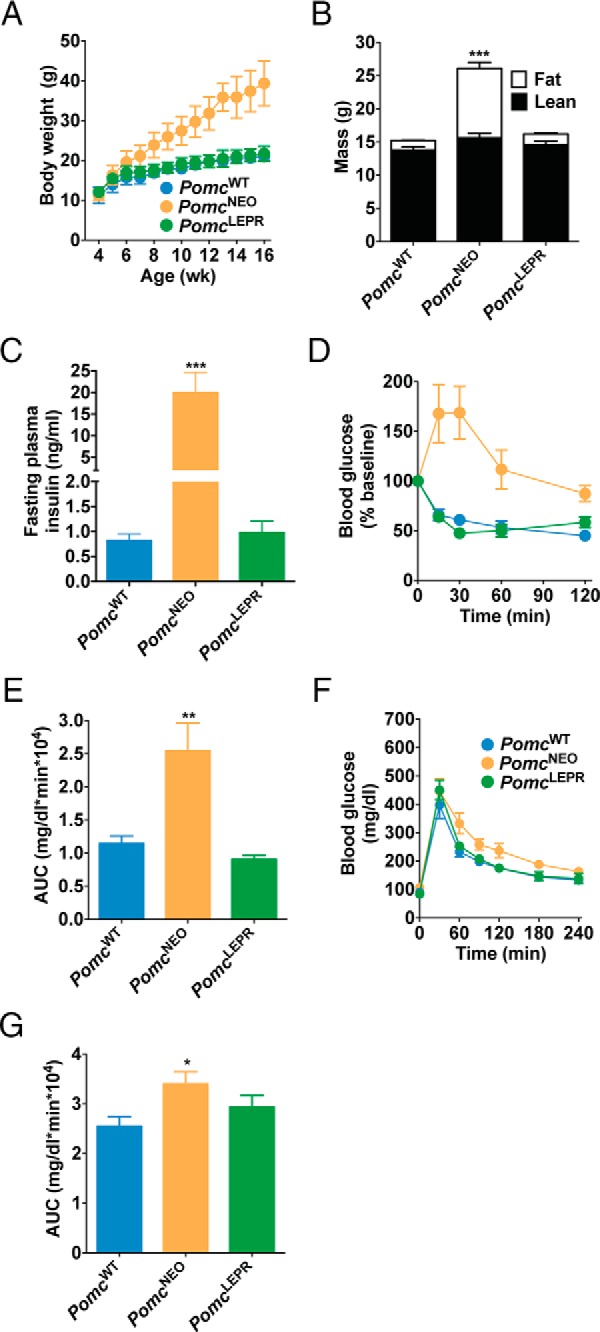
A, Body weight (n = 5–8). B, Body composition measured by NMR at age 8 weeks (n = 8–10). C, Fasting plasma insulin at age 32 weeks (n = 4–10). D and E, Insulin tolerance test, showing blood glucose levels over time (D) and calculated AUC (E) at age 32 weeks (n = 4–7). F and G, Glucose tolerance test at age 5 weeks, showing blood glucose levels over time (F) and calculated AUC (G) (n = 6–9). Data are presented as mean ± SEM. *, P < .05, **, P < .01, ***, P < .001 compared with PomcWT.
Lepr-restricted Pomc expression normalizes locomotor activity
We analyzed the metabolism and behavior of PomcWT, PomcNEO, and PomcLEPR mice at age 10 weeks in the CLAMS. We did not detect any significant differences between genotypes in their 24-hour oxygen consumption normalized to lean mass (although there was a small reduction in female PomcNEO mice during the dark period only that was not normalized in PomcLEPR mice) (males: Figure 5A; females: Figure 6A), or in their respiratory exchange ratio (RER) during the dark or light periods (males: Figure 5B; females: Figure 6B). However, locomotor activity in both the horizontal and vertical axes was significantly reduced in PomcNEO mice and fully restored in PomcLEPR mice of both sexes (males: Figure 5, C and D; females: Figure 6, C and D). We did not detect any differences between genotypes in systolic BP or heart rate (males: Figure 5, E and F; females: Figure 6, E and F). The latter studies were repeated at age 32 weeks in male mice and were very similar (data not shown). Therefore, PomcNEO mice are apparently inappropriately normotensive, given their severe obesity and insulin resistance.
Figure 5. Indirect calorimetry, locomotor activity, and cardiovascular function in male PomcLEPR mice.
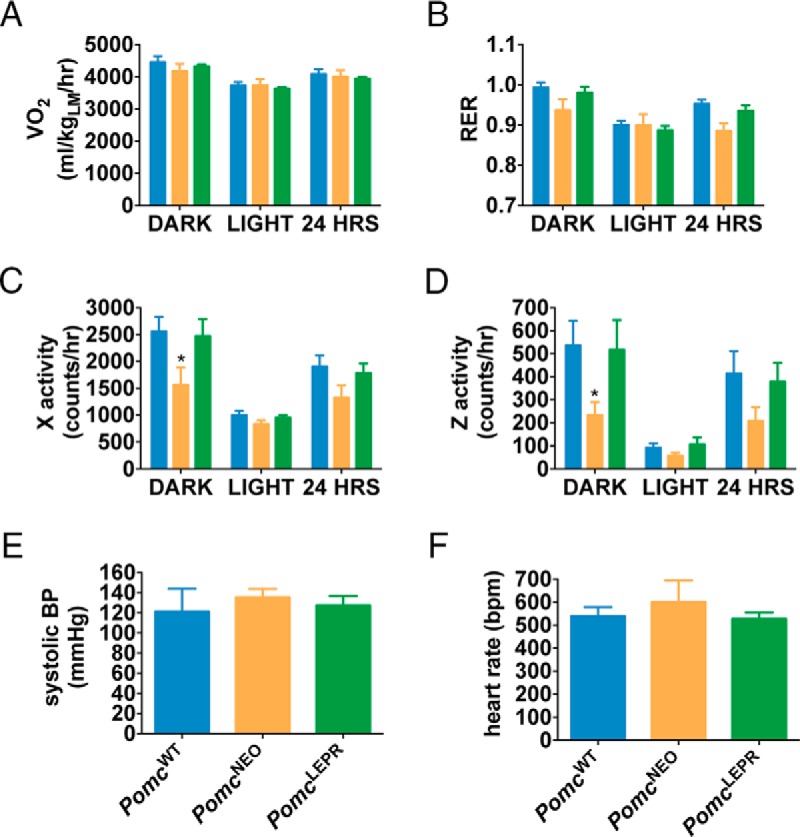
A, VO2 normalized to lean mass. B, RER (VCO2/VO2). C, Horizontal activity. D, Vertical (rearing) activity [n = 8 for CLAMS data (age 10 wk)]. E, Systolic BP. F, Heart rate [n = 5–6 for cardiovascular function (age 6 wk)]. Data are presented as mean ± SEM. *, P < .05 compared with PomcWT.
Figure 6. Indirect calorimetry, locomotor activity, and cardiovascular function in female PomcLEPR mice.
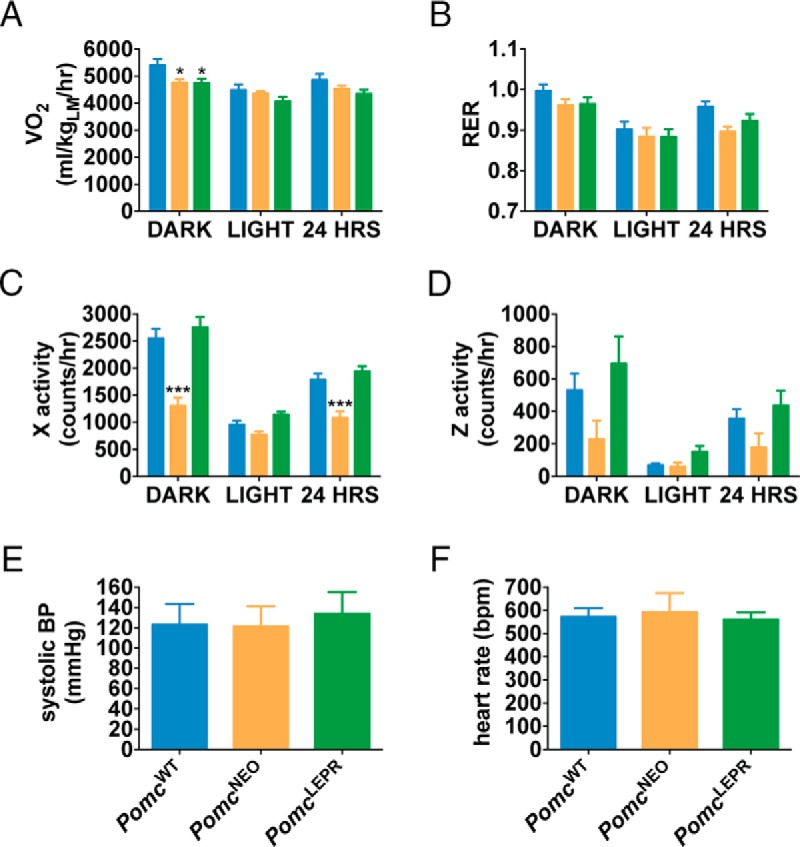
A, VO2 normalized to lean mass. B, RER (VCO2/VO2). C, Horizontal activity. D, Vertical (rearing) activity [n = 8 for CLAMS data (age 10 wk)]. E, Systolic BP. F, Heart rate [n = 6–8 for cardiovascular function (age 6 wk)]. Data are presented as mean ± SEM. *, P < .05 compared with PomcWT.
Mice with Lepr-restricted Pomc expression retain anorexic sensitivity to serotonergic stimulation
It has previously been suggested, on the basis of electrophysiological responses, that leptin-responsive (Lepr expressing) POMC neurons form a distinct population from serotonin-responsive POMC neurons (40). Furthermore, it has been shown that the anorectic response to the serotonin-releasing drug d-fenfluramine is strongly dependent on serotonin 2C receptors (5-HT2CR) expressed on POMC neurons (41–43).
To investigate the effects of Lepr-restricted Pomc expression on the anorectic response to serotonergic stimulation, we treated PomcWT and PomcLEPR mice with the serotonin-releasing drug d-fenfluramine. We observed that the anorectic response to d-fenfluramine was intact in PomcLEPR mice (Figure 7).
Figure 7. Anorectic responses to d-fenfluramine.
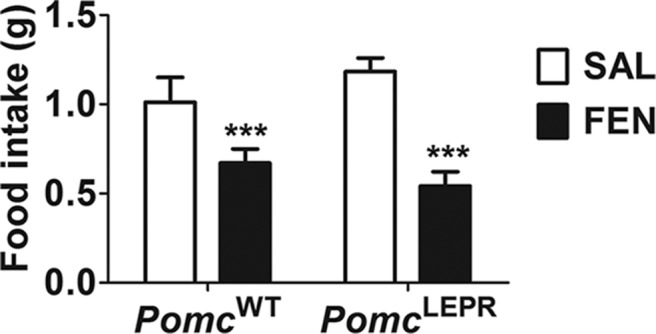
Male mice (n = 6–7) were fasted overnight and then injected ip with 0.9% saline or 5 mg/kg d-fenfluramine. Mice were immediately provided with food, and total intake was measured after 1 hour. Data are presented as mean ± SEM. F(1,11) = 56.33 (P < .0001, main effect of treatment). There was no significant main effect of genotype or an interaction between treatment and genotype). ***, P < .001 compared with saline (Bonferroni's multiple comparisons test). FEN, d-fenfluramine; SAL, saline.
Discussion
Using complementary neuroanatomical labeling techniques based on lineage tracing of LeprCre expression, cell-autonomous activation of a canonical LEPR-signaling pathway, transgenic reporter expression, and detection of immunoreactive POMC, we found that 50%–80% of hypothalamic POMC neurons, and 30%–40% of NTS POMC neurons, express Lepr. This is in general agreement with previous studies assessing pSTAT3 expression in PomcEGFP mice (44, 45). Other studies have found substantial rostral-caudal variation in Lepr expression or leptin responsiveness in POMC neurons (22, 38). In contrast, we found no evidence of rostral-caudal variation of Lepr coexpression in POMC neurons. This discrepancy may be partly due to species differences because Münzberg et al (38) studied rats rather than mice. Williams et al (22) studied c-fos activation and acute electrophysiological responses to leptin administration rather than Lepr localization or pSTAT3 signaling and found somewhat different results dependent on the method. Their highest degree of leptin responsiveness in PomchrGFP neurons (67%) was in the middle to more caudal arcuate nucleus and most in agreement with our results. We found no POMC neurons in the most rostral retrochiasmatic area (levels −0.94 mm to −1.16 mm from bregma) of our mice by either POMC immunoreactivity or native dsRed fluorescence, which might also account for some discrepancies. However, the number and distribution of POMC neurons appeared to be similar to that described by Williams et al (22) at more caudal levels from −1.34 mm to −2.30 mm from Bregma. Intracellular signaling cascades, such as the STAT3 pathway, are not necessarily directly coupled to electrophysiological changes (and vice versa), and it remains unclear which effects of leptin are more important functionally. Nevertheless, in this study Lepr expression was used as a genetic delineation marker rather than a critical functional determinant.
However, the pattern of POMC-immunoreactive efferent fibers that remains intact in PomcLEPR mice, which express Pomc only in Lepr+ neurons, indicates that the subpopulation of Lepr+ POMC neurons projects to all efferent targets of POMC neurons to some degree. This is in agreement with a recent report which showed that efferents from Lepr+ neurons express POMC-IR in all regions innervated by POMC-IR efferents (46). Nevertheless, the extent of POMC-IR efferent restoration in PomcLEPR mice indicated that Lepr+ POMC neurons project with some proportional selectivity to more lateral and caudal target areas.
It has previously been shown that mice with hypothalamus-specific Pomc deficiency develop severe hyperphagia, hypolocomotion, and obesity (11, 12), and our assessment of PomcNEO mice replicated these phenotypes. We also found severe hyperinsulinemia and reduced insulin sensitivity in the PomcNEO mice compared with wild-type mice, but mild if any glucose intolerance. The PomcLEPR mice were fully normalized in all these parameters, indicating that POMC-derived peptides synthesized in Lepr+ neurons are sufficient to maintain these parameters within the normal physiological range. Nonetheless, it remains possible that a more subtle or cryptic function of POMC peptides released from the minority of POMC neurons that do not express LEPR could be revealed by the appropriate physiological or environmental challenge to the PomcLEPR mice.
There is a strong association between obesity and hypertension in humans (47), and mice with diet-induced obesity also become hypertensive (48). Previous studies in humans have shown that patients deficient in melancortin 4 receptor (MC4R), a principal brain receptor for POMC-derived peptides, develop severe obesity but are protected from obesity-associated hypertension (4, 49). The mechanism for this protective effect appears to be related to reduced sympathetic nervous system activity in MC4R-deficient patients (4). Indeed, POMC-derived peptides appear to promote hypertension via MC4R-mediated sympathetic activation (50). We observed that severely obese PomcNEO mice, in contrast to earlier reports in diet-induced obese mice (48), did not develop hypertension. However, to clearly demonstrate that PomcNEO mice are protected from obesity-associated hypertension, further studies directly comparing PomcNEO mice with diet-induced obese wild-type mice are needed. Similarly, conclusively determining whether Lepr+ POMC neurons are involved in regulating the cardiovascular system would require assessment of whether PomcLEPR mice are protected from hypertension when they develop diet-induced obesity.
We observed that PomcLEPR mice are still fully responsive to the serotonin-releasing drug d-fenfluramine. It is unclear whether this response was mediated by the remaining intact POMC neurons or by non-POMC neurons. However, in previous studies, mice null for 5-HT2CR receptor had significantly blunted anorectic response to d-fenfluramine, and full responsivity was restored by reexpressing 5-HT2CR only in POMC neurons (41, 42). In follow-up studies, deletion of 5-HT2CR only from POMC neurons was sufficient to abolish the anorectic response to d-fenfluramine (43). Furthermore, our recent study demonstrated that obese PomcNEO mice are totally resistant to the anorexic actions of d-fenfluramine as well as the serotonin/norepinephrine reuptake inhibitor sibutramine (51). Taken together with our current data demonstrating conserved d-fenfluramine action in PomcLEPR mice, it appears likely that there is a functionally significant overlap of 5-HT2CR and LEPR expression in a subpopulation of POMC neurons.
This conclusion disagrees with a previous study based on electrophysiological recordings indicating that 5-HT2CR and LEPR are expressed on distinct subpopulations of POMC neurons (40). The reason for these discrepant results is not known, but several possibilities can be considered. First, there may well be functional readouts of 5-HT2CR and LEPR action on POMC neurons in vivo that are not reflected in the changes in membrane potential and excitability measured by patch-clamp analysis. The study by Sohn et al (40) did not exclude colocalization of the two receptors in POMC neurons by an alternative method such as dual-label in situ hybridization. Furthermore, the study by Sohn et al (40), and another by Williams et al (22), which identified distinct leptin- and insulin-responsive subpopulations of POMC neurons, respectively, relied on the identification of the POMC neurons in slices by fluorescence of a PomchrGFP transgene. A significant portion of the recorded neurons in each study that provided evidence for distinct subpopulations was located in the most rostral retrochiasmatic area around position −0.94 mm from Bregma in which we have been unable to identify POMC neurons by either immunohistochemistry for POMC peptides or expression of fluorescent reporters in the PomcdsRed mice or PomcEGFP mice. Finally, it is possible that the lineage marker LeprCre transgene is transiently expressed developmentally in some POMC neurons that subsequently turn off Lepr expression at later time points. Such a scenario is difficult to completely exclude but could in principle be responsible for the Pomc reactivation in some 5-HT2CR POMC neurons of our PomcLEPR mice.
In summary, we have shown that mice with hypothalamus-specific Pomc deficiency develop severe obesity. Restoration of Pomc expression only to the subset of potential POMC neurons that are Lepr+, approximately 67% of the total, is sufficient to fully normalize food intake, body weight, and locomotor activity. These findings indicate that Lepr+ POMC neurons may selectively regulate these parameters and consequently may represent a valuable, highly specific, therapeutic target. Further experiments are required to elucidate the role of the Lepr− POMC neurons and which subpopulations mediate the other effects of POMC-derived peptides, including those on cardiovascular and sexual function. The novel hypothalamus-specific null reactivatable Pomc allele we used here represents an invaluable tool for functional dissociation of POMC neuron subpopulations.
Acknowledgments
The authors thank Dr Kavaljit Chhabra (University of Michigan) for advice and assistance and Jared Goldberg and Eva Yokosawa (University of Michigan) for mouse breeding and genotyping. Leptin was donated by Amylin, Inc.
This work was supported by National Institutes of Health Grants R01 DK066604 (to M.J.L.), R01 DK068400 (to M.J.L. and M.R.), and F32 DK098051 (to A.J.M.) and American Heart Association Grants 11POST7430087 and 13POST16890000 (to D.D.L.). This work used core services provided by the University of Michigan Animal Phenotyping Core supported by the Michigan Diabetes Research Center and the Michigan Nutrition and Obesity Research Center (National Institutes of Health Grants P30 DK020572 and P30 DK089503), and the Physiology Phenotyping Core in partnership with the University of Michigan Cardiovascular Center Research Core.
Disclosure Summary: The authors have nothing to disclose.
Footnotes
- AUC
- area under the curve
- BP
- blood pressure
- CLAMS
- comprehensive lab animal monitoring system
- GFP
- green fluorescent protein
- 5-HT2CR
- serotonin 2C receptor
- IR
- immunoreactivity
- LEPR
- leptin receptor
- MC4R
- melancortin 4 receptor
- NTS
- nucleus of the solitary tract
- POMC
- proopiomelanocortin
- pSTAT3
- phosphorylation of signal transducer and activator of transcription 3
- RER
- respiratory exchange ratio
- VCO2
- CO2 production
- VO2
- O2 consumption.
References
- 1. Nakanishi S, Inoue A, Kita T, et al. Nucleotide sequence of cloned cDNA for bovine corticotropin-β-lipotropin precursor. Nature. 1979;278(5703):423–427. [DOI] [PubMed] [Google Scholar]
- 2. Balthasar N, Dalgaard LT, Lee CE, et al. Divergence of melanocortin pathways in the control of food intake and energy expenditure. Cell. 2005;123(3):493–505. [DOI] [PubMed] [Google Scholar]
- 3. Cone RD. Anatomy and regulation of the central melanocortin system. Nat Neurosci. 2005;8(5):571–578. [DOI] [PubMed] [Google Scholar]
- 4. Greenfield JR, Miller JW, Keogh JM, et al. Modulation of blood pressure by central melanocortinergic pathways. N Engl J Med. 2009;360(1):44–52. [DOI] [PubMed] [Google Scholar]
- 5. Kuo JJ, Silva AA, Hall JE. Hypothalamic melanocortin receptors and chronic regulation of arterial pressure and renal function. Hypertension. 2003;41(3 Pt 2):768–774. [DOI] [PubMed] [Google Scholar]
- 6. Nogueiras R, Wiedmer P, Perez-Tilve D, et al. The central melanocortin system directly controls peripheral lipid metabolism. J Clin Invest. 2007;117(11):3475–3488. [DOI] [PMC free article] [PubMed] [Google Scholar]
- 7. Perez-Tilve D, Hofmann SM, Basford J, et al. Melanocortin signaling in the CNS directly regulates circulating cholesterol. Nat Neurosci. 2010;13(7):877–882. [DOI] [PMC free article] [PubMed] [Google Scholar]
- 8. Obici S, Feng Z, Tan J, Liu L, Karkanias G, Rossetti L. Central melanocortin receptors regulate insulin action. J Clin Invest. 2001;108(7):1079–1085. [DOI] [PMC free article] [PubMed] [Google Scholar]
- 9. Yaswen L, Diehl N, Brennan MB, Hochgeschwender U. Obesity in the mouse model of pro-opiomelanocortin deficiency responds to peripheral melanocortin. Nat Med. 1999;5(9):1066–1070. [DOI] [PubMed] [Google Scholar]
- 10. Krude H, Biebermann H, Luck W, Horn R, Brabant G, Grüters A. Severe early-onset obesity, adrenal insufficiency and red hair pigmentation caused by POMC mutations in humans. Nat Genet. 1998;19(2):155–157. [DOI] [PubMed] [Google Scholar]
- 11. Smart JL, Tolle V, Low MJ. Glucocorticoids exacerbate obesity and insulin resistance in neuron-specific proopiomelanocortin-deficient mice. J Clin Invest. 2006;116(2):495–505. [DOI] [PMC free article] [PubMed] [Google Scholar]
- 12. Bumaschny VF, Yamashita M, Casas-Cordero R, et al. Obesity-programmed mice are rescued by early genetic intervention. J Clin Invest. 2012;122(11):4203–4212. [DOI] [PMC free article] [PubMed] [Google Scholar]
- 13. Fan W, Boston BA, Kesterson RA, Hruby VJ, Cone RD. Role of melanocortinergic neurons in feeding and the agouti obesity syndrome. Nature. 1997;385(6612):165–168. [DOI] [PubMed] [Google Scholar]
- 14. Hansen MJ, Ball MJ, Morris MJ. Enhanced inhibitory feeding response to α-melanocyte stimulating hormone in the diet-induced obese rat. Brain Res. 2001;892(1):130–137. [DOI] [PubMed] [Google Scholar]
- 15. Murphy B, Nunes CN, Ronan JJ, Hanaway M, Fairhurst AM, Mellin TN. Centrally administered MTII affects feeding, drinking, temperature, and activity in the Sprague-Dawley rat. J Appl Physiol. 2000;89(1):273–282. [DOI] [PubMed] [Google Scholar]
- 16. Ni X-P, Butler AA, Cone RD, Humphreys MH. Central receptors mediating the cardiovascular actions of melanocyte stimulating hormones. J Hypertens. 2006;24(11):2239–2246. [DOI] [PubMed] [Google Scholar]
- 17. Van der Ploeg LHT, Martin WJ, Howard AD, et al. A role for the melanocortin 4 receptor in sexual function. Proc Natl Acad Sci USA. 2002;99(17):11381–11386. [DOI] [PMC free article] [PubMed] [Google Scholar]
- 18. Pfaus JG, Shadiack A, Van Soest T, Tse M, Molinoff P. Selective facilitation of sexual solicitation in the female rat by a melanocortin receptor agonist. Proc Natl Acad Sci USA. 2004;101(27):10201–10204. [DOI] [PMC free article] [PubMed] [Google Scholar]
- 19. Wessells H, Fuciarelli K, Hansen J, et al. Synthetic melanotropic peptide initiates erections in men with psychogenic erectile dysfunction: double-blind, placebo controlled crossover study. J Urol. 1998;160(2):389–393. [PubMed] [Google Scholar]
- 20. Diamond LE, Earle DC, Heiman JR, Rosen RC, Perelman MA, Harning R. An effect on the subjective sexual response in premenopausal women with sexual arousal disorder by bremelanotide (PT-141), a melanocortin receptor agonist. J Sex Med. 2006;3:628–638. [DOI] [PubMed] [Google Scholar]
- 21. Heisler LK, Cowley MA, Tecott LH, et al. Activation of central melanocortin pathways by fenfluramine. Science. 2002;297:609–611. [DOI] [PubMed] [Google Scholar]
- 22. Williams KW, Margatho LO, Lee CE, et al. Segregation of acute leptin and insulin effects in distinct populations of arcuate proopiomelanocortin neurons. J Neurosci. 2010;30(7):2472–2479. [DOI] [PMC free article] [PubMed] [Google Scholar]
- 23. Meister B, Gömüç B, Suarez E, Ishii Y, Dürr K, Gillberg L. Hypothalamic proopiomelanocortin (POMC) neurons have a cholinergic phenotype. Eur J Neurosci. 2006;24(10):2731–2740. [DOI] [PubMed] [Google Scholar]
- 24. Jarvie BC, Hentges ST. Expression of GABAergic and glutamatergic phenotypic markers in hypothalamic proopiomelanocortin neurons. J Comp Neurol. 2012;520(17):3863–3876. [DOI] [PMC free article] [PubMed] [Google Scholar]
- 25. Hentges ST, Otero-Corchon V, Pennock RL, King CM, Low MJ. Proopiomelanocortin expression in both GABA and glutamate neurons. J Neurosci. 2009;29(43):13684–13690. [DOI] [PMC free article] [PubMed] [Google Scholar]
- 26. Baker RA, Herkenham M. Arcuate nucleus neurons that project to the hypothalamic paraventricular nucleus: neuropeptidergic identity and consequences of adrenalectomy on mRNA levels in the rat. J Comp Neurol. 1995;358(4):518–530. [DOI] [PubMed] [Google Scholar]
- 27. Elias CF, Aschkenasi C, Lee C, et al. Leptin differentially regulates NPY and POMC neurons projecting to the lateral hypothalamic area. Neuron. 1999;23(4):775–786. [DOI] [PubMed] [Google Scholar]
- 28. Elias CF, Lee C, Kelly J, et al. Leptin activates hypothalamic CART neurons projecting to the spinal cord. Neuron. 1998;21(6):1375–1385. [DOI] [PubMed] [Google Scholar]
- 29. Zheng H, Patterson LM, Phifer CB, Berthoud H-R. Brain stem melanocortinergic modulation of meal size and identification of hypothalamic POMC projections. Am J Physiol Regul Integr Comp Physiol. 2005;289(1):R247–R258. [DOI] [PubMed] [Google Scholar]
- 30. King CM, Hentges ST. Relative number and distribution of murine hypothalamic proopiomelanocortin neurons innervating distinct target sites. PLoS One. 2011;6:e25864. [DOI] [PMC free article] [PubMed] [Google Scholar]
- 31. Cowley MA, Smart JL, Rubinstein M, et al. Leptin activates anorexigenic POMC neurons through a neural network in the arcuate nucleus. Nature. 2001;411(6836):480–484. [DOI] [PubMed] [Google Scholar]
- 32. Balthasar N, Coppari R, McMinn J, et al. Leptin receptor signaling in POMC neurons is required for normal body weight homeostasis. Neuron. 2004;42(6):983–991. [DOI] [PubMed] [Google Scholar]
- 33. Leshan RL, Björnholm M, Münzberg H, Myers MG. Leptin receptor signaling and action in the central nervous system. Obesity (Silver Spring). 2006;14(suppl 5):208S–212S. [DOI] [PubMed] [Google Scholar]
- 34. Mercer AJ, Stuart R, Attard CA, Otero-Corchon V, Nillni EA, Low MJ. Temporal changes in nutritional state affect hypothalamic POMC peptide levels independently of leptin in adult male mice. Am J Physiol Endocrinol Metab. 2014;306(8):E904–E915. [DOI] [PMC free article] [PubMed] [Google Scholar]
- 35. Leshan RL, Louis GW, Jo Y-H, Rhodes CJ, Münzberg H, Myers MG. Direct innervation of GnRH neurons by metabolic- and sexual odorant-sensing leptin receptor neurons in the hypothalamic ventral premammillary nucleus. J Neurosci. 2009;29(10):3138–3147. [DOI] [PMC free article] [PubMed] [Google Scholar]
- 36. Cheung CC, Clifton DK, Steiner RA. Proopiomelanocortin neurons are direct targets for leptin in the hypothalamus. Endocrinology. 1997;138(10):4489–4492. [DOI] [PubMed] [Google Scholar]
- 37. Ha S, Baver S, Huo L, et al. Somato-dendritic localization and signaling by leptin receptors in hypothalamic POMC and AgRP neurons. PLoS One. 2013;8:e77622. [DOI] [PMC free article] [PubMed] [Google Scholar]
- 38. Münzberg H, Huo L, Nillni EA, Hollenberg AN, Bjørbaek C. Role of signal transducer and activator of transcription 3 in regulation of hypothalamic proopiomelanocortin gene expression by leptin. Endocrinology. 2003;144(5):2121–2131. [DOI] [PubMed] [Google Scholar]
- 39. Joseph SA, Pilcher WH, Bennett-Clarke C. Immunocytochemical localization of ACTH perikarya in nucleus tractus solitarius: evidence for a second opiocortin neuronal system. Neurosci Lett. 1983;38(3):221–225. [DOI] [PubMed] [Google Scholar]
- 40. Sohn J-W, Xu Y, Jones JE, Wickman K, Williams KW, Elmquist JK. Serotonin 2C receptor activates a distinct population of arcuate pro-opiomelanocortin neurons via TRPC channels. Neuron. 2011;71(3):488–497. [DOI] [PMC free article] [PubMed] [Google Scholar]
- 41. Xu Y, Jones JE, Kohno D, et al. 5-HT2CRs expressed by pro-opiomelanocortin neurons regulate energy homeostasis. Neuron. 2008;60(4):582–589. [DOI] [PMC free article] [PubMed] [Google Scholar]
- 42. Xu Y, Jones JE, Lauzon DA, et al. A serotonin and melanocortin circuit mediates D-fenfluramine anorexia. J Neurosci. 2010;30(44):14630–14634. [DOI] [PMC free article] [PubMed] [Google Scholar]
- 43. Berglund ED, Liu C, Sohn J-W, et al. Serotonin 2C receptors in pro-opiomelanocortin neurons regulate energy and glucose homeostasis. J Clin Invest. 2013;123(12):5061–5070. [DOI] [PMC free article] [PubMed] [Google Scholar]
- 44. Huo L, Grill HJ, Bjørbaek C. Divergent regulation of proopiomelanocortin neurons by leptin in the nucleus of the solitary tract and in the arcuate hypothalamic nucleus. Diabetes. 2006;55(3):567–573. [DOI] [PubMed] [Google Scholar]
- 45. Ellacott KLJ, Halatchev IG, Cone RD. Characterization of leptin-responsive neurons in the caudal brainstem. Endocrinology. 2006;147(7):3190–3195. [DOI] [PubMed] [Google Scholar]
- 46. Betley JN, Cao ZFH, Ritola KD, Sternson SM. Parallel, redundant circuit organization for homeostatic control of feeding behavior. Cell. 2013;155(6):1337–1350. [DOI] [PMC free article] [PubMed] [Google Scholar]
- 47. Rahmouni K, Correia MLG, Haynes WG, Mark AL. Obesity-associated hypertension: new insights into mechanisms. Hypertension. 2005;45(1):9–14. [DOI] [PubMed] [Google Scholar]
- 48. Rahmouni K, Morgan DA, Morgan GM, Mark AL, Haynes WG. Role of selective leptin resistance in diet-induced obesity hypertension. Diabetes. 2005;54(7):2012–2018. [DOI] [PubMed] [Google Scholar]
- 49. Yeo GS, Farooqi IS, Aminian S, Halsall DJ, Stanhope RG, O'Rahilly S. A frameshift mutation in MC4R associated with dominantly inherited human obesity. Nat Genet. 1998;20(2):111–112. [DOI] [PubMed] [Google Scholar]
- 50. Sohn J-W, Harris LE, Berglund ED, et al. Melanocortin 4 receptors reciprocally regulate sympathetic and parasympathetic preganglionic neurons. Cell. 2013;152(3):612–619. [DOI] [PMC free article] [PubMed] [Google Scholar]
- 51. Burke LK, Doslikova B, D'Agostino G, et al. 5-HT obesity medication efficacy via POMC activation is maintained during aging. Endocrinology. 2014;155(10):3732–3738. [DOI] [PMC free article] [PubMed] [Google Scholar]