Abstract
Background
The aim of this study was to determine the influence of the BMI1 gene on chemotherapy sensitivity in human glioma cells.
Material/Methods
The expression of the BMI1 gene in 41 cases of human brain glioma was determined by quantitative real-time PCR. The silencing effect of RNA interference on the BMI1 gene was detected by Western blot. Methyl thiazolyl tetrazolium assay (MTT) and flow cytometry methods were used to determine the cell viability and apoptosis rate of the U251 cells with BMI1 silencing. After those U251 cells were treated with Cisplatin (DDP), the cell viability and apoptosis rate were further detected.
Results
The BMI1 mRNA in glioma was remarkably up-regulated, 176.3% as much as that in peri-cancerous tissues (P<0.05). The siRNA-BMI1 significantly and effectually inhibited the expression of BMI1 protein (P<0.05). The cell viability decreased in U251 cells with BMI1 silenced, and the apoptosis rate upgraded significantly (P<0.05 for both). After treating with DDP at various concentrations (1, 3, and 5 μg/ml), the cell viability in the BMI1-slienced U251 cells was much lower than that in corresponding control U251 cells at each DDP concentration (P<0.05 for all), and the apoptosis rate showed the opposite changing trends (P<0.05 for all).
Conclusions
There is a notable relationship between the over-expression of BMI1 and the carcinogenesis of gliomas. The silence of BMI1 inhibited cell proliferation and enhanced the apoptosis of the U251 cells, and increased the chemotherapy sensitivity of U251 cells to DDP.
MeSH Keywords: Antineoplastic Agents, Apoptosis, Cell Survival, Glioma
Background
Gliomas are the most general primary tumor in nervous system, and confer the highest morbidity and mortality among intracranial tumors because of the marked characteristics of malignant proliferation and invasion [1]. Gliomas are rarely curable. Treatment for a glioblastoma is customized to the individual patient and may include surgery, radiation therapy, chemotherapy, and observation. Surgery is currently the most important initial approach. Chemotherapy and radiotherapy after initial surgical resection is regarded as an effective treatment plan to prevent recurrence and metastasis [2]. However, chemotherapy does not work for everyone with a glioma and only helps about half of the people treated. For this reason, the prognosis for glioma patients, especially those with high-grade gliomas, is still gloomy, despite prompt and comprehensive treatment. The median survival time for adults with an anaplastic astrocytoma is about 2–3 years, and for those with more aggressive glioblastomas, median survival drops to about 12~14.6 months, with a 2-year median survival rate of 30% [3].
In this new era, investigating the molecular mechanisms in carcinogenesis might shed light on this deadly disease [4–7]. In our previous research, gene chips were used to detect the up-regulation of the BMI1 gene in human glioma. Polycomb group genes (PcG) are a group of important genes affecting cell cycle and proliferation, which includes a series of transcriptional repressors, and they affect the occurrence and progression of many malignant tumors [8,9]. The B cell-specific Moloney murine leukemia virus integration site 1 (BMI1) gene was first identified by van Lohuizen in 1991 [10]. BMI1, a PcG repressor, was up-regulated remarkably in breast cancer and colorectal cancer. The abnormal expression of the BMI1 gene is tightly related with occurrence, progression, invasion, metastasis, and prognosis of tumors [11–13]. BMI1 has been reported to act as a key biomarker for the prognosis of various kinds of cancer, including head and neck squamous cell carcinoma, colorectal cancer, and lung adenocarcinoma [14–16]. Therefore, the objective of this study was to first determine the correlation between the abnormal expression of BMI1 and the carcinogenesis and development of human gliomas, and then to search for its possible influence on chemotherapy sensitivity of human glioma U251 cells.
Material and Methods
Clinical specimens
The study was approved by the Ethics Committees of China Medical University (No. 2013PS26K), and we obtained patient consent before surgery. A total of 41 glioma and corresponding peri-cancerous tissues were provided by the Department of Neurosurgery, Shengjing Hospital of China Medical University from February 2012 to May 2014. The tumors with at least a 1-cm margin from the corresponding peri-cancerous tissues were obtained from all patients through surgical resection and were histologically proven to be gliomas. None of the patients had experienced radiation or chemotherapy before surgery. The patients included 28 men and 13 women (mean age: 53.6±4.2 years, age range: 45–68 years); and included 19 cases of astrogliomas (grade I–II), 12 cases of anaplastic gliomas (grade III), and 10 cases of glioblastomas (GBM, grade IV).
Cell culture
Human glioma cell line U251 was obtained from the Biological Sciences Cell Resource Center (China). Human glioma U251 cells were obtained from the Chinese Academy of Medical Sciences (Beijing, China). The U251 cells were cultured in DMEM medium supplemented with 10% fetal calf serum and incubated at 37°C with 5% CO2.
Quantitative real time -PCR (qRT-PCR)
After total RNA was extracted from tissue and cell samples, cDNA was synthesized and used to detect the mRNA expression [17]. The BMI1 primer was designed by Primer5 as follows: forward primer, 5′-GTGCTTTGTGGAGGGTACTTCAT-3′, reverse primer, 5′-TTGGACATCACAAATAGGACAATACTT-3′, and glyceraldehyde-3-phosphate-dehydrogenase (GAPDH) as reference. The samples were normalized to 18s and the 18< CT <30 were calculated with 2−ΔΔCT using the Applied Biosystems 7500.
Cell transfection
At 24 h before transfection, an appropriate concentration (about 80%) of resuspended U251 cells was seeded on 6-well plates. Then, 1 mg of siRNA-BMI1 or siRNA-control (Genepharma, China) was mixed with Enhancer R, followed by mixing with 4 μl TransMessenger, and then 900 μl Serum-free medium was added for incubating the non-transfected U251 cells. The transfected cells were incubated for 4 h, and normal media was added. After 48 h, the cells were harvested for further detection.
Western blot analysis
Cells were harvested and protein extracted. SDS-PAGE electrophoresis and antibody hybridization were performed as described previously. The ECL analysis system (Santa Cruz, USA) was used for detection in accordance with the manufacture’s protocol. Western blot quantification was performed using Image Processing and Analysis software. GAPDH was selected as the reference protein.
Cell proliferation assay
Cells were seeded in a 96-well plate with 2×10⁴ cells per well. Twenty μl of 0.5 mg/ml MTT solution (Sigma, USA) was added to each well, and the 96-well plate was incubated at 37°C. We cleaned the media after 4 h, and added 0.2 ml DMSO to each well. The 96-well plate was incubated for 30 min and read on an enzyme-labeled instrument (Bio-Rad, USA) with 570 nm wavelength. The obtained numerical values were used to construct the cell growth curve with cell viability = (OD value of test group − OD value of blank group)/(OD value of control group − OD value of blank group). Five replicate wells were set up in each group and 5 independent experiments were performed repeatedly.
Flow cytometry detection
Cells (5×10⁶) were harvested, and an apoptosis detection kit (Biosea, China) was used to examine the apoptosis rate in accordance with the manufacturer’s instructions. Then, the cells were read by flow cytometry (BD, USA) (Ex 488 nm, Em 635 nm) and the obtained numerical values were analyzed with CELLQuest 3.0 software (BD, USA). Annexin V positive cells were regarded as apoptosis cells. The cells were counted by dual-color flow cytometric method.
U251 cells treated by DDP
U251 cells were treated with DDP of 3 different concentrations (1, 3, and 5 μg/mL) [18,19], and the cell viability and apoptosis rate was detected after 24 h of incubation.
Statistical analysis
All results were obtained from independent experiments performed 3 times. All numerical data are presented as mean ± standard deviation (SD) and analyzed with SPSS 13.0 software. A t-test was performed to determine the significant differences between the 2 groups. Pearson’s correlation was used to compare the grade of glioma and relative expression levels of BMI1 mRNA. One-way ANOVA and post hoc comparisons (LSD test) were used to determine the significant differences among multiple groups. P<0.05 was considered as significant.
Results
BMI1 mRNA up-regulated in human brain glioma specimens
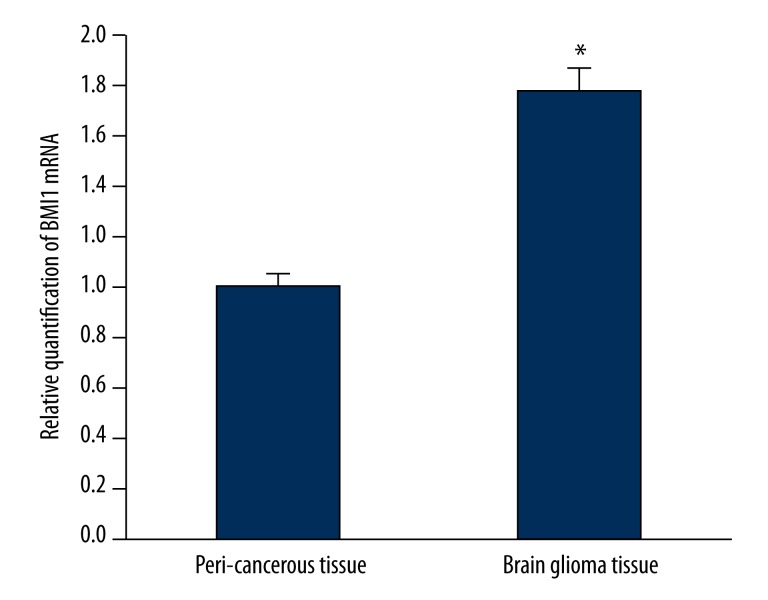
Amplification of the BMI1 gene was shown in human brain gliomas using primer-melting curve analysis. The qRT-PCR analysis showed the ΔCt of glioma and peri-cancerous tissues were 2.763±0.283 and 3.581±0.274, respectively, and the ΔΔCt was −0.818. Compared with corresponding peri-cancerous tissues, the BMI1 expression was above 176.3% in the gliomas (P<0.05) (Figure 1). The BMI1 mRNA expression in glioma U251 cells was similar to that in glioma tissue, and much higher than that in paracancerous tissues. Further, the expression of BMI1 mRNA was positively correlated with the pathologic grades of glioma (P<0.05) (Table 1).
Figure 1.
The expression of BMI1 mRNA in brain glioma tissue by real time-PCR analysis. The expression of BMI1 was higher in brain glioma tissue compared to peri-cancerous tissue (P<0.05). * P<0.05 vs. peri-cancerous tissue.
Table 1.
Correlation between BMI1 mRNA expression in brain glioma tissue and pathological differentiation.
| Differentiation (grade) | Number of cases | BMI1 mRNA expression relative quantification (gliomas/peri-cancerous tissues) | P value |
|---|---|---|---|
| Medium-well differentiated (grade: I–II) | 19 | 1.542±0.141 | <0.05 |
| Anaplastic glioma (grade: III) | 12 | 1.718±0.132 | |
| Glioblastoma (GBM, grade: IV) | 10 | 2.237±0.162 |
SiRNA-BMI1 silenced the expression of BMI1 protein in glioma cells
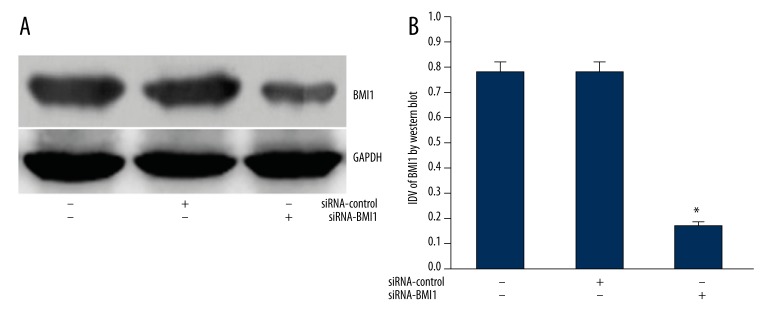
The expression of the BMI1 gene was much higher in U251 than that in control tissues, and we wanted to know the influence of its expression changes on the cell characteristics of glioma cells. Therefore, we used RNA interference to silence the over-expression of the BMI1 gene in U251 cells. After transfection of siRNA-BMI1 to glioma U251 cells, the expression of BMI1 protein decreased markedly (p<0.01) (Figure 2). This result showed that specific siRNA could effectively silence the expression of BMI1.
Figure 2.
(A) Representative image of the expression level of BMI1 protein. GAPDH was used as a reference control. (B) quantitative analysis of the relative protein levels of BMI1 normalized to those of GAPDH is shown. Data are mean ±SD of 3 independent experiments. * P<0.05. # P<0.05
Influence of BMI1 silencing on cell apoptosis and proliferation of U251 cells
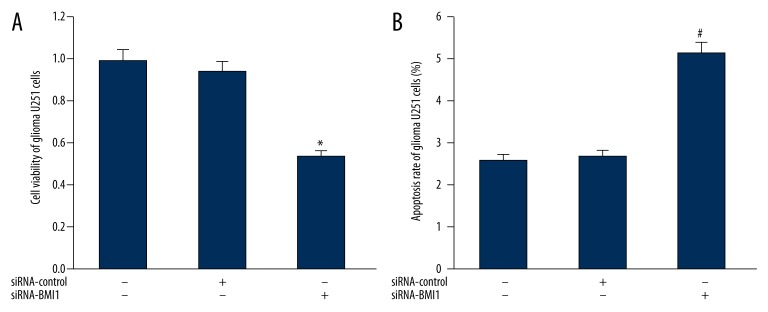
The cell apoptosis and proliferation of U251 cells were investigated when BMI1 protein was silenced. As shown in Figure 3A, in comparison to blank control U251 cells and negative control U251 cells transfected with siRNA-control, the apoptosis rate of U251 cells with BMI1 silencing elevated significantly (P>0.05). Moreover, the results of flow cytometry revealed that the apoptosis rate of U251 cells with BMI1 silencing was much higher than that in blank and negative control U251 cells (P>0.05) (Figure 3B).
Figure 3.
(A) Impact of BMI1 gene silencing on the cell viability of U251 cells. (B) Impact of BMI1 gene silencing on the apoptosis rate of U251 cells. *, # P<0.05 vs. control U251 cells.
Influence of BMI1 gene silencing on chemotherapy sensitivity of human glioma U251 cells
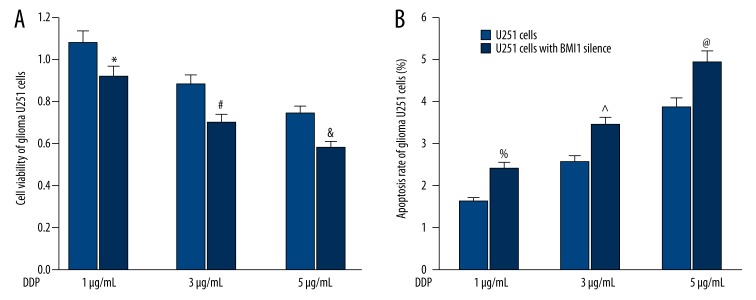
First, the influence of BMI1 gene silencing on cell proliferation of U251 cells was detected. As shown in Figure 4A, at each DDP concentration, the cell viability in the BMI1-slienced U251 cells were much lower than that in corresponding control U251 cells (all P<0.05). Then, the impact of BMI1 gene silencing on apoptosis rate of U251 cells was examined. Following opposite trends, compared with the U251 cells treated with DDP, the apoptosis rate was significantly higher in the BMI1-slienced U251 cells at each DDP concentration (all P<0.05) (Figure 4B).
Figure 4.
(A) Impact of different concentrations of DDP on the apoptosis rate of U251 cells and BMI1-slienced U251 cells. (B) Impact of different concentrations of DDP on the cell viability of U251 cells and BMI1-slienced U251 cells. *, #, &, %, ^, @ P<0.05 vs. corresponding control U251 cells.
Discussion
BMI1 is a polycomb group epigenetic gene silencer that is highly expressed in various types of human cancers [14–16,20]. In addition, it is involved in the development and progression of cancers [21,22]. It was recently reported that Bmi1 expression was correlated with poor prognosis and glioma progression in patients [23]. However, there was not a conclusive report about chemotherapy sensitivity of the BMI1 gene in gliomas.
In this study, we performed qRT-PCR and observed the up-regulation of BMI1 mRNA in brain gliomas, indicating the underlying correlation between BMI1 and the carcinogenesis of gliomas. Furthermore, the BMI1 expression was remarkably correlated with the pathologic grades of gliomas. Our data demonstrate that over-expression of BMI1, which promotes tumor growth and migration, is correlated with poor differentiation and high grade of gliomas. This suggests that BMI1 plays an important role in glioma carcinogenesis and development. Consistent with these results, our study further demonstrated that BMI1 gene was positively correlated with pathologic grade and functions as an oncogene in tumors. Moreover, we silenced BMI1 gene expression in U251 cells and investigated the apoptosis rate and cell viability. Our results show that the gene silencing of BMI1 induced remarkable apoptosis and reduced the proliferation ability of gliomas. There have been few studies on the correlation between BMI1 and apoptosis and further research is needed to determine the mechanisms by which BMI1 influences cell apoptosis and proliferation.
Currently, therapeutic approaches are tailored for individual patients, depending on the nature of the tumor, the growth rate, the location, and the patient’s condition. Upon initial diagnosis of a glioma, standard treatment consists of maximal surgical resection, combined with optional chemotherapy and radiotherapy. Chemotherapy and radiotherapy are recommended for reducing the risk of recurrence and metastasis. Chemotherapy is the treatment of cancer with 1 or more cytotoxic anti-neoplastic drugs (“chemotherapeutic agents”) as part of a standardized regimen. At present, the optimal chemotherapy dosage can be difficult to determine due to a compromise between toxicity and efficacy. For this reason, chemotherapy sensitivity is of vital importance to guide the customized dose for individuals to maximize the effectiveness and minimize the adverse effects of chemotherapy [24].
BMI1 is proven to be involved in regulating cell apoptosis and proliferation, and BMI1 silencing could induce remarkable apoptosis and reduce the proliferation ability of U251 cells. Therefore, we hypothesized that BMI1 might influence the effect of chemotherapy on gliomas. In addition, there is no conclusive report about the influence of BMI1 gene on chemotherapy sensitivity in gliomas. For this reason, the BMI1-silenced U251 cells were treated with different concentrations of DDP (1, 3, and 5 μg/ml) [17,18] and then characterized. The apoptosis rate increased dramatically compared with normal U251 cells, and the cell viability decreased significantly, indicating the inhibition of cell proliferation and the possibility of better chemotherapy for patients. The above evidence indicates that silencing or reduced expression of the BMI1 gene could enhance chemotherapy effectiveness in the same concentration of DDP. In addition, if the BMI1 gene was down-regulated or silenced, chemotherapy with a lower concentration of DDP could have similar effectiveness, while reducing the adverse effects of chemotherapy.
Conclusions
BMI1 functions as an oncogene in glioma carcinogenesis. The silencing of BMI1 can enhance the chemotherapy sensitivity of DDP in U251 cells. In this context, BMI1 would be a new potential target gene for glioma treatment and provide guidance to show sensitivities of chemotherapy.
Footnotes
Competing interests
All authors announce that they have no competing interests.
Source of support: This work was supported by the National Natural Science Foundation of China (81172408, 81301862)
References
- 1.Kuhnt D, Becker A, Ganslandt O, et al. Correlation of the extent of tumor volume resection and patient survival in surgery of glioblastoma multiforme with high-field intraoperative MRI guidance. Neuro Oncol. 2011;13(12):1339–48. doi: 10.1093/neuonc/nor133. [DOI] [PMC free article] [PubMed] [Google Scholar]
- 2.Mrugala MM. Advances and challenges in the treatment of glioblastoma: a clinician’s perspective. Discov Med. 2013;15(83):221–30. [PubMed] [Google Scholar]
- 3.Wu B, Sha L, Wang Y, et al. Diagnostic and prognostic value of a disintegrin and metalloproteinase-17 in patients with gliomas. Oncol Lett. 2014;8(6):2616–20. doi: 10.3892/ol.2014.2582. [DOI] [PMC free article] [PubMed] [Google Scholar]
- 4.Burgio E, Migliore L. Towards a systemic paradigm in carcinogenesis: linking epigenetics and genetics. Mol Biol Rep. 2015;42(4):777–90. doi: 10.1007/s11033-014-3804-3. [DOI] [PubMed] [Google Scholar]
- 5.Vlachostergios PJ, Voutsadakis IA, Papandreou CN. Mechanisms of proteasome inhibitor-induced cytotoxicity in malignant glioma. Cell Biol Toxicol. 2013;29(4):199–211. doi: 10.1007/s10565-013-9248-z. [DOI] [PubMed] [Google Scholar]
- 6.Ugur HC, Taspinar M, Ilgaz S, et al. Chemotherapeutic resistance in anaplastic astrocytoma cell lines treated with a temozolomide-lomeguatrib combination. Mol Biol Rep. 2014;41(2):697–703. doi: 10.1007/s11033-013-2908-5. [DOI] [PubMed] [Google Scholar]
- 7.Shang C, Hong Y, Guo Y, et al. MiR-210 up-regulation inhibits proliferation and induces apoptosis in glioma cells by targeting SIN3A. Med Sci Monit. 2014;20:2571–77. doi: 10.12659/MSM.892994. [DOI] [PMC free article] [PubMed] [Google Scholar]
- 8.Aloia L, Di Stefano B, Di Croce L. Polycomb complexes in stem cells and embryonic development. Development. 2013;140(12):2525–34. doi: 10.1242/dev.091553. [DOI] [PubMed] [Google Scholar]
- 9.Crea F, Paolicchi E, Marquez VE, Danesi R. Polycomb genes and cancer: time for clinical application? Crit Rev Oncol Hematol. 2012;83(2):184–93. doi: 10.1016/j.critrevonc.2011.10.007. [DOI] [PubMed] [Google Scholar]
- 10.van Lohuizen M1, Verbeek S, Scheijen B, et al. Identification of cooperating oncogenes in E mu-myc transgenic mice by provirus tagging. Cell. 1991;65(5):737–52. doi: 10.1016/0092-8674(91)90382-9. [DOI] [PubMed] [Google Scholar]
- 11.Lu H, Sun HZ, Li H, Cong M. The clinicopathological significance of Bmi-1 expression in pathogenesis and progression of gastric carcinomas. Asian Pac J Cancer Prev. 2012;13(7):3437–41. doi: 10.7314/apjcp.2012.13.7.3437. [DOI] [PubMed] [Google Scholar]
- 12.Pun JC, Chan JY, Chun BK, et al. Plasma Bmi1 mRNA as a potential prognostic biomarker for distant metastasis in colorectal cancer patients. Mol Clin Oncol. 2014;2(5):817–20. doi: 10.3892/mco.2014.321. [DOI] [PMC free article] [PubMed] [Google Scholar]
- 13.Rajabpour FV, Raoofian R, Youssefian L, et al. BMI1 and TWIST1 downregulated mRNA expression in basal cell carcinoma. Asian Pac J Cancer Prev. 2014;15(8):3797–800. doi: 10.7314/apjcp.2014.15.8.3797. [DOI] [PubMed] [Google Scholar]
- 14.Yamazaki H, Mori T, Yazawa M, et al. Stem cell self-renewal factors Bmi1 and HMGA2 in head and neck squamous cell carcinoma: clues for diagnosis. Lab Invest. 2013;93(12):1331–38. doi: 10.1038/labinvest.2013.120. [DOI] [PubMed] [Google Scholar]
- 15.Pun JC, Chan JY, Chun BK, et al. Plasma Bmi1 mRNA as a potential prognostic biomarker for distant metastasis in colorectal cancer patients. Mol Clin Oncol. 2014;2(5):817–20. doi: 10.3892/mco.2014.321. [DOI] [PMC free article] [PubMed] [Google Scholar]
- 16.Zhang X, Sun J, Wang H, et al. IGF-1R and Bmi-1 expressions in lung adenocarcinoma and their clinicopathologic and prognostic significance. Tumour Biol. 2014;35(1):739–45. doi: 10.1007/s13277-013-1100-9. [DOI] [PubMed] [Google Scholar]
- 17.Shang C, Zhang H, Guo Y, et al. MiR-320a down-regulation mediates bladder carcinoma invasion by targeting ITGB3. Mol Biol Rep. 2014;41(4):2521–27. doi: 10.1007/s11033-014-3110-0. [DOI] [PubMed] [Google Scholar]
- 18.Zhou YT, Li K, Tian H. Effects of Vinorelbine on Cisplatin Resistance Reversal in Human Lung Cancer A549/DDP Cells. Asian Pac J Cancer Prev. 2013;14:4635–69. doi: 10.7314/apjcp.2013.14.8.4635. [DOI] [PubMed] [Google Scholar]
- 19.Jiang S, Yuan S, Wang Y, et al. Study on sensitivity of neuroglioma to chemotherapeutic drugs. Hua Xi Yi Ke Da Xue Xue Bao. 2000;31:191–92. 232. [PubMed] [Google Scholar]
- 20.Ye L, Wang C, Yu G, et al. Bmi-1 induces radioresistance by suppressing senescence in human U87 glioma cells. Oncol Lett. 2014;8(6):2601–6. doi: 10.3892/ol.2014.2606. [DOI] [PMC free article] [PubMed] [Google Scholar]
- 21.He Q, Liu Z, Zhao T, et al. Bmi1 drives stem-like properties and is associated with migration, invasion, and poor prognosis in tongue squamous cell carcinoma. Int J Biol Sci. 2015;11(1):1–10. doi: 10.7150/ijbs.10405. [DOI] [PMC free article] [PubMed] [Google Scholar]
- 22.Saudy NS, Fawzy IM, Azmy E, et al. BMI1 gene expression in myeloid leukemias and its impact on prognosis. Blood Cells Mol Dis. 2014;53(4):194–98. doi: 10.1016/j.bcmd.2014.07.002. [DOI] [PubMed] [Google Scholar]
- 23.Li J, Gong LY, Song LB, et al. Oncoprotein Bmi-1 renders apoptotic resistance to glioma cells through activation of the IKK-nuclear factor-kappaB Pathway. Am J Pathol. 2010;176(2):699–709. doi: 10.2353/ajpath.2010.090502. [DOI] [PMC free article] [PubMed] [Google Scholar]
- 24.Yang I, Aghi MK. New advances that enable identification of glioblastoma recurrence. Nat Rev Clin Oncol. 2009;6:648–57. doi: 10.1038/nrclinonc.2009.150. [DOI] [PubMed] [Google Scholar]


