Abstract
Introduction Over the past 20 years, magnetic resonance imaging (MRI) has advanced due to new techniques involving increased magnetic field strength and developments in coils and pulse sequences. These advances allow increased opportunity to delineate the complex skull base anatomy and may guide the diagnosis and treatment of the myriad of pathologies that can affect the skull base.
Objectives The objective of this article is to provide a brief background of the development of MRI and illustrate advances in skull base imaging, including techniques that allow improved conspicuity, characterization, and correlative physiologic assessment of skull base pathologies.
Data Synthesis Specific radiographic illustrations of increased skull base conspicuity including the lower cranial nerves, vessels, foramina, cerebrospinal fluid (CSF) leaks, and effacement of endolymph are provided. In addition, MRIs demonstrating characterization of skull base lesions, such as recurrent cholesteatoma versus granulation tissue or abscess versus tumor, are also provided as well as correlative clinical findings in CSF flow studies in a patient pre- and post-suboccipital decompression for a Chiari I malformation.
Conclusions This article illustrates MRI radiographic advances over the past 20 years, which have improved clinicians' ability to diagnose, define, and hopefully improve the treatment and outcomes of patients with underlying skull base pathologies.
Keywords: Skull Base, Magnetic Resonance Imaging, Techniques
Introduction
In the past two decades, numerous advancements and improvements in magnetic resonance imaging (MRI) have increased its ability to assess the skull base. These include the U.S. Food and Drug administration (FDA) approval of 3-T MRI scanners for clinical imaging and the development of unique coils and pulse sequences. These improvements increased MRI's clinical utility for skull base evaluation, and they allow better delineation, characterization, and treatment of skull base lesions. Although many textbooks cover the entirety of this subject, this brief article's focus is to simply introduce and familiarize readers with the multiple recent advances in MRI techniques and radiographic features and the tremendous potential that these techniques hold in improving the conspicuity, characterization, and correlative clinical assessment of the myriad skull base pathologies.
Review of Literature
A brief introduction to the history of MRI and imaging physics is provided, along with a description of MRI techniques that improve conspicuity, namely, advances aiding in identification of small structures and pathology. Advances in MRI characterization of skull base lesions and correlative physiologic techniques are also described. This article hopes to improve awareness of MRI advances and their radiographic manifestations, which may guide clinicians to the appropriate diagnosis, treatment, and ideally improved outcomes in patients suffering from a skull base abnormality.
To best understand the advances in MRI radiographic techniques of the skull base, a brief background of MRI physics is helpful, as it provides a framework to the newer MRI advances allowing improved interrogation of the skull base pathologies. After a presentation on the background and development of MRI, radiographic examples utilizing skull base MRI are presented. The first set of radiographic features and advances in MRI to be illustrated include improvements allowing greater conspicuity of normal and pathologic minute skull base structures, such as cranial nerves, vessels, foramina, or cerebrospinal fluid (CSF) leaks. Second, images demonstrating MRI advances that improve characterization of skull base pathology are presented, including improved delineation of pituitary microadenomas, perineural tumoral spread, and diffusion-weighted imaging (DWI) to distinguish tumor from abscess or scar tissue from recurrent tumors or characterization of one tumor type versus another. Finally, radiographic advances in MRI that enable correlative analysis of skull base pathology with physiology and treatment including intraoperative MRI and MRI CSF flow dynamic studies are presented, which allow clinicians to assess pre- and postoperative Chiari malformations.
The history of magnetic resonance starts in 1882, with Nikola Tesla, a Serbian immigrant who came to America and discovered the rotating magnetic field, a fundamental concept in physics utilized in alternate current induction motors and for the transmission, generation, and distribution of electric power. In honor of his work, the world unit of magnetic flux density is now referred to as “Tesla,” where 1 T is equal to 10,000 G. All magnetic field strengths are referred to as “Tesla units,” designated in 1956 by the International Electrotechnical Commission–Committee of Action, and since then, the field strength of MRI scanners are designated by their Tesla field strength.1
Discoveries in magnetism are also attributed to Sir Joseph Larmor (1857 to 1942), an Irish physicist who determined that the frequency of an atom's spin or its spinning nuclear magnetic moment (w) is directly proportional to the product of the external magnet field strength (Bo) and the gyromagnetic ratio (y), which is a constant for each atom, or in equation form: w = yBo. This equation is valuable because it states that the frequency in which an atom's nucleus absorbs energy and alters its alignment with the external magnetic field is specific for each nucleus, with the gyromagnetic ratio being a constant.2 Fifty-five years after Tesla's discovery, in Columbia University (New York City, New York, United States), Professor Isidor I. Rabi noted the spinning effects and quantum effects of nuclear magnetic resonance, in which an atomic nuclei absorbs or emits a radio wave when exposed to an external magnetic field; Rabi was honored in 1944 with the Nobel Prize for his work.3 In 1946, teams headed by Edward Purcell and Felix Bloch successfully performed a nuclear magnetic resonance experiment to study a chemical, and in 1952 they received the Nobel Prize in physics for “their development of new methods for nuclear magnetic precision measurements and discoveries in connection therewith.”4 5
In 1971, Raymond Damadian, a doctor at Brooklyn's Downstate Medical Center, published an article in Science noting that the MRI hydrogen signal in cancerous tissue is different from normal tissue because the former contains more water and because radio waves from this tissue last longer than normal tissue.6 At this time, Sir Peter Mansfield utilized magnetic field gradients to create a one-dimensional projection of camphor. Mansfield also conceived of echo-planar imaging that can complete a two-dimensional image from a single pulse excitation, publishing the first slice excitation and MRIs of a human being. In 1973, Paul Lauterbur combined concepts of computed tomography (CT) scanning utilizing multiple projections and gradient field strength to localize each atom in space, and on July 3, 1977, the first human MRI scan was obtained. Both Lauterber and Mansfield received the 2003 Nobel Prize in Physiology and Medicine “for their discoveries concerning magnetic resonance imaging.”7 In 1980, General Electric's Paul Bottomley built the first 1.5-T MRI scanner; and by 2014, there were currently more than 20,000 MRI scanners in use. In 1998, the FDA gave marketing clearance for scanners up to field strengths of 4.0 T, and in 2002 the FDA approved 3-T MRI scanners for the skull base, brain, and whole body. Because of the increased external magnetic field strength (Bo), the newer 3-T MRI machines and development of improved pulse sequences and coils offer improved signal-to-noise ratios (SNRs), resulting in improved imaging of the skull base.8
Essentially, MRI creates an external strong magnet field, and the protons in the body composed of hydrogen atoms behave like small magnets, aligning themselves with the field. A radio wave then stimulates the protons, changing their orientation. After the radio wave pulse is stopped, the protons realign themselves and transmit a signal. The signals are collected by a receiver coil and generate a map of signals, based on the radiofrequency of the signal emitted by the tissue. Utilization of these techniques with advancements in technology including optimization of the coil placement around the patient to generate and re-receive the radiofrequency waves, as well as advances in applications of pulse sequences, have improved MRI analysis of the skull base. Therefore, the key advancements in the past few decades in MRI skull base imaging have resulted from an increased 3-T field strength for improved SNRs, and the improvements continue the development of new pulse sequences and radiofrequency coils. When obtaining an MRI, the radiofrequency coils are placed over the body part to be imaged and serve to both emit and receive the radio wave pulse sequences. MRI coils are classified into two areas, either volume coils that provide a similar transmission and reception over an anatomic region or surface coils that function best over small areas of interest.9 10
Discussion
The 3.0-T MRI and newer coil design in skull base imaging have improved resolution and conspicuity of the small nerves and foramina in the complex skull base region.11 Increased visualization of small cranial nerves and foramina can be obtained with a head coil placed over the patient and with volume-phased array coils. These coils have the advantage of evaluating the entire skull base with good SNR. In addition, developments in pulse sequence, which allow for submillimeter scanning with slice thicknesses of 0.9 mm with heavily T2-weighted sequences, postcontrast sequences, and postcontrast sequences with fat saturation, have improved the conspicuity of the small vessels and nerves of the skull base (Fig. 1A to H). The combination of the improved resolution at 3 T and submillimeter slice thickness allows for increased visualization of vascular contact near the root entry zones of the skull base cranial nerves that may result in trigeminal neuralgia, left hemifacial spasm, or tongue and swallowing difficulties, as demonstrated in Fig. 2.12 13 14
Fig. 1.
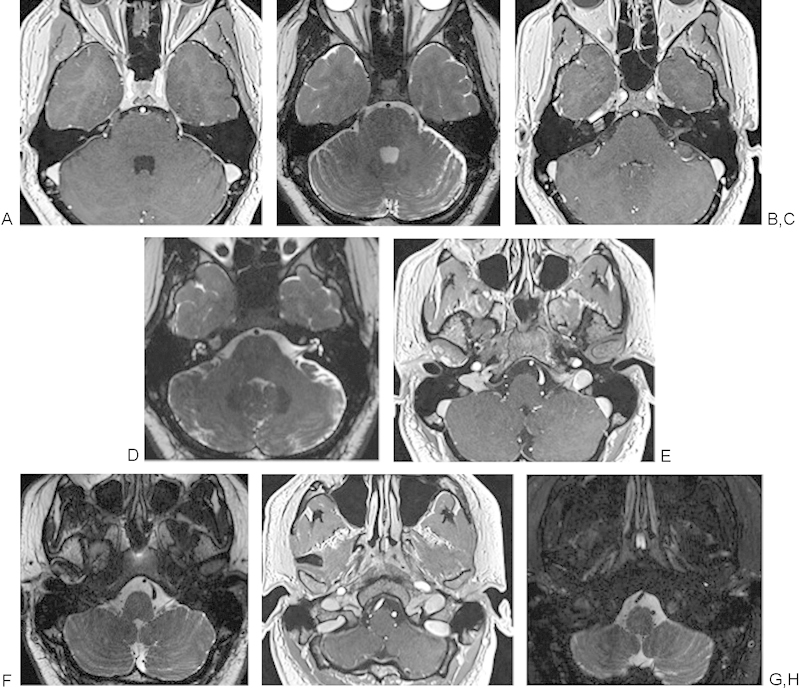
(A, C, E, G) Axial T1-weighted post–gadolinium contrast submillimeter VIBE sequences of the lower brainstem cranial nerves (CNs) V to XII. (B, D, F, H) Thin-section heavily T2-weighted continuous acquisition in the steady state magnetic resonance images of the sequences of the lower brainstem CNs V to XII. (A, B) CNs V and VI, trigeminal and abducens nerves. (C, D) CNs VII and VIII, facial and vestibulocochlear nerves. (E, F) CNs IX, X, XI, and glossopharyngeal, vagus, and spinal accessory nerves. (G, H) Portions of CNs IX, X, XI extending into the jugular foramen and cranial nerve XII, hypoglossal nerve, extending into the hypoglossal canal.
Fig. 2.
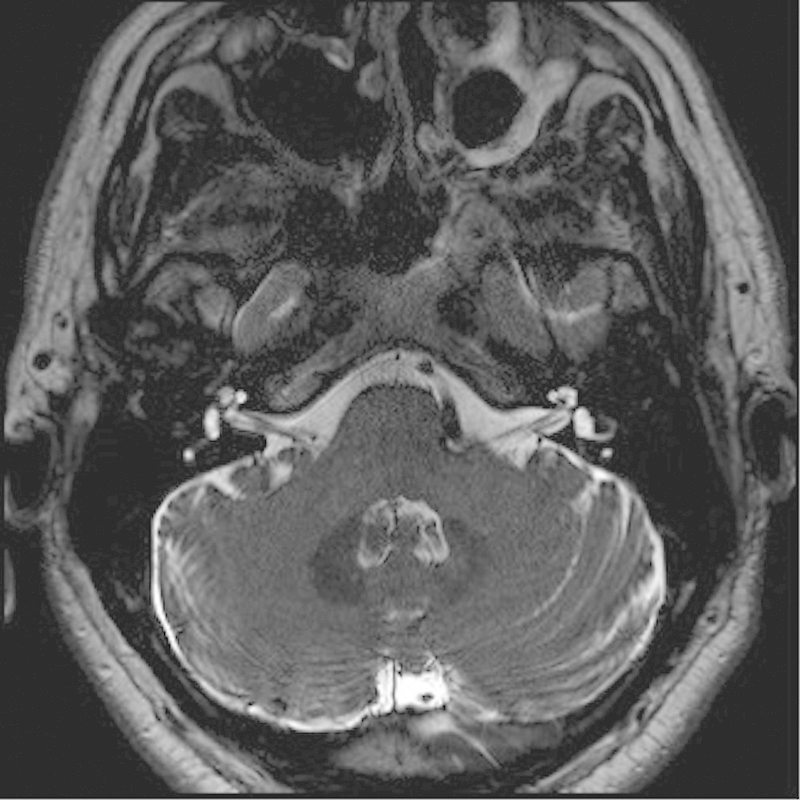
Axial T2-weighted magnetic resonance imaging of the bilateral internal auditory canals and cranial nerves (CNs) VII and VIII. Note the dolichoectatic left vertebral artery with compression of the root entry zone, the left CN VII, and CN VIII that can result in left facial hemispasm.
In addition, improvement in heavily weighted T2 sequences allows for increased delineation of CSF, which appears bright on these T2 sequences, and allows for identification of small skull base defects and sites of CSF leakage, as well as distinguishing brain parenchyma from trapped secretions without exposing the patient to ionizing radiation as shown in Fig. 3.14
Fig. 3.
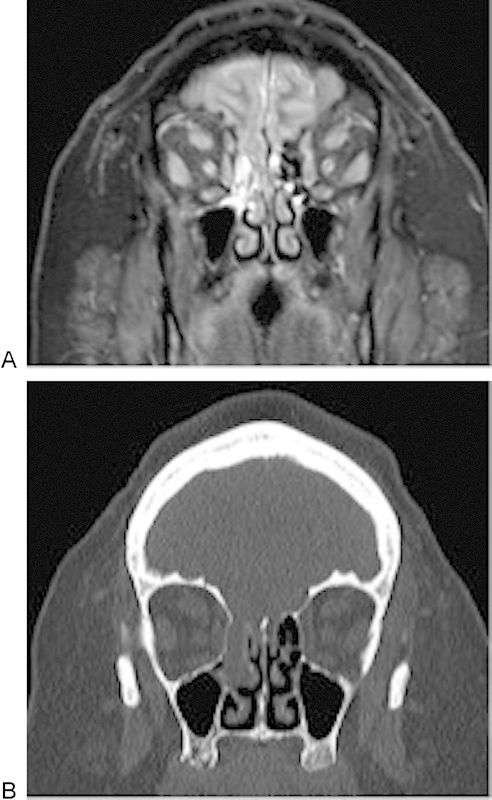
(A) A 3-T coronal STIR through the sinuses in a 43-year-old woman with cerebrospinal fluid rhinorrhea reveals a bony defect in the right horizontal lamella, just lateral to the crista galli. (B) Although the computed tomography also demonstrates the bony defect, the magnetic resonance image (A) better delineates the encephalocele and brain parenchyma herniating through the defect.
The improved resolution of small structures also allows better characterization of the structures within the skull base. The utilization of higher field strengths in 3-T MRI with attention to the central skull base and pituitary with thin-section dynamic contrast injections and thin-section imaging of the pituitary have led to improved delineation of microadenomas of the pituitary gland,15 16 as seen in Fig. 4A to D.
Fig. 4.
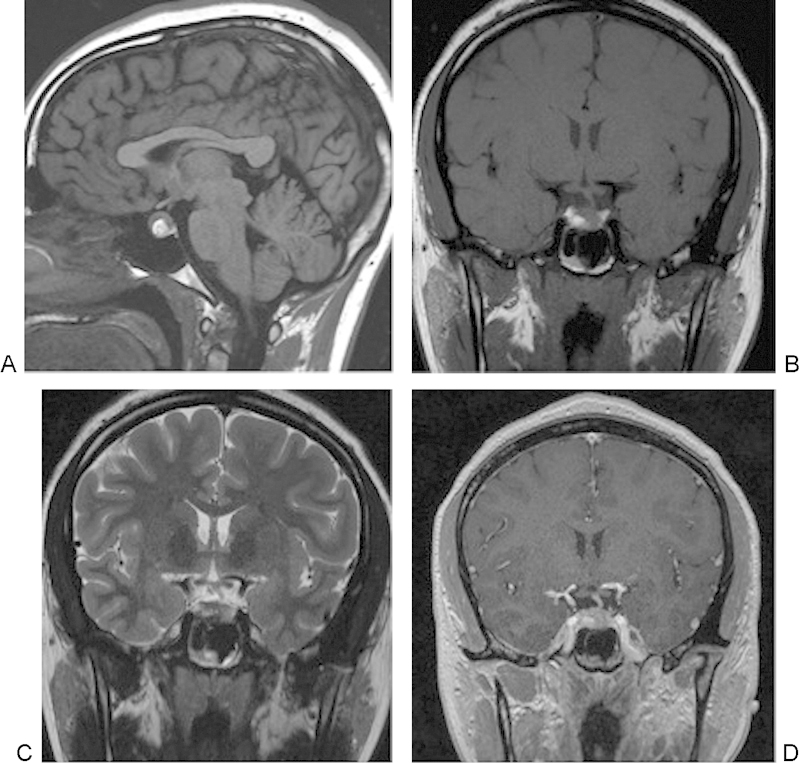
(A-D) A 3-T magnetic resonance image of a 21-year-old woman with elevated prolactin demonstrates a hemorrhagic pituitary adenoma in the inferior right lateral gland, with intrinsic increased T1-weighted signal and decreased T2-weighted signal, with a small air fluid level, suggestive of hemorrhagic blood products. Note how the infundibulum and the remaining pituitary gland are deviated to the left of midline.
In addition, recent and continuing advances have improved the assessment of Meniere disease or endolymphatic hydrops. Meniere disease is idiopathic, and patients present with a fluctuating sensorineural hearing loss, tinnitus, aural fullness, and vertigo. Utilizing higher field strengths in 3-T MRI and either intratympanic or intravenous injection of gadolinium, the diagnosis of an enlarged endolymphatic space within the inner ear with a decreased size of the perilymph can now be made.17 18 19 In Fig. 5, a patient with Meniere disease underwent intratympanic injection of gadolinium with subsequent scanning performed on a 3-T MRI 24 hours later. The gadolinium contrast diffuses into the perilymphatic space, but in endolymphatic hydrops, the enlarged endolymph effaces the enhancing perilymphatic space.
Fig. 5.
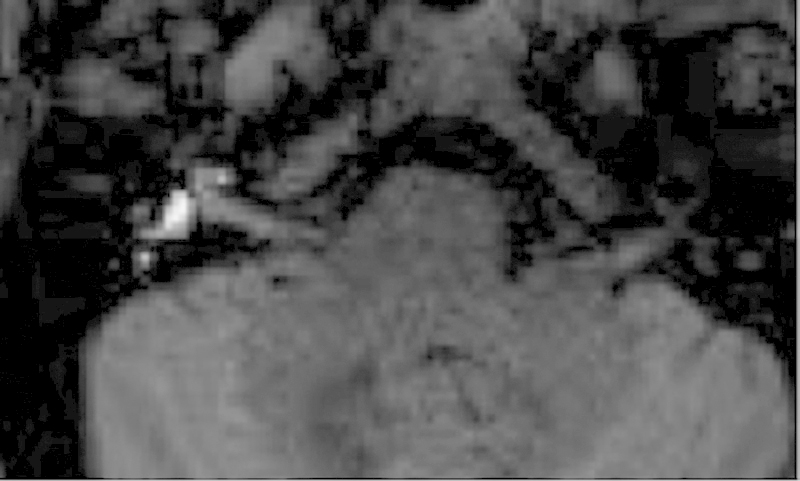
A 44-year-old man with Meniere disease, or endolymphatic hydrops. Gadolinium was injected intratympanically; after 24 hours, the gadolinium contrast extends throughout the perilymphatic space. If the endolymphatic space is enlarged, as seen on this 3-T thin-section axial T1-weighted magnetic resonance image, the enlarged endolymphatic space appears gray and effaces the contrast-enhancing perilymph.
Advances in MRI gadolinium and fat-saturation techniques also have improved the important role of preoperative treatment mapping for either surgery or radiation therapy in patients with skull base tumors with perineural spread.20 21 In certain regions of likely increased perineural tumoral involvement, especially in the periparotid, preauricular, and temporal regions, it is critical to define the margins for either surgical planning or radiation therapy. A tumor can track along the smaller intraparotid facial nerve branches to the auriculotemporal nerve, creating a pathway for the tumor to extend to the mandibular branches of the trigeminal nerve and increasing the chance of tumor spread into the temporal bone via the stylomastoid foramen or intracranially via the foramen ovale. Improved utilization of high field strength techniques with 3-T MRI and careful attention to these regions can now delineate perineural involvement along small facial nerve branches within the parotid gland, which may not be appreciated at 1.5-T MRI, as shown in Fig. 6.20 21
Fig. 6.
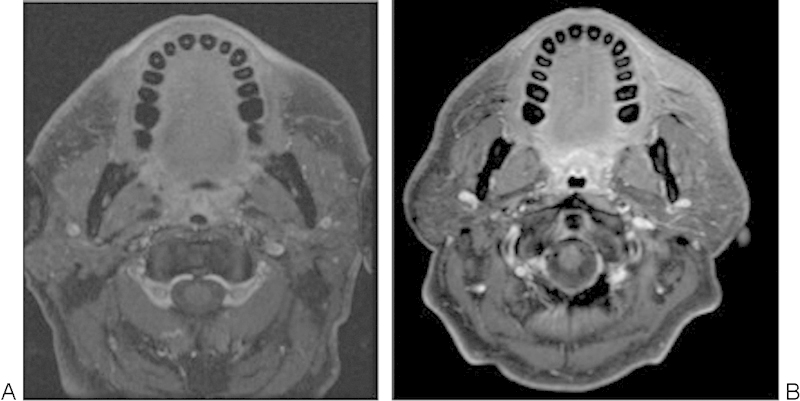
A 53-year-old man with left temporal squamous cell carcinoma. (A) Axial T1 postgadolinium fat-saturated magnetic resonance imaging (MRI) at 1.5 T was read as negative for perineural tumoral spread. (B) Axial T1-ewighted postgadolinium fat-saturated MRI obtained within weeks of the first scan on a 3.0-T MRI demonstrates linear enhancement of the intraparotid branches of the facial nerve, confirmed to be perineural tumoral spread intraoperatively and histopathologically. (Findings presented at the Combined Otolaryngology Society Meeting, April 2012.)
The development of MRI pulse sequence techniques such as DWI and MRI spectroscopy allows clinicians to characterize the contents of a skull base lesion, narrow the differential diagnosis, and determine the clinical diagnosis and treatment considerations. Importantly, in distinguishing a rim-enhancing lesion, DWI has proven to be very sensitive and specific, in that abscesses due to the decreased mobility of water protons in pyogenic material demonstrate a reduced apparent diffusion coefficient (ADC) on the ADC map images and hyperintense signal on DWI sequences. These distinctions may be extremely important in distinguishing a skull base osteomyelitis that may occur in patients with diabetes or immunocompromised or older patients versus neoplastic skull base invasion.22 23 In Fig. 7, the left temporal lobe abscess demonstrates decreased signal on the ADC map and bright signal on the DWI. Additional researchers have combined both DWI with spectroscopy, noting that in addition to the restricted diffusion occurring in pyogenic abscesses, analysis of the nuclear magnetic resonance spectra of patients with abscess demonstrates additional resonance peaks of multiple amino acids, including valine, leucine, and isoleucine; acetate, alanine, and lactate; and occasionally succinate.24
Fig. 7.
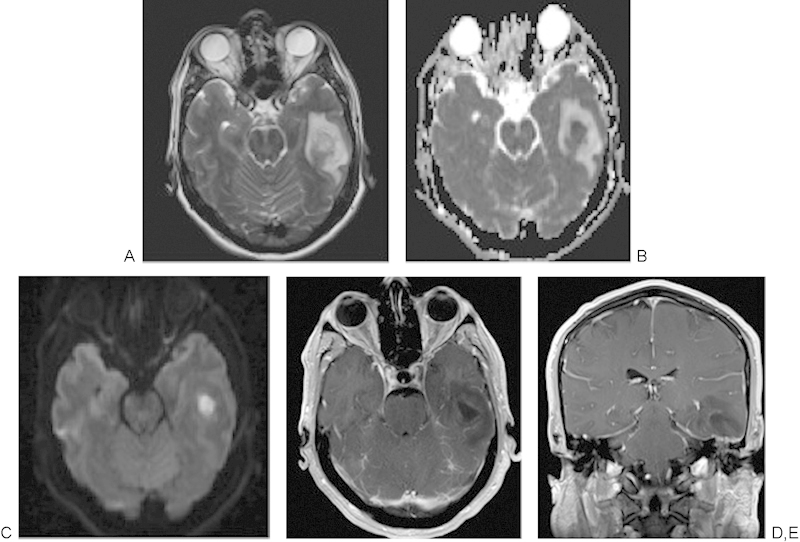
A 50-year-old man with dehiscent left tegmen tympani and left otitis media with dehiscent tegmen tympani developed a left temporal lobe abscess. (A) A 3-T magnetic resonance imaging axial image demonstrating abnormal increased T2-weighted signal throughout the left temporal lobe with central area of heterogeneous signal. (B) The acute diffusion coefficient map demonstrates markedly restricted diffusion that appears bright (C) in the diffusion-weighted sequence, consistent with a left temporal lobe abscess. (D, E) Axial and coronal T1-weighted images postcontrast, with a rim-enhancing abscess collection that extends inferiorly to the dehiscent left tegmen tympani and the opacified left mastoid.
Recent research on the skull base and adjacent vertebra has improved the delineation of the infectious change within the disk compared with regions of degenerative change, although degenerative change and diskitis may both exhibit increased T2 signal on heavily T2-weighted soft tissue inversion sequences and contrast enhancement. However, on DWI of the vertebra, if only the margins of the normal and vascularized bone marrow demonstrate increased signal, the findings resemble the appearance of a crab's claw and likely represent degenerative change, as opposed to an underlying diskitis.25
Diffusion-weighted techniques are also useful in assessing patients who have undergone surgery for a temporal bone cholesteatoma, in distinguishing a recurrent cholesteatoma from postoperative granulation changes, and in helping patients avoid an unnecessary second-look surgery.26 27 28 29 These findings are illustrated nicely in Fig. 8A to D, with the bright signal on the echo-planar study revealing the foci of the recurrent cholesteatoma.
Fig. 8.

A 47-year-old man had chronic eustachian tube dysfunction and studies were obtained to rule out recurrent cholesteatoma. (A) Axial temporal bone computed tomography demonstrating opacification of the bilateral mastoid air cells and middle ear. (B) Acute diffusion coefficient map with decreased signal in the right mastoid air cells. (C) Echo-planar diffusion-weighted image demonstrating a focus of bright signal consistent with recurrent cholesteatoma in the right mastoid air cells.
In addition, recent studies have shown that skull base tumors such as chordoma and chondrosarcomas demonstrate differences in diffusion weighted imaging that help distinguish the two entities. Chordomas tend to contain vacuolated physaliferous cells arranged in a myxoid stroma, and chondrosarcomas tend to contain atypical chondrocytes with hyperchromatic enlarged nuclei in a cartilaginous matrix. These cell types contain different water content, and chondrosarcomas are associated with the highest mean ADC value ranging from 2,051 ± 261 × 10−6 mm2/s compared with classic chordomas that have lower ADC value of 1,474 ± 117 × 10−6 mm2/s; thus the imaging may provide important prospective clues to pathology prior to surgical treatment.30
Finally, MRI is playing an increasing role in evaluating treatment and physiology of skull base pathology including new techniques that measure MRI CSF flow dynamics in pre- and postoperative Chiari malformations and improved intraoperative MRI capabilities. The complex anatomy of the skull base centered on the sphenoid bone leads this area to have multiple pathologies; although CT and the first generations of MRI scanners and coils at 1.5 T provided information regarding skull base bony anatomy and pathology, new advances in MRI in field strength, coil design, and pulse sequences are continually improving these capabilities.31 MRI techniques now provide correlative clinical information regarding pathology and can help guide and assess treatment response. Advanced techniques include phase contrast MRI measurements that allow for imaging of arterial, venous, and CSF flow. In adult humans, the total CSF volume is 90 to 150 mL and is formed at ∼0.3 to 0.4 mL/min−1 or roughly 500 mL/d−1. CSF circulates with a bulk circulatory flow and pulsatile back-and-forth flow.32 In phase contrast MRI, the signal is generated between flowing and stationary nuclei by sensitizing the phase of the transverse magnetization to the velocity of motion.33 Data sets are acquired with opposite sensitization, creating an opposite phase for moving nuclei; the phase will vary from the location of the nuclei. If they move, after subtraction of the data sets the signal is calculated from the moving signal; however, stationary nuclei will have a net phase of 0 and elimination of their signal. Prior to these studies, the predicted maximum CSF flow velocity is placed in the pulse sequence protocol, called a velocity encoding gradient.34 The CSF flow coordinates with the cardiac cycle and provides valuable preoperative information prior to shunt placement in hydrocephalus, Chiari I malformations, aqueductal stenosis, and outcomes from ventriculostomies.35 Newer techniques allow for simultaneous measurements of arterial, venous, and CSF flow in a single MRI acquisition.36 In the skull base, this information is helpful in understanding Chiari I malformations and the postoperative response to surgery, with previous reports describing CSF flow obstruction occurring from the inferior tonsillar ectopia that may result in a pressure gradient, which may be a useful prognostic tool for patients who need to undergo surgery.37 There are continued ongoing improvements in study of MRI CSF flow dynamics with newer techniques including time-spatial labeling inversion pulse that can now tag a CSF region of interest and help assess both bulk and turbulent flow, whose clinical utility is yet to be discovered.38 Fig. 9 illustrates the pre- and postoperative findings in a 31-year-old woman after suboccipital decompression for a Chiari I malformation.
Fig. 9.
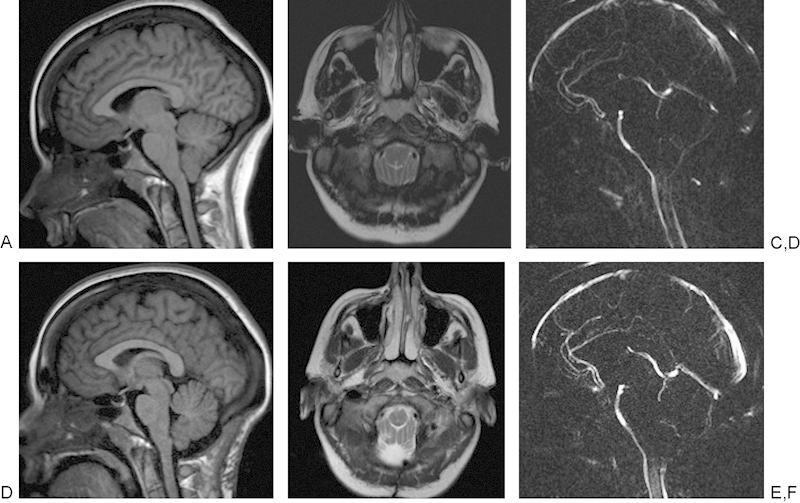
A 31-year-old woman with Chiari I malformation had 3-T magnetic resonance imaging (MRI). (A) Sagittal T1-weighted image demonstrating downward displacement of the cerebellar tonsils by ∼9 mm. (B) Axial T2-weighted MRI reveals lack of cerebrospinal fluid (CSF) surrounding the cervicomedullary junction. (C) MRI CSF flow study noting lack of flow in the dorsal foramen magnum in the region of the inferiorly displaced cerebellar tonsils. (D) A 3-T sagittal T1-weighted MRI after suboccipital decompression. (E) Axial T2-weighted images with improved visualization of the CSF spaces postoperatively. (F) Repeat CSF flow study obtained after the suboccipital decompression with increased flow extending along the posterior margin of the foramen magnum.
The complete discussion of intraoperative MRI utilization is beyond the scope of this article; however, numerous publications have demonstrated the efficacy and important utilization of virtual real-time imaging data in the intraoperative setting, especially with complex endoscopic resections in patients with skull base anomalies or pituitary lesions.39 40 Recent pilot studies have also noted that intraoperative MRI may help predict the consistency of certain tumors such as schwannomas, which may affect treatment and outcomes.41
Final Comments
In summary, over the past 20 years, numerous advances in MRI technology have allowed clinicians to better diagnose, delineate, and define treatment for patients who have underlying skull base pathologies. This article has briefly highlighted these developments, including better conspicuity of small skull base structures such as cranial nerves, foramina, skull base leaks, or the endolymph and perilymph of the inner ear. Second, advances have improved conspicuity and characterization of skull base pathology, including tumoral, either primary such as a pituitary microadenoma or secondary including small neural branches of perineural tumoral spread or occipital skull base metastases. MRI can now help distinguish chordoma from chondrosarcoma or abscess from tumor, can help quantify skull base physiology such as CSF flow dynamics, and can provide intraoperative guidance. Awareness of these MRI advances will help guide clinicians to improve treatment and outcomes in patients with underlying skull base pathology.
References
- 1.Smith J. Recommendations of IEC Technical Committee 24: electric and magnetic magnitudes and units. Electr Eng. 1955;74:406–408. [Google Scholar]
- 2.Geva T. Magnetic resonance imaging: historical perspective. J Cardiovasc Magn Reson. 2006;8(4):573–580. doi: 10.1080/10976640600755302. [DOI] [PubMed] [Google Scholar]
- 3.Rabi I I, Zacharias J R, Millman S, Kusch P. A new method of measuring nuclear magnetic moment. Phys Rev. 1938;53:318. doi: 10.1002/jmri.1880020203. [DOI] [PubMed] [Google Scholar]
- 4.Bloch F, Hansen W, Packard M. Nuclear induction. Phys Rev. 1946;69:127. [Google Scholar]
- 5.Purcell E M, Torrey H C, Pound R V. Resonance absorption by nuclear magnetic moments in a solid. Phys Rev. 1946;69:37. [Google Scholar]
- 6.Damadian R. Tumor detection by nuclear magnetic resonance. Science. 1971;171(3976):1151–1153. doi: 10.1126/science.171.3976.1151. [DOI] [PubMed] [Google Scholar]
- 7.Lauterbur P C. Image formation by induced local interactions: examples employing nuclear magnetic resonance. Nature. 1973;242:190–191. [PubMed] [Google Scholar]
- 8.Willinek W A, Schild H H. Clinical advantages of 3.0 T MRI over 1.5 T. Eur J Radiol. 2008;65(1):2–14. doi: 10.1016/j.ejrad.2007.11.006. [DOI] [PubMed] [Google Scholar]
- 9.Welker K M, Tsuruda J S, Hadley J R, Hayes C E. Radio-frequency coil selection for MR imaging of the brain and skull base. Radiology. 2001;221(1):11–25. doi: 10.1148/radiol.2211001537. [DOI] [PubMed] [Google Scholar]
- 10.Driscoll C LW Lane J I Advances in skull base imaging Otolaryngol Clin North Am 2007403439–454., vii [DOI] [PubMed] [Google Scholar]
- 11.Casselman J Mermuys K Delanote J Ghekiere J Coenegrachts K MRI of the cranial nerves—more than meets the eye: technical considerations and advanced anatomy Neuroimaging Clin N Am 2008182197–231., x [DOI] [PubMed] [Google Scholar]
- 12.Linn J, Peters F, Moriggl B, Naidich T P, Brückmann H, Yousry I. The jugular foramen: imaging strategy and detailed anatomy at 3T. AJNR Am J Neuroradiol. 2009;30(1):34–41. doi: 10.3174/ajnr.A1281. [DOI] [PMC free article] [PubMed] [Google Scholar]
- 13.Roldan-Valadez E, Martinez-Anda J J, Corona-Cedillo R. 3T MRI and 128-slice dual-source CT cisternography images of the cranial nerves a brief pictorial review for clinicians. Clin Anat. 2014;27(1):31–45. doi: 10.1002/ca.22311. [DOI] [PubMed] [Google Scholar]
- 14.Algin O, Hakyemez B, Gokalp G, Ozcan T, Korfali E, Parlak M. The contribution of 3D-CISS and contrast-enhanced MR cisternography in detecting cerebrospinal fluid leak in patients with rhinorrhoea. Br J Radiol. 2010;83(987):225–232. doi: 10.1259/bjr/56838652. [DOI] [PMC free article] [PubMed] [Google Scholar]
- 15.Linn J, Peters F, Lummel N. et al. Detailed imaging of the normal anatomy and pathologic conditions of the cavernous region at 3. Tesla using a contrast-enhanced MR angiography. Neuroradiology. 2011;53(12):947–954. doi: 10.1007/s00234-011-0837-3. [DOI] [PubMed] [Google Scholar]
- 16.Kasaliwal R, Sankhe S S, Lila A R. et al. Volume interpolated 3D-spoiled gradient echo sequence is better than dynamic contrast spin echo sequence for MRI detection of corticotropin secreting pituitary microadenomas. Clin Endocrinol (Oxf) 2013;78(6):825–830. doi: 10.1111/cen.12069. [DOI] [PubMed] [Google Scholar]
- 17.Fukuoka H, Takumi Y, Tsukada K. et al. Comparison of the diagnostic value of 3 T MRI after intratympanic injection of GBCA, electrocochleography, and the glycerol test in patients with Meniere's disease. Acta Otolaryngol. 2012;132(2):141–145. doi: 10.3109/00016489.2011.635383. [DOI] [PMC free article] [PubMed] [Google Scholar]
- 18.Barath K, Schuknecht B, Naidi A M. et al. Detection and grading of endolymphatic hydrops in Meniere disease using MRI imaging. AJNR Am J Neuroradiol. 2014;35:1–6. doi: 10.3174/ajnr.A3856. [DOI] [PMC free article] [PubMed] [Google Scholar]
- 19.Una A, Horii A, Imai T. et al. Endolymphatic hydrops detected with inner ear Gd contrast-enhanced MRI; comparison between administration routes or with ECochG or glycerol test. Nihon Jibinkoka Gakkai. 2013;116(80):960–968. doi: 10.3950/jibiinkoka.116.960. [DOI] [PubMed] [Google Scholar]
- 20.Schmalfuss I M, Tart R P, Mukherji S, Mancuso A A. Perineural tumor spread along the auriculotemporal nerve. AJNR Am J Neuroradiol. 2002;23(2):303–311. [PMC free article] [PubMed] [Google Scholar]
- 21.Penn R, Abemayor E, Nabili V, Bhuta S, Kirsch C. Perineural invasion detected by high-field 3.0-T magnetic resonance imaging. Am J Otolaryngol. 2010;31(6):482–484. doi: 10.1016/j.amjoto.2009.07.004. [DOI] [PubMed] [Google Scholar]
- 22.Kastrup O, Wanke I, Maschke M. Neuroimaging of infections. NeuroRx. 2005;2(2):324–332. doi: 10.1602/neurorx.2.2.324. [DOI] [PMC free article] [PubMed] [Google Scholar]
- 23.Ozgen B, Oguz K K, Cila A. Diffusion MR imaging features of skull base osteomyelitis compared with skull base malignancy. AJNR Am J Neuroradiol. 2011;32(1):179–184. doi: 10.3174/ajnr.A2237. [DOI] [PMC free article] [PubMed] [Google Scholar]
- 24.Lai P H, Ho J T, Chen W L. et al. Brain abscess and necrotic brain tumor: discrimination with proton MR spectroscopy and diffusion-weighted imaging. AJNR Am J Neuroradiol. 2002;23(8):1369–1377. [PMC free article] [PubMed] [Google Scholar]
- 25.Patel K B Poplawski M M Pawha P S Naidich T P Tanenbaum L N Diffusion-weighted MRI “claw sign” improves differentiation of infectious from degenerative modic type 1 signal changes of the spine AJNR Am J Neuroradiol 2014; (e-pub ahead of print) [DOI] [PMC free article] [PubMed] [Google Scholar]
- 26.Edfeldt L, Strömbäck K, Danckwardt-Lillieström N, Rask-Andersen H, Abdsaleh S, Wikström J. Non-echo planar diffusion-weighted MRI increases follow-up accuracy after one-step step canal wall-down obliteration surgery for cholesteatoma. Acta Otolaryngol. 2013;133(6):574–583. doi: 10.3109/00016489.2012.762118. [DOI] [PubMed] [Google Scholar]
- 27.Sharifian H, Taheri E, Borghei P. et al. Diagnostic accuracy of non-echo-planar diffusion-weighted MRI versus other MRI sequences in cholesteatoma. J Med Imaging Radiat Oncol. 2012;56(4):398–408. doi: 10.1111/j.1754-9485.2012.02377.x. [DOI] [PubMed] [Google Scholar]
- 28.Dremmen M H, Hofman P A, Hof J R, Stokroos R J, Postma A A. The diagnostic accuracy of non-echo-planar diffusion-weighted imaging in the detection of residual and/or recurrent cholesteatoma of the temporal bone. AJNR Am J Neuroradiol. 2012;33(3):439–444. doi: 10.3174/ajnr.A2824. [DOI] [PMC free article] [PubMed] [Google Scholar]
- 29.Jindal M, Riskalla A, Jiang D, Connor S, O'Connor A F. A systematic review of diffusion-weighted magnetic resonance imaging in the assessment of postoperative cholesteatoma. Otol Neurotol. 2011;32(8):1243–1249. doi: 10.1097/MAO.0b013e31822e938d. [DOI] [PubMed] [Google Scholar]
- 30.Yeom K W Lober R M Mobley B C et al. Diffusion-weighted MRI: distinction of skull base chordoma from chondrosarcoma AJNR Am J Neuroradiol 20133451056–1061., S1 [DOI] [PMC free article] [PubMed] [Google Scholar]
- 31.Fischbein N J, Kaplan M J. Magnetic resonance imaging of the central skull base. Top Magn Reson Imaging. 1999;10(5):325–346. doi: 10.1097/00002142-199910000-00005. [DOI] [PubMed] [Google Scholar]
- 32.Nitz W R, Bradley W G Jr, Watanabe A S. et al. Flow dynamics of cerebrospinal fluid: assessment with phase-contrast velocity MR imaging performed with retrospective cardiac gating. Radiology. 1992;183(2):395–405. doi: 10.1148/radiology.183.2.1561340. [DOI] [PubMed] [Google Scholar]
- 33.Yildiz H, Yazici Z, Hakyemez B, Erdogan C, Parlak M. Evaluation of CSF flow patterns of posterior fossa cystic malformations using CSF flow MR imaging. Neuroradiology. 2006;48(9):595–605. doi: 10.1007/s00234-006-0098-8. [DOI] [PubMed] [Google Scholar]
- 34.Battal B, Kocaoglu M, Bulakbasi N, Husmen G, Tuba Sanal H, Tayfun C. Cerebrospinal fluid flow imaging by using phase-contrast MR technique. Br J Radiol. 2011;84(1004):758–765. doi: 10.1259/bjr/66206791. [DOI] [PMC free article] [PubMed] [Google Scholar]
- 35.Mbonane S, Andronikou S. Interpretation and value of MR CSF flow studies for paediatric neurosurvery. S. Afr J Rad. 2013;17(1):26–29. [Google Scholar]
- 36.Knobloch V, Binter C, Kurtcuoglu V, Kozerke S. Arterial, venous, and cerebrospinal fluid flow: simultaneous assessment with Bayesian multipoint velocity-encoded MR imaging. Radiology. 2014;270(2):566–573. doi: 10.1148/radiol.13130840. [DOI] [PubMed] [Google Scholar]
- 37.Wang C S, Wang X, Fu C H, Wei L Q, Zhou D Q, Lin J K. Analysis of cerebrospinal fluid flow dynamics and morphology in Chiari I malformation with cine phase-contrast magnetic resonance imaging. Acta Neurochir (Wien) 2014;156(4):707–713. doi: 10.1007/s00701-013-1958-8. [DOI] [PubMed] [Google Scholar]
- 38.Yamada S, Miyazaki M, Kanazawa H. et al. Visualization of cerebrospinal fluid movement with spin labeling at MR imaging: preliminary results in normal and pathophysiologic conditions. Radiology. 2008;249(2):644–652. doi: 10.1148/radiol.2492071985. [DOI] [PubMed] [Google Scholar]
- 39.Baumann F, Schmid C, Bernays R L. Intraoperative magnetic resonance imaging-guided transsphenoidal surgery for giant pituitary adenomas. Neurosurg Rev. 2010;33(1):83–90. doi: 10.1007/s10143-009-0230-4. [DOI] [PubMed] [Google Scholar]
- 40.Choudhri O, Mindea S A, Feroze A, Soudry E, Chang S D, Nayak J V. Experience with intraoperative navigation and imaging during endoscopic transnasal spinal approaches to the foramen magnum and odontoid. Neurosurg Focus. 2014;36(3):E4. doi: 10.3171/2014.1.FOCUS13533. [DOI] [PubMed] [Google Scholar]
- 41.Copeland W R, Hoover J M, Morris J M, Driscoll C L, Link M J. Use of preoperative MRI to predict vestibular schwannoma intraoperative consistency and facial nerve outcome. J Neurol Surg B Skull Base. 2013;74(6):347–350. doi: 10.1055/s-0033-1347369. [DOI] [PMC free article] [PubMed] [Google Scholar]


