Abstract
We construct a microscopic hyperspectral imaging system to distinguish between normal and cancerous gastric cells. We study common transmission-spectra features that only emerge when the samples are dyed with hematoxylin and eosin (H&E) stain. Subsequently, we classify the obtained visible-range transmission spectra of the samples into three zones. Distinct features are observed in the spectral responses between the normal and cancerous cell nuclei in each zone, which depend on the pH level of the cell nucleus. Cancerous gastric cells are precisely identified according to these features. The average cancer-cell identification accuracy obtained with a backpropagation algorithm program trained with these features is 95%.
OCIS codes: (170.0170) Medical optics and biotechnology, (110.4234) Multispectral and hyperspectral imaging, (170.6935) Tissue characterization
1. Introduction
Hyperspectral imaging (HSI) is a multidisciplinary nondestructive testing technology that can be used to simultaneously obtain spatial and spectral information. HSI is extensively used in areas such as agriculture, astronomy, and biomedical imaging. In the biomedical imaging context, several researches have focused on locating or identifying cancerous tissues/cells with the application of HSI technology [1–6]. Cancerous tissues or cells can be identified via various spectral imaging techniques based on a tissue/cell’s fluorescence spectrum [7], Raman spectrum [8], infrared spectrum [9], and transmission spectrum [10]. For all these spectral techniques, characteristic peaks or formations of the spectrum are generally used as the main criterion for cancer-cell identification. However, samples from different patients often exhibit different spectral responses due to individual biological variations, and even in the same sample, the spectra of cancerous cells exhibit small differences. Thus, spectral imaging of such cells may not show any fixed characteristic peak or formation, which undermines the test results. It is difficult to establish a standard with wide suitability for the identification. Consequently, extracting certain features from the sample spectra forms the key to improve the accuracy of cancer-cell identification.
Previous studies have shown that there is an obvious contrast between the pH levels of normal and cancerous tissues. Warburg first hypothesized that the respiration of tumor cells is “damaged” in the sense that they preferentially metabolize via anaerobic pathways, producing large quantities of lactic acid [11]. With further advancements in cancer-cell detection and technology, it has now been established beyond doubt that at least certain tumors have a more acidic interstitial pH than that of normal tissues [12]. Moreover, because of chromatin proliferation, the pH levels of the cancerous cell nuclei are also different from those of normal cell nuclei. This significant pH difference can be used to identify cancerous cells [13]. However, it is very difficult to detect the pH level of cells directly. To overcome this problem, hematoxylin and eosin (H&E) stain is used to dye the samples. The effect of the H&E stain depends on the pH level of the “stained” biological structures, and therefore, structures with different pH values exhibit different colors. The slight change in the color resulting from the application of the H&E stain cannot be observed by the naked eye; however, it can be distinguished by studying the transmission spectrum of the sample in question. Because there is a fixed distinction between the pH levels of normal and cancerous cells, we can conclude there must also be a fixed distinction between the transmission spectra of normal and cancerous cells.
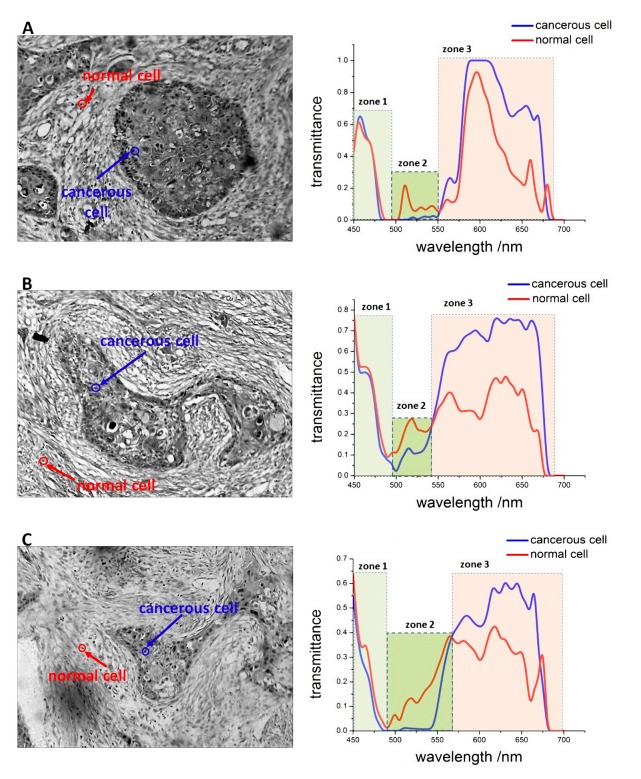
In this study, H&E-stained normal and cancerous gastric tissues from eight different patients were used as test samples, and the transmission spectra of normal and cancerous cell nuclei were obtained via hyperspectral imaging. By analyzing the obtained spectra, we observed that there are some certain common features that could be used to distinguish between the normal and cancerous cell nuclei. Based on our analysis, we classified the transmission spectra of these different samples in the visible region into three zones: in zone 1 (in the approximate wavelength range of 450-490 nm), the transmittance of the normal and cancerous nuclei were nearly identical; in zone 2 (~490-550 nm), the transmittance of the normal nuclei was higher than that of the cancerous nuclei; in zone 3 (~550-700 nm), the transmittance of cancerous nuclei was higher than that of normal nuclei. These distinctions are relative to the pH level of the cell nucleus. As a classical method for cancer-cell identification [14–16], we applied a backpropagation algorithm program to analyze the data. The statistical results indicated that the accuracy of cancer-cell identification with a program that is trained using these features is considerably higher than that trained using the entire spectra. Significantly, certain cancerous cells that spread to normal tissues that are normally indistinguishable by their morphological features are easily distinguished through the abovementioned spectral features.
2. Test system and method
The architecture of our experimental setup is shown in Fig. 1 . The setup consisted of hardware and software components.
Fig. 1.
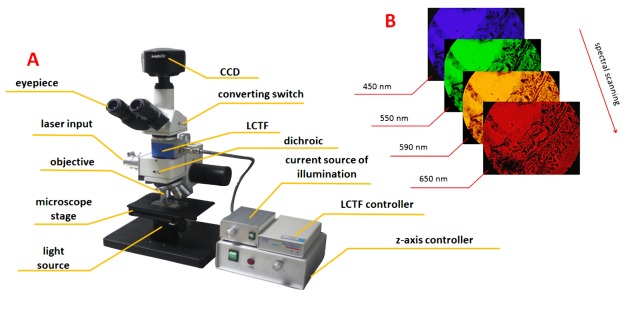
(A) Architecture of hyperspectral microscopic imaging system and (B) spectral scanning process.
The system hardware comprised a 2/3-inch CCD (SONY ICX285 ExView HAD) sensor with an image size of 1360 × 1024 pixels, zooming lenses with magnifications ranging from 1 × to 7 × , a liquid crystal tunable filter (LCTF, CRI INC.) covering the spectral range of 420-720 nm, an aperture for the laser input, a dichroic mirror to separate the laser and optical signals, a 10 × infinity-corrected imaging microscope objective (Olympus INC.) with a large numerical aperture (N.A. = 0.25), and a white LED light source. The details of the optical characteristic of white LED light source and dichroic are shown in Fig. 2 . The software of the system was used to control the gain factor, exposure time, sweep range, and step length. This system can obtain transmission spectrum information when the sample is illuminated by the white LED light source and obtain fluorescence spectrum information when the sample is excited by the laser. However, only the transmission spectrum was used for identifying the normal/cancerous cells in this experiment and no laser source is needed.
Fig. 2.
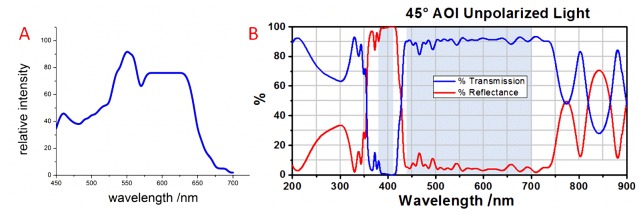
The emission spectrum of the white light LED (A) and the transmission and reflectance of the dichroic with un-polarized light (B).
As regards the principles underlying the imaging, when light from the LED light source is focused on the sample, a portion of this light is scattered or absorbed, while another portion enters the system. This light is filtered by the LCTF and imaged by the CCD. The result is a bright field image in the spectral range of 420-720 nm. The transmission rate is subsequently obtained by comparing the light intensities of the background and the sample.
The transmission rate can be calculated by the formula below:
| (1) |
Here, T denotes the transmittance, and Isample and Ibackgrouand denote the light intensities of the sample pixel and background pixel, respectively. Because the gray values are proportional to the light intensity, they can be used to replace the intensity values in the calculation of the transmittance. In this experiment, we chose a point in the blank area (without cells and other tissues) of each slide to test the intensity of the background at every wavelength by taking hyperspectral images.
3. Results and analysis
Figure 3 shows a microscopic image of the gastric tumor tissues. From the image, we note that the cancerous cells exhibit certain characteristic formations with various geometrical and morphological features, which are called tumor nests (TNs). Such cells exhibit a close structural consistency and functional coordination with the surrounding normal tissues [17]. In general, the nuclei of the cancerous cells in the tumor nests are larger than those of normal cells, and they can be easily identified. However, certain individual cancerous cells that spread to the surrounding tissues are similar to the normal cells. These cannot be easily distinguished by their morphological features. Thus, further details such as the spectral information are required for the identification of such cells.
Fig. 3.

Microscopic image of tumor nests in gastric tissues.
As previously mentioned, eight samples from different patients were used for the test. The spectral information of 50 normal cells and 50 cancerous cells were collected by the HSI system. In this experiment, the cells with large nucleus in tumor nest were determined as cancerous cells. The cells in the normal tissue, far away from the tumor nest, with relatively small nucleus were determined as normal cells. To be more precise in the analysis, the cells whose spectral characteristics are quite different from other cells of the same type in the same sample would be removed from the selection. The gain factor, the excitation power of the light source and the exposure time of CCD were kept constant during these measurements, and the spectral resolution that was used for acquiring data was 5 nm. One set of the transmission spectra of the normal and cancerous cell nuclei is shown in Fig. 4 . Because of individual biological variations in the patient samples, the transmission spectra obtained from different samples are not exactly identical. Thus, it is difficult to determine certain common formations or characteristic peaks in terms of a broad clinical-application range using these data. In fact, even in the same sample, the transmission spectra of normal and cancerous cell nuclei exhibit small differences. This discrepancy is an inherent property of biological organisms, which cannot be avoided.
Fig. 4.
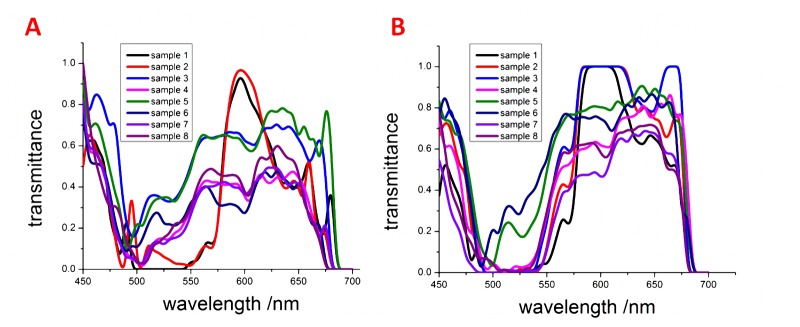
Transmission spectra of (A) normal cells and (B) cancerous cells in gastric tissues from eight different samples.
In this study, we used the summation of the Euclidean distance between two spectra to describe the spectral differences between samples. This distance is expressed below:
| (2) |
Here, T1k and T2k denote the transmittances of any two given cells at each wavelength, and n denotes the total number of wavelengths. We used this formula to calculate the parameters dcc (average spectral differentiation between two cancerous cells), dnn (average spectral differentiation between two normal cells), and dnc (average spectral differentiation between normal and cancerous cells) for each sample. Table 1 lists the values of these parameters for the eight samples.
Table 1. Differentiation in spectral differentiation parameters calculated from the entire spectrum between cells in each of eight samples.
| No.1 | No.2 | No.3 | No.4 | No.5 | No.6 | No.7 | No.8 | |
|---|---|---|---|---|---|---|---|---|
| dcc | 2.91 | 2.54 | 2.95 | 2.96 | 2.15 | 2.97 | 2.85 | 2.48 |
| dnn | 3.02 | 2.03 | 2.84 | 2.93 | 2.67 | 2.75 | 2.74 | 2.39 |
| dnc | 7.23 | 6.95 | 6.69 | 6.31 | 6.83 | 6.03 | 6.43 | 6.38 |
The results indicate that there are certain significant differences between the transmission spectra of normal and cancerous cell nuclei (dnn and dcc < dnc) in every sample. These differences arise due to the difference in pH levels between the normal and cancerous cell nuclei.
As mentioned previously, we used H&E to stain the samples. Hemalum in the H&E stain colors the basophilic structure (nuclei of cells) blue, and eosin Y colors eosinophilic structures in various shades of red, pink, and orange. The effect of the stain depends on the pH level of the sample. The pH levels of the nuclei of normal and cancerous cells are different, and therefore, their color/transmission spectra are different. As a characteristic of cancerous cells, a change in the pH level also appears in the cancerous cells that spread to the normal tissues. If we can find out some common features from these distinctions, we can use it to identify the cancerous cells.
Based on the results of our comparative analysis, we classified the transmission spectra of samples in the visible region into three zones, shown as Fig. 5 : in zone 1, the transmittance of normal and cancerous cells nuclei were observed to be nearly identical (average difference of transmittance <0.07); in zone 2, the transmittance of the normal cell nuclei was higher than that of the cancerous cell nuclei (average difference of transmittance >0.08); in zone 3, the transmittance of the cancerous cell nuclei was higher than that of normal cell nuclei (average difference of transmittance >0.1). We remark here that although the zone sizes are not exactly identical, the changes in the spectral trends are consistent for all similar zones. In fact, the tumor also exhibits similar spectral features in macroscopic environments. For example, Guolan Lu et al. used the HSI system for the in vivo detection of cancer in the head and neck, and in their study, similar distinctions between the spectra of normal and cancerous tissues were observed in the test results [18]. However, these features have not thus far been highlighted or analyzed.
Fig. 5.
Microscopic images of cancerous gastric tissues and transmission spectra of normal and cancerous cell nuclei from three different samples. The three different zones in the visible region are identified by different colors.
Moreover, these features were not observed in a comparison study between cells of the same type in the same sample, shown as Fig. 6 . This result indicates that the specificity of these features is relatively high and that they can be used as a common criterion to accurately identify cancerous cells.
Fig. 6.

Comparison between two cells of the same type in the same sample. (A) Transmission spectra of two normal cell nuclei and (B) transmission spectra of two cancerous cell nuclei.
For analyzing these features, a standard is required to define the “start” and “end” wavelengths (or the range) of each zone. In this experiment, the start wavelength of zone 1 and end wavelength of zone 3 were set to be 450 nm and 700 nm, respectively. The start wavelength of zone 2 (end wavelength of zone 1) and start wavelength of zone 3 (end wavelength of zone 2) were chosen as the minimum wavelengths that satisfied the following conditions, which is set up based on the extensive testing:
-
(1)Start wavelength of zone 2 :
-
(2)Start wavelength of zone 3 :
Here, and denote the transmittances of normal and cancerous cell nuclei, respectively, and S denotes the step length of the spectral scanning. Here, we remark that if the distinctions of the spectra between an unknown cell and a verified normal/cancerous cell cannot be divided into these three zones, the unknown cell should be identified as a normal/cancerous cell and vice versa.
Moreover, if the distinctions of the spectra between two cells can be divided into three zones, the features of the distinctions can be described by the zone size (L) and average difference in transmittance (ADT) between the normal and cancerous cell nuclei in each zone as:
| (3) |
| (4) |
Here, and denote the start and end wavelengths, respectively, of a zone, and and denote the transmittances of two given cells.
We utilized a MATLAB program based on the backpropagation algorithm to analyze the relationship between the transmission spectra (input) and types of cells (output). Here, it is to be noted that we can use either the entire spectra to train the program or the common features (zone number, zone side, and ADT) of the distinctions of the spectra to train the program.
For this experiment, we used fifty groups of data and another ten groups of data from each sample as the training data and test data, respectively. When the program was trained using the entire spectra, the type of test cell was identified by its entire transmission spectra. When the program was trained using the common features, the type of test cell was identified by the zone number, zone size, and ADT between the test cell and a verified cancerous cell. Both these methods were implemented, and the accuracy of identification in each case was calculated.
The accuracy of identification is defined as below:
| (5) |
This accuracy is defined as the ratio of the number of correctly labeled normal or cancerous cells (Nture) to the total number of normal or cancerous cells in the test group (Ntotal). From the entries in Table 2 , we note that the accuracy of the method based on the common features is higher due to the lower dimensionality of the problem [19].
Table 2. Accuracy of identification cancerous and normal cells in different samples.
| Sample No. | Accuracy (program trained using the entire spectra) | Accuracy (program trained using the common features) | ||
|---|---|---|---|---|
|
| ||||
| Cancerous cells | Normal cells | Cancerous cells | Normal cells | |
| 1 | 53% | 62% | 97% | 93% |
| 2 | 46% | 60% | 98% | 90% |
| 3 | 47% | 59% | 95% | 96% |
| 4 | 69% | 56% | 92% | 92% |
| 5 | 65% | 62% | 92% | 95% |
| 6 | 54% | 60% | 93% | 92% |
| 7 | 73% | 58% | 97% | 91% |
| 8 | 46% | 59% | 93% | 94% |
| Average value | 61% | 59% | 95% | 93% |
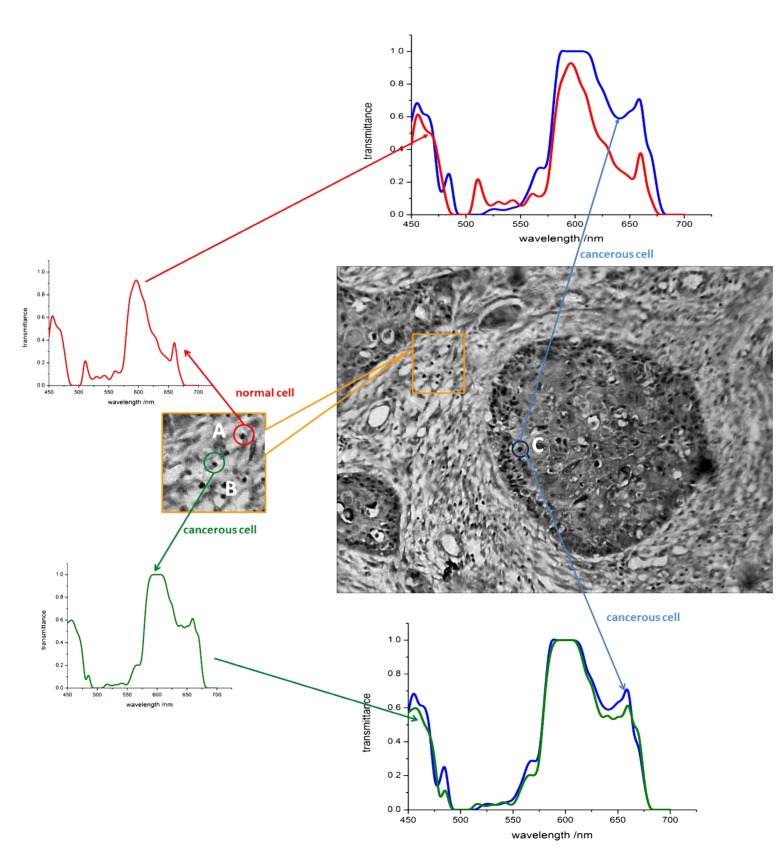
Because the common-feature-based method has high accuracy and wider applicability, we used the method to locate cancerous cells that spread to normal tissues. Although the normal cells and cancerous cells that spread to normal tissues have a similar morphology, the cancerous cells still can be distinguished by distinctions in their spectral responses, as shown in Fig. 7 .
Fig. 7.
Identification of cancerous cells that spread to normal tissues. The label A indicates a normal cell, B a cancerous cell that spreads to the normal tissues, and C a cancerous cell in the tumor nest. While cells A and B have similar morphological features, they exhibit different spectral responses.
4. Conclusion
The accurate identification of cancerous cells forms a very important aspect of biomedical image. Therefore, in this study, we determined certain features that were consistent over a wide range of variations in cells (even considering individual biological variations), and we used these features for the identification of cancerous gastric cells to avoid the detrimental effect of individual biological variations in samples. Our results demonstrate that our feature-based method can enable the accurate and quantitative detection of cancerous gastric cells. With the use of these features, the average accuracy of the identification of cancerous cells was 95%, and the highest accuracy was approximately 98%. Although the sizes or numbers of the classified spectral zones may not be exactly the same, we believe that our method that is based on classifying the spectral wavelength region into several zones and identifying cancerous cells by the distinctions in the transmittance features in each zone is applicable to the detection of various cancers.
Acknowledgments
This work was supported by the National Natural Science Foundation of China ( 61475067, 11404332), the Technology Innovation Foundation of Educational Commission of Guangdong Province ( 2013KJCX0022) and the Project of Science & Technology of Yuexiu District, Guangzhou, China ( 2013-GX-016).
References and links
- 1.Patskovsky S., Bergeron E., Rioux D., Simard M., Meunier M., “Hyperspectral reflected light microscopy of plasmonic Au/Ag alloy nanoparticles incubated as multiplex chromatic biomarkers with cancer cells,” Analyst (Lond.) 139(20), 5247–5253 (2014). 10.1039/C4AN01063A [DOI] [PubMed] [Google Scholar]
- 2.Yi W. S., Zhang J., Jiang H. M., Zhang N. Y., “Gastric cancer target detection using near-infrared hyperspectral imaging with chemometrics,” Proc. SPIE 9230, 92301V (2014). [Google Scholar]
- 3.Kiyotoki S., Nishikawa J., Okamoto T., Hamabe K., Saito M., Goto A., Fujita Y., Hamamoto Y., Takeuchi Y., Satori S., Sakaida I., “New method for detection of gastric cancer by hyperspectral imaging: a pilot study,” J. Biomed. Opt. 18(2), 026010 (2013). 10.1117/1.JBO.18.2.026010 [DOI] [PubMed] [Google Scholar]
- 4.Vasefi F., Kaminska B., Brackstone M., Carson J. J. L., “Hyperspectral angular domain imaging for ex-vivo breast tumor detection,” Imaging, Manipulation, and Analysis of Biomolecules, Cells, and Tissues Xi 8587 (2013). [Google Scholar]
- 5.Siddiqi A. M., Li H., Faruque F., Williams W., Lai K., Hughson M., Bigler S., Beach J., Johnson W., “Use of hyperspectral imaging to distinguish normal, precancerous, and cancerous cells,” Cancer 114(1), 13–21 (2008). 10.1002/cncr.23286 [DOI] [PubMed] [Google Scholar]
- 6.Lee J., Kozikowski R., Molnar N., Siemann D. W., Sorg B. S., “In vivo spectral and fluorescence imaging microscopy of tumor microvessel blood supply and oxygenation changes following vascular targeting agent treatment,” Dynamics and Fluctuations in Biomedical Photonics Ix 8222 (2012). [Google Scholar]
- 7.Koyama Y., Hama Y., Urano Y., Nguyen D. M., Choyke P. L., Kobayashi H., “Spectral fluorescence molecular imaging of lung metastases targeting HER2/neu,” Clin. Cancer Res. 13(10), 2936–2945 (2007). 10.1158/1078-0432.CCR-06-2240 [DOI] [PubMed] [Google Scholar]
- 8.Christian K., Johanna M., Werner A., Kathrin B., Tesfay G. M., Robert H., Abbas A., Stefan W., Andreas B., Wilhelm N. F., Florian S., “Raman difference spectroscopy: a non-invasive method for identification of oral squamous cell carcinoma,” Biomed. Opt. Express 5(9), 3252–3265 (2014). [DOI] [PMC free article] [PubMed] [Google Scholar]
- 9.Urboniene V., Pucetaite M., Jankevicius F., Zelvys A., Sablinskas V., Steiner G., “Identification of kidney tumor tissue by infrared spectroscopy of extracellular matrix,” J. Biomed. Opt. 19(8), 087005 (2014). 10.1117/1.JBO.19.8.087005 [DOI] [PubMed] [Google Scholar]
- 10.Maggioni M., Davis G. L., Warner F. J., Geshwind F. B., Coppi A. C., DeVerse R. A., Coifman R. R., “Hyperspectral microscopic analysis of normal, benign and carcinoma microarray tissue sections - art. no. 60910I,” Optical Biopsy VI 6091, I910 (2006). [Google Scholar]
- 11.Warburg O., “Improved method of measurement of respiration and glycolosis,” Biochem. Z. 152, 51–63 (1924). [Google Scholar]
- 12.Wike-Hooley J. L., Haveman J., Reinhold H. S., “The Relevance of Tumour pH to the Treatment of Malignant Disease,” Radiother. Oncol. 2(4), 343–366 (1984). 10.1016/S0167-8140(84)80077-8 [DOI] [PubMed] [Google Scholar]
- 13.Luo Z., Loja M. N., Farwell D. G., Luu Q. C., Donald P. J., Amott D., Truong A. Q., Gandour-Edwards R., Nitin N., “Widefield optical imaging of changes in uptake of glucose and tissue extracellular pH in head and neck cancer,” Cancer Prev. Res. (Phila.) 7(10), 1035–1044 (2014). 10.1158/1940-6207.CAPR-14-0097 [DOI] [PMC free article] [PubMed] [Google Scholar]
- 14.Karakis R., Tez M., Kilic Y. A., Kuru Y., Guler I., “A genetic algorithm model based on artificial neural network for prediction of the axillary lymph node status in breast cancer,” Eng. Appl. Artif. Intell. 26(3), 945–950 (2013). 10.1016/j.engappai.2012.10.013 [DOI] [Google Scholar]
- 15.Bayram B., Koca H. K., Narin B., Cavdaroglu G. C., Celik L., Acar U., Cubuk R., “An efficient algorithm for automatic tumor detection in contrast enhanced breast MRI by using artificial neural network (Neubrea),” Neural Netw. World 23(5), 483–498 (2013). 10.14311/NNW.2013.23.030 [DOI] [Google Scholar]
- 16.Lv D. J., Deng X., “Application of Artificial Neural Network in Simulating Subjective Evaluation of Tumor Segmentation,” Medical Imaging 2011: Image Perception, Observer Performance, and Technology Assessment 7966 (2011). [Google Scholar]
- 17.Wang L. W., Qu A. P., Yuan J. P., Chen C., Sun S. R., Hu M. B., Liu J., Li Y., “Computer-based image studies on tumor nests mathematical features of breast cancer and their clinical prognostic value,” PLoS ONE 8(12), e82314 (2013). 10.1371/journal.pone.0082314 [DOI] [PMC free article] [PubMed] [Google Scholar]
- 18.Lu G. L., Halig L. M., Wang D. S., Qin X. L., Chen Z. G., Fei B. W., “Spectral-spatial classification for noninvasive cancer detection using hyperspectral imaging,” J. Biomed. Opt. 19(10), 106004 (2014). 10.1117/1.JBO.19.10.106004 [DOI] [PMC free article] [PubMed] [Google Scholar]
- 19.Hastie T., Zhu M., “Dimension reduction and visualization in discriminant analysis - discussion,” Aust. Nz. J. Stat. 43, 179–185 (2001). [Google Scholar]


