Abstract
During glioblastoma surgery, delineation of the brain tumor margins is difficult because the infiltrated and normal tissues have the same visual appearance. We use a fiber-optical fluorescence probe for spectroscopic and time domain measurements to assist surgeon in differentiating the healthy and the infiltrated tissues. First study was performed on rats that were previously injected with tumorous cells. Measurements of endogenous tissue fluorescence were performed on fresh and fixed rat tumor brain slices. Spectral characteristics, fluorescence redox ratios and fluorescence lifetime measurements were analyzed. The study aimed at defining an optical index that can act as an indicator for discriminating healthy from tumorous tissue.
OCIS codes: (170.1610) Clinical applications; (170.6510) Spectroscopy, tissue diagnostics; (170.6920) Time-resolved imaging; (170.6935) Tissue characterization; (300.2530) Fluorescence, laser-induced; (300.0300) Spectroscopy
1. Introduction
The high-grade glioblastoma is a serious brain tumor in terms of malignancy and evolution. It is the most aggressive and frequent tumor that targets the brain. Nowadays, for many cases surgery intervention remains a valuable treatment for high-grade glioblastoma [1]. Nevertheless, a major limitation of this technique lies in the delineation of tumor sites [2,3], which affects the patient's prognostic. Nowadays, survival periods after operation are in the range of 12-18 months only, numerous patients experiencing a relapse [4–6]. The extension of the resection area increases the survival period from 2 to 8 months [7], which can reach 12 months in case of adjuvant radiation and chemotherapy [8] while risking the preservation of brain structure and function. This risk can be decreased by the optimal identification of the tumor border during the excision. This optimized differentiation of healthy and tumorous tissues is essential to efficiently remove tumor in the brain while preserving healthy functional regions.
Recently, fluorescence-guided tumor resection has demonstrated great potential for identifying tumor tissue intra-operatively as well as for maximizing resection in glioma. Although an important number of fluorophores have been studied using various imaging techniques [7], to date 5-ALA and sodium fluorescein have shown the most promising properties to detect residual tumor and increase the extent of the resection. Coupling exogenous fluorescence with techniques such as laser scanning confocal endomicroscopy has been showed to facilitate the detection of brain tumors in vivo in animal models and to some limits in humans [9]. Nevertheless, the use of nonspecific fluorescent agents such as sodium fluorescein that accumulate in the extracellular compartment may complicate the operation of resection [10].
A promising way to overcome this limit is the use of the natural fluorescence of brain tissues. In our approach we focus on endogenous fluorescence to identify the tumor-brain interface or residual tumor cells. Endogenous fluorescence for discrimination of tissues is of great interest for several research groups since 2000 and particularly the groups of Laura Marcu (UCDavis, Davis, United States) and Anita Mahadevan-Jansen (Vanderbilt University, Nashville, United States). The first one focuses its research on spectral and lifetime measurements of NADH and Pyridines using 337 nm excitation wavelengths. They found that both molecules show a high fluorescence lifetime in tumoral regions compared to healthy tissues [11–15] especially for low-grade glioma. The other group showed that the complementary usage of spectroscopy and diffuse reflectance measurements could be used for human tissue tumor discriminations [16–18]. Other groups, such as Anne Croce (Università de Pavia, Pavie, Italy) [19] or Yo Gun Chung (Korea University, Seoul, South Korea) [20] also performed studies in this field.
This paper is devoted to the development of a simple optical probe expected to improve the spatial delineation of glioblastoma. This probe is used to detect the fluorescence signals emitted from endogenous proteins of rat brain slides, extracted after injection of tumor cells in rat brain. The spectroscopic signal from freshly extracted brain slides is recorded at two excitation wavelengths: 375 nm to specifically excite the nicotinamide dinucleotide (NADH), and 405 nm to not only excite the NADH, but also the flavins (FAD), the lipopigments, the porphyrins and the chlorins. We present a series of criterion to try to distinguish normal from tumorous brain sites through spectral autofluorescence characteristics. The intrinsic fluorescence redox ratio, also referred as NADH/FAD ratio, derived from these two primary endogenous fluorophores, is presented as a potential indicator of the metabolic activities of pathological areas. We calculated this ratio for a set of rat brain slices, and compared the results between healthy and tumorous areas. Then, using the same rat brain slices after fixation, fluorescence lifetime of the several endogenous fluorophores is measured with the same probe and evaluated as a complementary indicator of the presence of tumour cells. The paper reports details of experiments and results derived from spectral and lifetime domain measurements, in the perspective to transfer these information for future clinical applications.
2. Material and methods
2.1 Cell cultures
RG2 cells were obtained from American Type Culture Collection. Cell lines were grown in Dulbecco’s modified Eagle’s medium (DMEM) supplemented with 10% fetal calf serum (FCS), 2 mM L-glutamine, 1 mM sodium pyruvate, 50 U/ml streptomycin (all obtained from Life Technologies Inc.), at 37 °C in a 5% CO2 humidified atmosphere, until they reached 90% confluency. The medium was removed and the cells were harvested using trypsin (0.04% trypsin / EDTA). The cells were centrifuged at 800 rpm for 5 min, suspended in PBS to final concentration of 3.103 RG2 cells/µL.
2.2 RG2 injection protocol
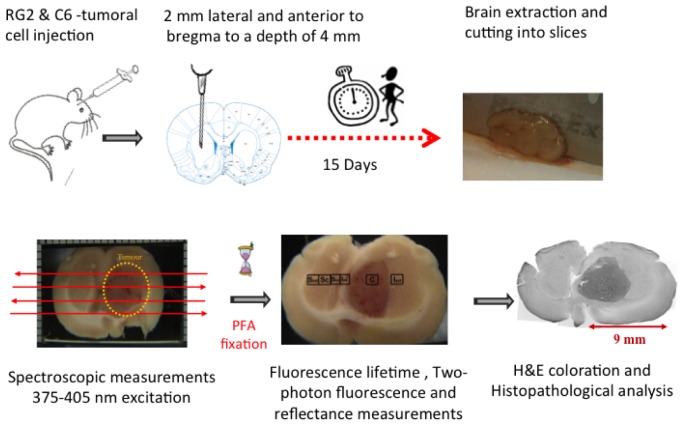
200 g Sprague Dawley male rats were used. Animals were anesthetized with Isoflurane (Abbott) and placed in a stereotactic frame during cell implantation. A mask for delivering the isoflurane allows to maintain the rat asleep during the entire operation. Cranium is shaved and a burr hole is obtained with a high-speed dental drill. A 10 µl-Hamilton syringe was used to deliver cells intracranial through the left hemisphere (2 mm lateral and anterior to bregma) to a depth of 4 mm as shown in Fig. 1 . The point of injection corresponds to the striatum. For RG2 cells, a volume of 5 µl was injected at a rate of 1 μl/min, observing 1 min interruption after each microliter of injection. There was a delay of 2 minutes before pulling out the needle. Finally, surgical clamps are used to close the incision. The RG2 cells are always injected only in one hemisphere. This allows a comparative study between healthy and tumorous side of the same rat. Two rats were injected with Phosphate buffered saline (PBS) and used as a control.
Fig. 1.
Protocol and procedure of implementation of tumorous cells in the rat’s brains, obtaining of the brain slices and measurements performed.
2.3 Brain extraction and slice cutting
On day 15 following the implantation of tumor cells, the animals were first anaesthetized by ethyl Carbamate at 10% in 0.2% heparin solution (1ml / 100g) and then scarified by decapitation.
Brain extraction and cutting into slices were performed within 5 – 10 minutes after sacrifice (Fig. 1). Slices of around 2mm thickness were obtained and maintained in 1X-PBS buffer, supplemented with 1% glucose and Carbogen (95% O2-5% CO2) by purging it into the medium. Tubes containing the slices of brain are placed on ice and maintained until measurements were performed. They usually started 10 minutes after sacrifice.
All animals’ experiments were carried out according to the CEE directives for animal experimentation (decree 2001-131; JO 06/02/01)
2.4 Slice holder131; JO 06/02/01).th, wdied fluorophoreence sous c'ole. ' l' dure 3 semaines voir 4. r un adulte expérience de l'
A specific mechanical support was built to insure that the brain slices are immobile and immerged in the previously described medium (see 2.3) during measurements (Fig. 1). The brain slices rests on a quartz slide integrated into the tight bottom of the support. This system allowed us to maintain the tissues alive as long as possible and to avoid dehydration. The superior part consisted of a slide of quartz (Starna, Germany) of 1 mm thickness that was fixed on the slice and allowed to be adjusted according to the thickness of the slice. It also contained a black frame (20x12 mm) used to make the recalibration of the measurements. The optical probe is placed at a fixed distance of 0.5 mm of the quartz slide that provided the highest collection efficiency. The overall distance between probe and tissue was maintained at 1.5 mm.
The mechanical support is mounted on a motorized micro translator stage (Thorlabs) for XY scanning. The X-dimension scanning velocity is 250 µm/s and the acquisition time during X-line scanning is 1 sec per fluorescence spectrum. Spectral acquisition was accomplished for several longitudinal lines of each brain slice. In this way, spectral information covers tumor and healthy sites of each slice.
2.5 Experimental set-up
2.5.1. Spectroscopic measurements
Further details about spectroscopic set up have already been published [21,22]. The main system components include an excitation source, a two-fiber optic probe (silica/silica step index fibers of inherent spatial resolution of 0.5 mm), a cooled spectrometer, and a computer workstation.
Pulsed diode lasers from Picoquant were used as laser sources. One emits at 405 nm (LDHP-C-405B, Picoquant) and the other emits at 375 nm (LDHP-C-375B, Picoquant). The diodes are driven by (PDL-808 “Sepia”, PicoQuant GmbH, Berlin, Germany). The power and the repetition frequency can be adjusted. Repetition frequency used for this study is 40 MHz.
Excitation is performed via a first fiber and fluorescence is collected via a second fiber. Further details about these two-fiber probes have already been published [23–26]. A long pass filter (SR 420, Semrock) is used to filter fluorescent signal from laser excitation. The collected fluorescence is directed toward a computer controlled cooled spectrometer (QE 6500, Ocean Optics) of 1.5 nm spectral resolution over a 365-750 nm spectral range.
2.5.2. Time-resolved measurements
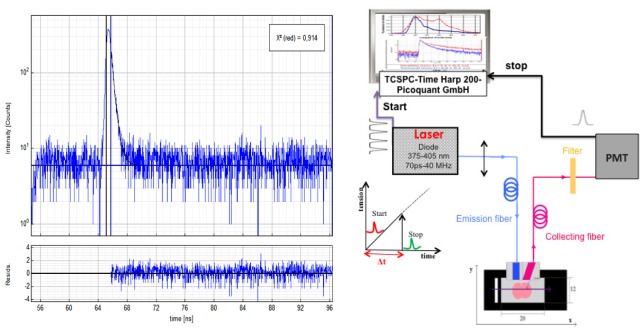
a scheme of the experimental set up is shown in Fig. 2 . The same excitation sources (diode 375, FWHM 45ps and 405 nm, FWHM 60 ps) were used. The same “Sepia” driver controlled the diodes. Repetition frequency can be set between 2.5 and 40 MHz. The collected fluorescence is directed to a Photomultiplier Tube (PMT) (PMA-182 N M, from PicoQuant GmbH). Depending on the band pass filter placed in front of the PMT, specific endogenous fluorophores signals were detected. The time resolution of the PMT is 220 ps. The synchronization output signal from the diode driver and the start signal from the PMT are connected to their respective channels on the data acquisition board Time-Correlated Single Photon Counting (TCSPC) (TimeHarp 200 from PicoQuant GmbH). Lifetime measurements were acquired on the same set up than spectroscopic measurements and this analysis took between 5 and 10 minutes to be performed for each ROI. So for this pilot study, we decided to fixed slices before lifetime measurements.
Fig. 2.
lifetime measurement setup and Instrument response function.
2.6 Staining protocol
After spectroscopic measurements, all slices were fixed in a solution of 4% formaldehyde to undergo a histological analysis afterward. We used Hematoxylin and Eosin (H&E) to stain respectively nucleus and cytoplasm components of tissues. The histology, H&E coloration, was made in the service of anatomopathology at the Sainte-Anne hospital (Paris) or in the laboratory. Fixed slices were cryo-protected by incubation in successive solutions of 10, 15 and 20% sucrose in PBS, before being frozen at −80°C. Coronal free-floating sections of 20 μm thick were cut on a cryostat and stored at 4°C in PBS containing 0.4% sodium azide for H&E staining. Sections were mounted on a glass slide and routine H&E protocol was performed. Then, the sections were dehydrated in ethanol, cleared in xylene and mounted between a glass slide and coverslip in Eukitt Mounting Medium, before being imaged with an optical microscope (Nikon, Eclipse 80i). The images were viewed and reconstructed with Adobe Photoshop software (Adobe Systems, San Jose, CA).
2.7 Statistical analysis
Different statistical tests were used depending on the specimen size. The tested null hypothesis stated that the means of two considered populations are equal.
Different statistical non-parametric tests (Wilcoxon) were performed for each rat by analyzing ROI data of different lines and tissue types. The number of acquisitions varied from 6 to 11. The presented tests compare specific tissue types, represented by corresponding ROI, e.g. healthy and tumorous sites. By comparing all possible combinations of ROIs in different acquisition lines, we can perform at least 15 tests for each rat.
The nonparametric Mann-Whitney test was used to make a comparison between different rats. In this case, an equal number of acquisitions are taken into account for each considered site.
3. Results
3.1. Fluorescence spectroscopy
(a) Spectral acquisition
Due to the fact that collected endogenous fluorescence depends on the excitation wavelength, i.e. 375 or 405 nm, for each excitation wavelength corresponds a specific treatment. For 375 nm, as seen in Fig. 3 . A, a unique peak is observed; its maximum is visible around 460 nm. In this case, we consider that the NADH is the principal detected fluorophore and we neglect other possible contributions. Figure 3. B illustrates the contribution of different endogenous fluorophores using a 405 nm excitation. Thus, this wavelength presents the advantage to provide several potential indicators. A small peak is observed around 410 nm and corresponds to a part of backscattered excitation. The wide peak, which extends from 470 to 500 nm, is a contribution of the emission of NADH and FAD. Towards 580 nm, we can observe a peak that we attribute to the fluorescence of lipopigments [27–29]. The last two peaks, maximum of which are in 620 and 680 nm, are owed to porphyrins and chlorins.
Fig. 3.
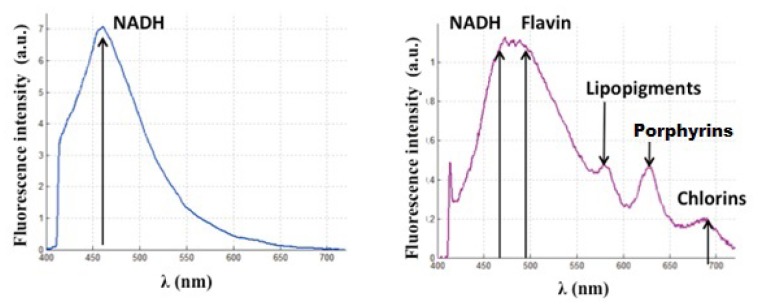
Endogenous fluorescence with (A) 375 nm and (B) 405 nm excitation wavelength.
(b) Spectroscopic data analysis
The spectral measurements were processed using a homemade Matlab program (Matlab, The MathWorks, Inc.). These spectra represent the different endogenous fluorophore emissions. To determine the contribution of each (intensity, maximum wavelength emission and integral under the curve), we adjust data following Eq. (1) where Stotal(λ) is the measured spectrum, i the fluorophore, Si(λ) the emission spectrum of the fluorophore i and fi a multiplicative factor of this spectra. Five fluorophores are considered: NADH, flavins, lipopigments, porphyrins and chlorins. For an excitation wavelength of 405 nm, the spectrum of flavins (SFlav (λ)) is adjusted by an emission spectrum taken from literature [30], while for NADH (SNADH (λ)) we used the spectra obtained during our measurement under 375 nm excitation. A similar method was used by [21]. The other 3 peaks, (SLipo (λ)), (SP620 (λ)) and (SP680 (λ)), are fitted by Gaussians. Figure 4 illustrates this treatment when exciting with 405 nm
| (1) |
For excitation wavelength 375 nm, two theoretical contributions drawn from the literature for the NADH and flavins are taken into account. The contribution of flavins is very weak compared to that of the NADH, remaining always lower than 5%. So, for an excitation wavelength of 375 nm, we consider that fluorescence from NADH only is detected and no analytical adjustment is applied in this case.
Fig. 4.
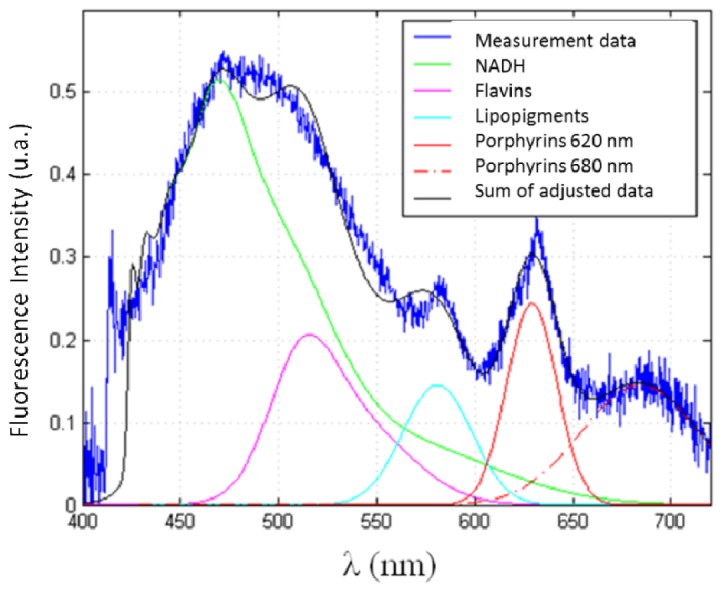
Data acquisition at 405 nm and adjustments realized by our program to extract the contribution of each fluorophore.
(c) Lifetime acquisition
Fixed brain slices, previously submitted to spectral analysis, were analyzed through fluorescence lifetime measurements. Different acquisitions (n > 15) were taken on healthy and tumor sites. A band pass filter was placed in front of the PMT, depending on the fluorophore, allowing selecting the spectral emission band of the studied endogenous fluorophore. With excitation wavelength 405 nm, we used a 580 ± 10 nm and a 620 ± 10 nm filters to study porphyrin and chlorin lifetime. To measure the flavins fluorescence lifetime we used a 520 ± 10 nm band pass filter. As it is more difficult to separate the NADH from the FAD contribution with only 1 filter, we evaluated the contribution of the NADH to the fluorescence spectrum with the excitation wavelength of 375 nm and without a band pass filter.
During measurements the probe was gently placed on the tissue. Then the PMT shutter was opened to acquire the fluorescence decay histograms through the TimeHarp acquisition board and its associated software. The duration of a single measurement was 3 seconds.
(d) Lifetime data analysis
Data were adjusted by a mono-exponential fit via FluoFit software (FluoFit, PicoQuant) to recover the lifetimes from the measured fluorescence decays. The criterion for an acceptable fit was a χ2-value of around 1.0 (χ2 max = 1.3) and the residuals were randomly distributed around 0 within the interval 4 and −4. The instrument response function (IRF) was measured by placing the probe on a Teflon block and on a mirror. The IRF of our system, represented in the Fig. 2(b), is around 240 ps (FWHM = 120 ps) and was measured with 1.1 µW excitation power at 405 nm.
(e) Choice of the region of analysis
For spectral acquisition, several regions of interest (ROI) are defined on each measured line. Minimum 4 lines were acquired on each slice and around two slices for each rat. One ROI corresponds to an average of three acquired spectrums in a consecutive way. For three acquisitions, the size of ROI is about 1 x 0.5 mm2. In general, the variation between spectra in each ROI should be lower than 15%. In other words, the contents of ROIs are homogeneous. ROIs are defined according to the histology of tissues: tumoral tissue, infiltrated tissue or healthy tissue. Table 1 and Fig. 5 presents the names, as well as a brief description of each region.
Table 1. Definition of each region tacked on each scanning line.
| ROI | Denomination | Definition |
|---|---|---|
| 1 | T | Central or necrosis tumor zone |
| 2 | Iext | Zone infiltrated in the banks of the tumor towards the outside of the brain |
| 3 | Iint | Zone infiltrated in the banks of the tumor towards the inside of the brain |
| 4 | H | Healthy zone in the part of the healthy hemisphere mirror of the zone 1 |
| 5 | Hext | Healthy zone in the outside part of the healthy hemisphere mirror of the zone 2 |
| 6 | Hint | Healthy zone in the outside part of the healthy hemisphere mirror of the zone 3 |
Fig. 5.
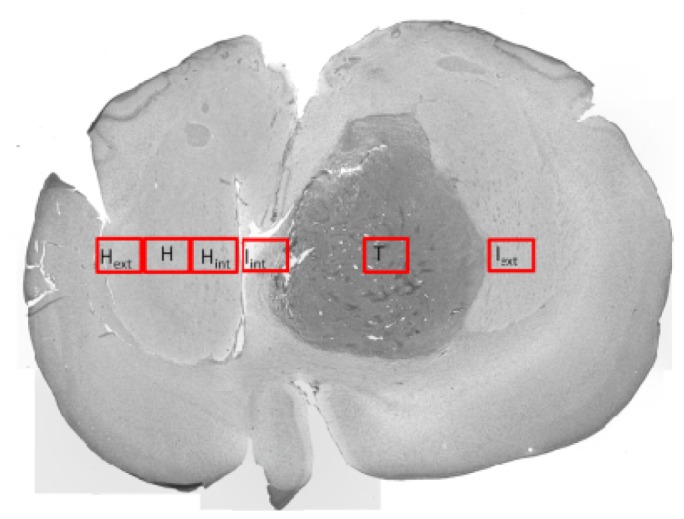
An illustrated image of the position of the ROI.
3.2. Spectroscopic analysis of endogenous fluorescence of brain slices injected with RG2 for each rat
For an excitation wavelength of 375 nm, a strong decrease of the intensity of fluorescence emitted by the NADH in the tumor site is detected as shown in the Fig. 6(a) . This figure represents the value of the area under the curve of NADH. The tumor is situated between both vertical bars. A horizontal line represents the line of measure. This observation matches with studies concerning the autofluorescence of gliomas on ex vivo human samples [19]. The same results for NADH are observed for different measured line of each rat. We can confirm that NADH intensity is always lower in the central region of the tumor compared to the three healthy regions (p < 0.05). The statistical tests comparing zones between them are similar for 80% for the excitation wavelengths of 375 and 405 nm (value threshold of p of 0.05, Wilcoxon signed-rank test).
Fig. 6.
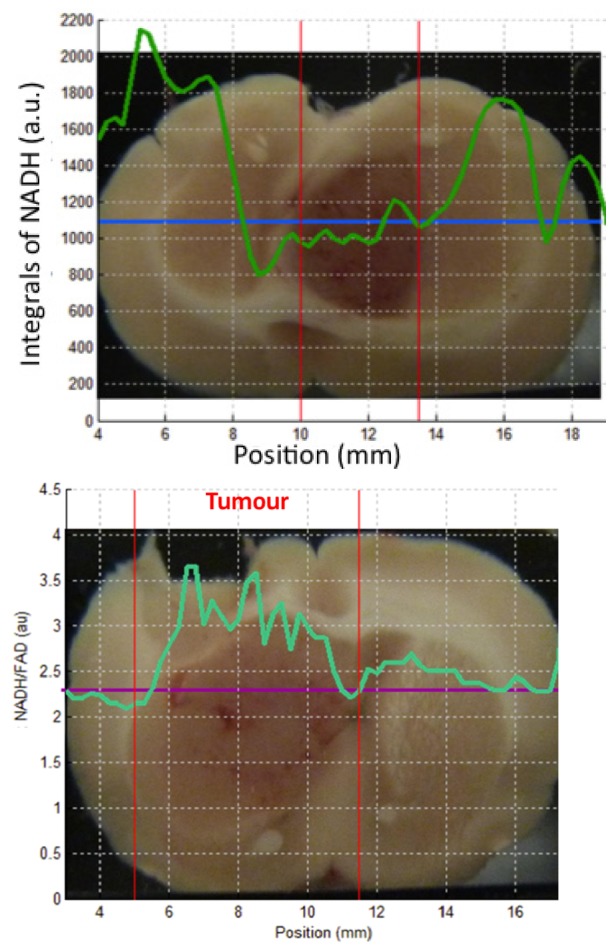
Left (a): area under the curve of NADH, right (b): NADH/FAD ratio variation for acquisition line from one rat brain slices.
It should be noted that the emitted fluorescence under excitation at 375 nm is higher than the one at 405 nm, which is correlated to the fact that the NADH absorbs more in the wavelengths lower than 400 nm, reaching a maximum around 340 nm.
For the excitation wavelength of 405 nm, the integral under the curve of fluorophores in the central tumor zone is always significantly lower (p < 0.05) than that of three zones of the healthy side, a result observed for all the fluorophores.
(a) Metabolic activity
The ratio between the fluorescence intensities from two endogenous fluorophores, the NADH and the FAD, reveals the reduction-oxidation (redox) ratio in tissue. This metabolic biomarker is sensitive to the cellular metabolic rate. This characteristic makes them potentially interesting for the study of tumor sites that present an important metabolic modification [22,31]. Figure 6(b) shows how the ratio of NADH and FAD fluorescence intensities varies for each position of a line of measurement. An increase of this yield is observed within the range of the tumorous site that was identified through histological analysis. This observation is confirmed for all studied rats. The increase in the yield of NADH/FAD-ratio is similar to the observations that have been obtained on ex vivo human samples [20].
3.3. Definition of a tumor signature
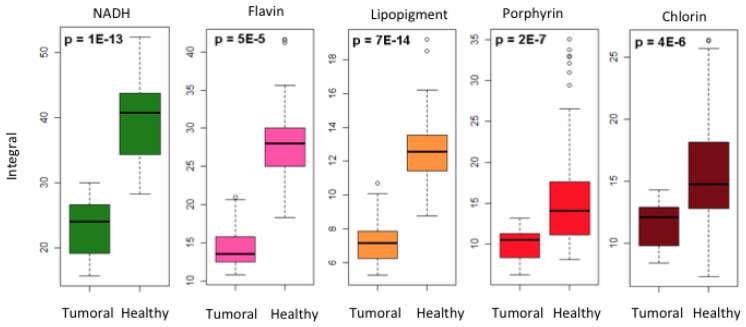
In this section, we focus on defining a particular signature of the central tumor zone of the RG2 with regard to the healthy tissue. The strong metabolic activity due to the mitosis phase of the tumor cells allowed us to try to define a specific signature of tumor tissue. Three healthy zones are treated in a common way and compared with the central part of the tumor for 8 rats. This process is repeated for the total set of adjusted curves obtained after acquisition and treatment by our Matlab program, for every fluorophore excited at 405 nm. The results are presented in Fig. 7 . Note that, at first, the healthy zones are distributed in zones of white matter and grey cells, by eliminating those who present a mixture of both types of tissue. A statistical analysis does not show significant difference (p > 0.05, test of Mann-Whitney) for the integral of fluorophores as the zone is in the white or grey matter, except for the lipopigments where p = 0.008. The data of healthy tissue, white or grey matter, are, thus, treated together.
Fig. 7.
Statistical difference between tumorous and healthy area for the integral of the different fluorophores excited with 405 nm.
(a) Integral of fluorophores
The difference of the integrals under the curve, between the healthy and tumorous zones, for every fluorophore is illustrated in Fig. 7 by a box chart representation. The number of acquisitions is 27 in the tumorous zone and 62 in the healthy zone. A p-value of less than 0.001 (test of Mann-Whitney) proves that the NADH, flavines, lipopigments, porphyrins and chlorins are potentially interesting endogenous fluorophores for the differentiation of infiltrated tumorous tissue from healthy tissue.
(b) Ratio of the integral under the curves of the different endogenous fluorophores between healthy and tumorous zones
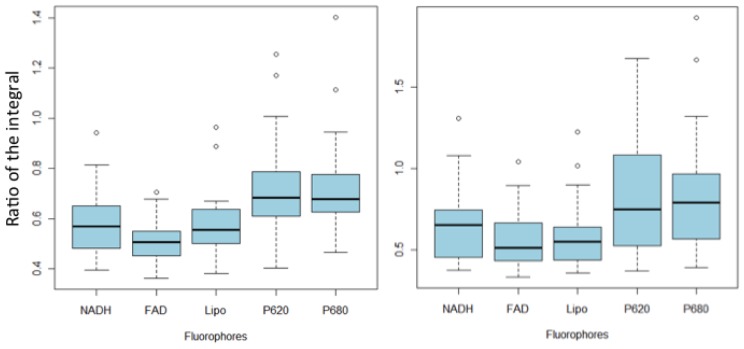
Another method of data analysis consists of putting in competition, for every rat, one or several ROIs tacked in the central part of the tumor and its mirror in the healthy tissue. We can find the distribution of this ratio for every fluorophore (Fig. 8 , n = 27 for each fluorophore). In a case where the tumorous tissue does not present significant difference with its healthy counterpart, the calculated ratio should be close to 1. This was observed for the control rat, where the same ratio was calculated between zones in mirror (1/4, 2/5 and 3/6, see Table 1) (n = 15 for each fluorophore). Table 2 presents the average and the standard deviation of the ratios for this rat.
Fig. 8.
Variations of the means of the integration of different fluorophores (NADH, Flavins (FAD), Lipopigments (Lipo), Porphyrins (P620) and Chlorins (P680), excited with 405 nm for healthy ROI and its symmetric tumorous ROI (a) and for healthy cortical ROI (b).
Table 2. Average and standard deviation calculated between mirror areas for each fluorophore (n = 15) for control rat.
| Fluorophore | Average of the ratio | Standard deviation |
|---|---|---|
| NADH | 0.95 | 0.08 |
| FAD | 0.97 | 0.07 |
| Lipopigment | 0.92 | 0.09 |
| Porphyrins | 0.88 | 0.16 |
| Chlorins | 0.86 | 0.15 |
For rats containing a transplant tumor, the ratio of the integral of tumorous/healthy are always strictly lower than 1: between 0.5 and 0.6 on average for the NADH, flavines and lipopigments, and around 0.7 for porphyrines and chlorins. These ratios were compared by a test of Mann-Whitney with ratio obtained for a healthy rat (control rat). For all the fluorophores, the healthy/tumorous ratio is significantly different from that obtained from a healthy rat (p < 0.001 for NADH, FAD and lipopigments and p <0.005 for porphyrines and chlorins). Thus it seems possible to detect the tumor by using reports between healthy and tumorous tissue on the same rat.
The necessity of comparing the signal with an acquisition taken in a healthy place was already evoked [32]. In the clinical case, the healthy hemisphere is not accessible, however, it would be possible to take a reference on a healthy tissue, for example, cortex. The cortex is situated in periphery of the brain and should generally be accessible during the operation. In this case, an acquisition on this zone could serve as healthy reference, even though it is not the same type of tissue. The Fig. 8 shows the report between the central tumorous zone and the cortical zone for every fluorophore (n = 27). These values were compared with Mann-Whitney test using the ratio obtained in the case of a healthy subject (control rat, n = 10). Reports for the NADH, FAD and lipopigments are statistically different from the healthy case (p < 0.001) and could potentially allow discrimination between healthy from tumorous tissue. This observation is not valid for porphyrines and chlorins (p > 0.05). See Fig. 9 .
Fig. 9.
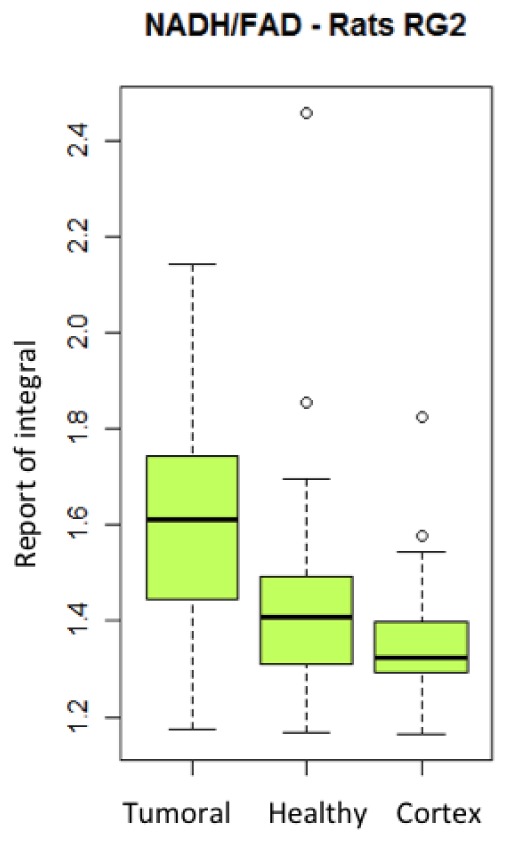
Variation of the report of the integral of NADH/ flavins of the tumoral, healthy and healthy cortex areas excited with 405 nm.
(c) Metabolic activity
The ratio between the NADH and the flavins is representative of the metabolic activity in the tissue. This ratio seems to be a promising indicator for tumor. Figure 8 shows this ratio for healthy tissues (n = 27) and tumor (n = 62). The value is higher in tumorous tissues than in healthy ones. The difference between the ratio obtained from healthy tissue and that obtained for the tumor tissue is significant (p <0,001), which highlights the importance of this indicator. Moreover, the ratio between tumor and healthy cortex is also significantly different (p < 0,001). Both healthy zones (in mirror of the tumor and in the cortex) are not significantly different (p > 0.05).
3.4. Lifetime results
Five rats are used for this study. Table 3 summarizes the average value of the lifetime of different endogenous fluorophores.
Table 3. Average fluorescence lifetime of healthy and tumoral tissus for three endogenous molecules. These values represent the (average ± standard deviation) of measurements accomplished on five rats. The healthy values also include measurements on the control rat.
| Fluorophore | Τ Healthy zone (ns) | Τ Tumoral zone (ns) | |
|---|---|---|---|
| NADH | 5.2 ± 0.2 (n = 14) | 5.1 ± 0.2 (n = 14) | |
| FAD | 4.1 ± 0.4 (n = 24) | 4.1 ± 0.6 (n = 24) | |
| Lipopigment | 3.8 ± 0.3 (n = 15) | 3.9 ± 0.4 (n = 15) | |
| Porphyrins | 6.5 ± 1.3 (n = 20) | 4.1 ± 0.4 (n = 20) | |
The averages are computed from five injected rats RG2, the healthy values also include lifetime measured on the control rat. No significant difference is observed between the healthy and tumoral zones for NADH, flavins and lipopigments (p > 0,05, test of Mann-Whitney).
These results despite still not providing possibility to discriminate normal and diseased tissue, could be considered as preliminary observations opening perspectives of future investigation on the effects of fixation, i.e. as a promising basis in retrospective analysis of stored samples.
Contrariwise, porphyrins presented a reproducible decrease of lifetime in the cancerous zones (p = 0,013) compared to the healthy ones. Figure 10 illustrates the difference in fluorescence lifetimes in tumor and healthy regions in one rat; the blue and red curves correspond to the tumor center and healthy tissue, respectively.
Fig. 10.
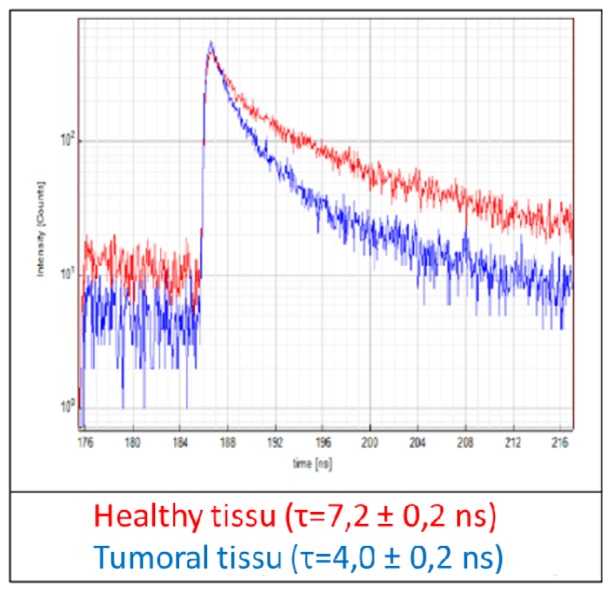
fluorescence lifetime measurements of porphyrins measured at 620 nm for healthy (red) and tumoral (blue) tissue.
The difference in lifetime decline indicates the potential interest of Porphyrins in the detection of tumour sites. Further measurements will be performed to confirm this trend. Furthermore, a validation of this result must be made on fresh tissue, followed by an in vivo study in the rat, before starting with human samples. The role of different aggregation states should be investigated [33]. Regarding the other molecules, the treatment could be improved by decreasing the filter bandwidth. Nevertheless, the presented results are encouraging and demonstrate the complementary information of spectral and time measurements. In the future, simultaneous collection of spectral and lifetime domains should be performed using the same setup.
4. Discussion and conclusion
Survival period and quality of life of glioblastoma patients depend strongly on the precision of the tumor resection. Assistance in defining the borders of this infiltrative tumor would be valuable to improve the outcome of the surgery. We presented an optical tool that is able to address this issue. The results demonstrate the potential of using endogenous fluorescence for tumor site identification for glioblastoma patients. This method does not require any injection of exogenous markers that would lead to potential complications for the patients (allergies, photo-sensibility). The use of rat models is a first step to define specific criterion to detect the tumour on the base of the fluorescence of endogenous proteins of brain tissues, before the first applications on human brain, the goal of this approach.
Multiple differences were observed between the fluorescence in the tumorous and healthy areas. First, a dramatic decrease of fluorescence intensities of NADH, FAD and lipopigments between the healthy and tumor zones was observed. Besides, the intensity ratio of metabolic molecules (NADH/FAD) seems particularly promising for this kind of discrimination. A statistically significant increase of this ratio was shown for tumor zones, which is in total agreement with a diminution of the metabolic activity of the ATP production in tumorous tissues [34] and confirmed that our protocol, fresh slices analyzed within ten minutes after sacrifice, is near to the in vivo conditions. In addition, preliminary measurements of fluorescence lifetime of porphyrins and chlorines showed a dependence on the histologic nature of the examined tissue. This could be used as a complementary contrast for spectroscopic measurements. This multimodal acquisition seems essential, particularly if we want to distinguish the infiltrated borders of the lesion [13]. Finally, the applicability of this simple experimental setup in the analysis of human brain tumor is conceivable. Indeed, the ratios between the fluorophores integral spectra are valuable parameters as soon as a healthy zone may be used as internal reference, which is the case of the cortex, often distant from the lesion, during surgery.
The use of PBS medium is to prevent dehydration of the tissues and avoid alteration of metabolic activity. However, in general, the tumour cells are preferentially engaged in the anaerobic energetic metabolism than in the aerobic one so the addition of glucose and Carbogen can influence the energetic metabolism in a different manner between healthy and tumour tissue. Fluorescence lifetime analysis had to be performed on fixed slices but fixation could alter amount and emission properties of all endogenous fluorophores. Measurements on living tissue and the effects of different media will be investigated in our next experiments.
We attributed the peak at 580 to the lipopigments. However, it was difficult to assess precisely which fluorophore was responsible to this peak: works incriminated phospholipids [35] or zinc porphryin [36]. The characterization of this fluorophore would be of great interest for clinical application of autofluorescence.
It is worth to note that some limits of this technique have to be anticipated when it would be transposed to a clinical trial. In a surgical use of the experimental setup, it will be the infiltrated zone that will have to be delineated. The lower differences between this area and a healthy one, due to the lack in tumorous cells in the infiltrated area, may need a more sensitive setup. The general decrease of the fluorescence intensity in the tumorous zone may be attributed to the high degree of vascularization of this area, and thus to the presence of hemoglobin. This will enhance the decrease of the fluorescence signals whichever fluorophore is concerned. If this discrepancy in the signal is too important, further developments will have to be conducted on the experimental setup. This could be done by a calibration of the setup by using optical phantoms [31] or by a modification of the setup to accept a nonlinear excitation in the NIR range (700 to 1000 nm), the therapeutic window. The intrinsic localization of the fluorescence source due to nonlinear light-matter interactions increases the fluorescence signal-to-noise ratio and therefore the analysis depth. A nonlinear excitation setup would also allow a good separation between fluorescence excitation and collection spectra. Glioblastoma remains a challenge for both clinicians and searchers. Its aggressiveness and its difficult treatment lead to poor median overall survival. However, gross tumor resection is the first line gold standard. This explorative study offers a new opportunity to help surgeons in this task with multimodal endogenous fluoroscopy recordings. Once validated, the use of this setup in a clinical way could be tested in the case of human brain glioblastoma.
Acknowledgments
This work is supported by a Plan Cancer with Physicancer pro- gram grant “MEVO,” a “Défi instrumental” program grant from CNRS, and the Institut National de Physique Nucléaire et de Physique des Particules ( IN2P3).
References and links
- 1.Behin A., Hoang-Xuan K., Carpentier A. F., Delattre J.-Y., “Primary brain tumours in adults,” Lancet 361(9354), 323–331 (2003). 10.1016/S0140-6736(03)12328-8 [DOI] [PubMed] [Google Scholar]
- 2.Fazekas J. T., “Treatment of grades I and II brain astrocytomas. The role of radiotherapy,” Int. J. Radiat. Oncol. Biol. Phys. 2(7-8), 661–666 (1977). 10.1016/0360-3016(77)90045-1 [DOI] [PubMed] [Google Scholar]
- 3.Leibel S. A., Sheline G. E., Wara W. M., Boldrey E. B., Nielsen S. L., “The role of radiation therapy in the treatment of astrocytomas,” Cancer 35(6), 1551–1557 (1975). [DOI] [PubMed] [Google Scholar]
- 4.Pang B.-C., Wan W.-H., Lee C.-K., Khu K. J., Ng W.-H., “The role of surgery in high-grade glioma--is surgical resection justified? A review of the current knowledge,” Ann. Acad. Med. Singapore 36(5), 358–363 (2007). [PubMed] [Google Scholar]
- 5.Hall W. A., “Extending survival in gliomas: surgical resection or immunotherapy?” Surg. Neurol. 61(2), 145–148 (2004). 10.1016/j.surneu.2003.07.005 [DOI] [PubMed] [Google Scholar]
- 6.Lacroix M., Abi-Said D., Fourney D. R., Gokaslan Z. L., Shi W., DeMonte F., Lang F. F., McCutcheon I. E., Hassenbusch S. J., Holland E., Hess K., Michael C., Miller D., Sawaya R., “A multivariate analysis of 416 patients with glioblastoma multiforme: prognosis, extent of resection, and survival,” J. Neurosurg. 95(2), 190–198 (2001). 10.3171/jns.2001.95.2.0190 [DOI] [PubMed] [Google Scholar]
- 7.D’Amico R. S., Kennedy B. C., Bruce J. N., “Neurosurgical oncology: advances in operative technologies and adjuncts,” J. Neurooncol. 119(3), 451–463 (2014). 10.1007/s11060-014-1493-3 [DOI] [PubMed] [Google Scholar]
- 8.Wen P. Y., Kesari S., “Malignant gliomas in adults,” N. Engl. J. Med. 359(5), 492–507 (2008). 10.1056/NEJMra0708126 [DOI] [PubMed] [Google Scholar]
- 9.Sanai N., Snyder L. A., Honea N. J., Coons S. W., Eschbacher J. M., Smith K. A., Spetzler R. F., “Intraoperative confocal microscopy in the visualization of 5-aminolevulinic acid fluorescence in low-grade gliomas,” J. Neurosurg. 115(4), 740–748 (2011). 10.3171/2011.6.JNS11252 [DOI] [PubMed] [Google Scholar]
- 10.Zehri A. H., Ramey W., Georges J. F., Mooney M. A., Martirosyan N. L., Preul M. C., Nakaji P., “Neurosurgical confocal endomicroscopy: A review of contrast agents, confocal systems, and future imaging modalities,” Surg. Neurol. Int. 5(1), 60 (2014). 10.4103/2152-7806.131638 [DOI] [PMC free article] [PubMed] [Google Scholar]
- 11.Sun Y., Hatami N., Yee M., Phipps J., Elson D. S., Gorin F., Schrot R. J., Marcu L., “Fluorescence lifetime imaging microscopy for brain tumor image-guided surgery,” J. Biomed. Opt. 15(5), 056022 (2010). 10.1117/1.3486612 [DOI] [PMC free article] [PubMed] [Google Scholar]
- 12.Papaioannou T., Preyer N. W., Fang Q., Brightwell A., Carnohan M., Cottone G., Ross R., Jones L. R., Marcu L., “Effects of fiber-optic probe design and probe-to-target distance on diffuse reflectance measurements of turbid media: an experimental and computational study at 337 nm,” Appl. Opt. 43(14), 2846–2860 (2004). 10.1364/AO.43.002846 [DOI] [PMC free article] [PubMed] [Google Scholar]
- 13.Marcu L., Thompson R. C., Garde S., Sedrak M., Black K. L., Yong W. H., “Time-resolved fluorescence spectroscopy of human brain tumors,” Proc. SPIE 4613, 183–187 (2002). [Google Scholar]
- 14.Butte P. V., Mamelak A. N., Nuno M., Bannykh S. I., Black K. L., Marcu L., “Fluorescence lifetime spectroscopy for guided therapy of brain tumors,” Neuroimage 54(Suppl 1), S125–S135 (2011). 10.1016/j.neuroimage.2010.11.001 [DOI] [PMC free article] [PubMed] [Google Scholar]
- 15.Butte P. V., Fang Q., Jo J. A., Yong W. H., Pikul B. K., Black K. L., Marcu L., “Intraoperative delineation of primary brain tumors using time-resolved fluorescence spectroscopy,” J. Biomed. Opt. 15(2), 027008 (2010). 10.1117/1.3374049 [DOI] [PMC free article] [PubMed] [Google Scholar]
- 16.Lin W. C., Toms S. A., Motamedi M., Jansen E. D., Mahadevan-Jansen A., “Brain tumor demarcation using optical spectroscopy; an in vitro study,” J. Biomed. Opt. 5(2), 214–220 (2000). 10.1117/1.429989 [DOI] [PubMed] [Google Scholar]
- 17.Lin W. C., Toms S. A., Johnson M., Jansen E. D., Mahadevan-Jansen A., “In vivo brain tumor demarcation using optical spectroscopy,” Photochem. Photobiol. 73(4), 396–402 (2001). [DOI] [PubMed] [Google Scholar]
- 18.Toms S. A., Lin W.-C., Weil R. J., Johnson M. D., Jansen E. D., Mahadevan-Jansen A., “Intraoperative optical spectroscopy identifies infiltrating glioma margins with high sensitivity,” Neurosurgery 61(1Suppl), 327–335 (2007). [DOI] [PubMed] [Google Scholar]
- 19.Croce A. C., Fiorani S., Locatelli D., Nano R., Ceroni M., Tancioni F., Giombelli E., Benericetti E., Bottiroli G., “Diagnostic potential of autofluorescence for an assisted intraoperative delineation of glioblastoma resection margins,” Photochem. Photobiol. 77(3), 309–318 (2003). [DOI] [PubMed] [Google Scholar]
- 20.Chung Y. G., Schwartz J. A., Gardner C. M., Sawaya R. E., Jacques S. L., “Diagnostic potential of laser-induced autofluorescence emission in brain tissue,” J. Korean Med. Sci. 12(2), 135–142 (1997). 10.3346/jkms.1997.12.2.135 [DOI] [PMC free article] [PubMed] [Google Scholar]
- 21.Wu Y., Qu J. Y., “Autofluorescence spectroscopy of epithelial tissues,” J. Biomed. Opt. 11(5), 054023 (2006). 10.1117/1.2362741 [DOI] [PubMed] [Google Scholar]
- 22.Skala M. C., Fontanella A., Lan L., Izatt J. A., Dewhirst M. W., “Longitudinal optical imaging of tumor metabolism and hemodynamics,” J. Biomed. Opt. 15(1), 011112 (2010). 10.1117/1.3285584 [DOI] [PMC free article] [PubMed] [Google Scholar]
- 23.Vu Thi M. H., Charon Y., Duval M. A., Lefebvre F., Menard L., Pitre S., Pinot L., Siebert R., “Intra-operative probe for brain cancer: feasibility study,” in (2007), Vol. 6628, p. 66281Q–66281Q–10. [Google Scholar]
- 24.Siebert R., Leh B., Charon Y., Collado-Hilly M., Duval M.-A., Menard L., Monnet F. P., Varlet P., “Development of an autofluorescent probe designed to help brain tumor removal: study on an animal model,” in (2010), Vol. 7548, p. 75483Y–75483Y–8. [Google Scholar]
- 25.Leh B., Siebert R., Hamzeh H., Menard L., Duval M.-A., Charon Y., Abi Haidar D., “Optical phantoms with variable properties and geometries for diffuse and fluorescence optical spectroscopy,” J. Biomed. Opt. 17(10), 108001 (2012). 10.1117/1.JBO.17.10.108001 [DOI] [PubMed] [Google Scholar]
- 26.Abi Haidar D., Leh B., Allaoua K., Genoux A., Siebert R., Steffenhagen M., Peyrot D., Sandeau N., Vever-Bizet C., Bourg-Heckly G., Chebbi I., Collado-Hilly M., “Spectral and lifetime domain measurements of rat brain tumours,” in (2012), Vol. 8207, p. 82074P. [Google Scholar]
- 27.Lakowicz J. R., Principles of Fluorescence Spectroscopy, 3rd ed. 2006. Corr. 5th printing 2010 (Springer-Verlag New York Inc., 2006). [Google Scholar]
- 28.Croce A. C., Ferrigno A., Vairetti M., Bertone R., Freitas I., Bottiroli G., “Autofluorescence properties of isolated rat hepatocytes under different metabolic conditions,” Photochem. Photobiol. Sci. 3(10), 920–926 (2004). 10.1039/b407358d [DOI] [PubMed] [Google Scholar]
- 29.Wagnières G. A., Star W. M., Wilson B. C., “In vivo fluorescence spectroscopy and imaging for oncological applications,” Photochem. Photobiol. 68(5), 603–632 (1998). 10.1111/j.1751-1097.1998.tb02521.x [DOI] [PubMed] [Google Scholar]
- 30.Barrio J. R., Tolman G. L., Leonard N. J., Spencer R. D., Weber G., “Flavin 1, N 6 -ethenoadenine dinucleotide: dynamic and static quenching of fluorescence,” Proc. Natl. Acad. Sci. U.S.A. 70(3), 941–943 (1973). 10.1073/pnas.70.3.941 [DOI] [PMC free article] [PubMed] [Google Scholar]
- 31.Liu Q., Grant G., Li J., Zhang Y., Hu F., Li S., Wilson C., Chen K., Bigner D., Vo-Dinh T., “Compact point-detection fluorescence spectroscopy system for quantifying intrinsic fluorescence redox ratio in brain cancer diagnostics,” J. Biomed. Opt. 16(3), 037004 (2011). 10.1117/1.3558840 [DOI] [PMC free article] [PubMed] [Google Scholar]
- 32.Pascu A., Romanitan M. O., Delgado J.-M., Danaila L., Pascu M. L., “Laser-Induced Autofluorescence Measurements on Brain Tissues,” Anat. Rec. (Hoboken) 292(12), 2013–2022 (2009). 10.1002/ar.21034 [DOI] [PubMed] [Google Scholar]
- 33.Ricchelli F., Gobbo S., Moreno G., Salet C., Brancaleon L., Mazzini A., “Photophysical properties of porphyrin planar aggregates in liposomes,” Eur. J. Biochem. 253(3), 760–765 (1998). 10.1046/j.1432-1327.1998.2530760.x [DOI] [PubMed] [Google Scholar]
- 34.Malthièry Y., Savagner F., “[Energy metabolism of the cancer cell: example of mitochondria-rich endocrine tumors],” Ann. Endocrinol. (Paris) 67(3), 205–213 (2006). 10.1016/S0003-4266(06)72588-4 [DOI] [PubMed] [Google Scholar]
- 35.Nazeer S. S., Saraswathy A., Gupta A. K., Jayasree R. S., “Fluorescence spectroscopy as a highly potential single-entity tool to identify chromophores and fluorophores: study on neoplastic human brain lesions,” J. Biomed. Opt. 18(6), 067002 (2013). 10.1117/1.JBO.18.6.067002 [DOI] [PubMed] [Google Scholar]
- 36.Bottiroli G., Docchio F., Ramponi R., Sacchi C. A., Supino R., “A 580 nm emission in haematoporphyrin-derivative solution and in treated cells,” Lasers Med. Sci. 1(1), 33–39 (1986). 10.1007/BF02030735 [DOI] [Google Scholar]


