Abstract
Signal generation in three-photon microscopy is proportional to the inverse-squared of the pulse width. Group velocity dispersion is anomalous for water as well as many glasses near the 1,700 nm excitation window, which makes dispersion compensation using glass prism pairs impractical. We show that the high normal dispersion of a silicon wafer can be conveniently used to compensate the dispersion of a 1,700 nm excitation three-photon microscope. We achieved over a factor of two reduction in pulse width at the sample, which corresponded to over a 4x increase in the generated three-photon signal. This signal increase was demonstrated during in vivo experiments near the surface of the mouse brain as well as 900 μm below the surface.
OCIS codes: (260.2030) Dispersion, (190.4180) Multiphoton processes, (170.0180) Microscopy
Introduction
Dispersion management is critical for multiphoton microscopy because ultrashort pulses can be strongly affected by material dispersion [1], which results in reduced signal generation. Dispersion management components are common in two-photon microscopy (2PM) systems [2,3], and 2PM systems have been shown to maintain a laser pulsewidth down to 10 fs [4]. However, glasses commonly used in a microscope generate normal material group velocity dispersion (GVD) at the typical excitation wavelengths for 2PM (600-1300 nm) and can thus be compensated by prism pairs [1–6], which are capable of generating significant anomalous GVD. For example, commercial devices such as the DeepSee (Newport) are capable of introducing −40,000 fs2 of (anomalous) GVD at 690 nm and −8,000 fs2 of GVD at 1,300 nm, which are generally sufficient for most microscopes at these wavelengths.
Three-photon microscopy (3PM) using 1,700 nm excitation wavelength was recently shown to produce images within in vivo brain tissue at unprecedented depths due to the higher order of nonlinearity and longer excitation wavelength than traditional 2PM [7]. The inverse-squared relationship between the generated signal and the duty cycle of the pulse train for 3PM, as opposed to the simple inverse relationship for 2PM [8,9], necessitates the use of short (<70 fs), energetic (~100 nJ) excitation pulses. However, the GVD is anomalous for many glasses commonly used in microscopes at this wavelength, and a net anomalous GVD makes the use of typical glass prism pairs impractical for dispersion compensation. In addition, the immersion liquid (e.g., H2O and D2O), and perhaps the brain tissue itself, can introduce anomalous dispersion and must also be considered.
Figure 1 shows the GVD of various optical materials as calculated from their Sellmeier equations [10–14]. The GVD curves of H2O and D2O only extend to 1.6 μm because the Sellmeier coefficients in reference [14] were shown to match experiments to this wavelength. H2O and D2O as well as common types of glasses such as fused silica and N-LAK22 exhibit anomalous dispersion near 1,700 nm. However, the strong normal dispersion of silicon (Si) means that anomalous dispersion can be compensated by merely inserting a Si wafer into the beam path. Furthermore, the beam shouldn’t suffer any transmission loss through the wafer if the wafer is undoped and uncoated as well as positioned at the Brewster angle, which is approximately at a 74 degree angle of incidence, and the incident light is p-polarized.
Fig. 1.
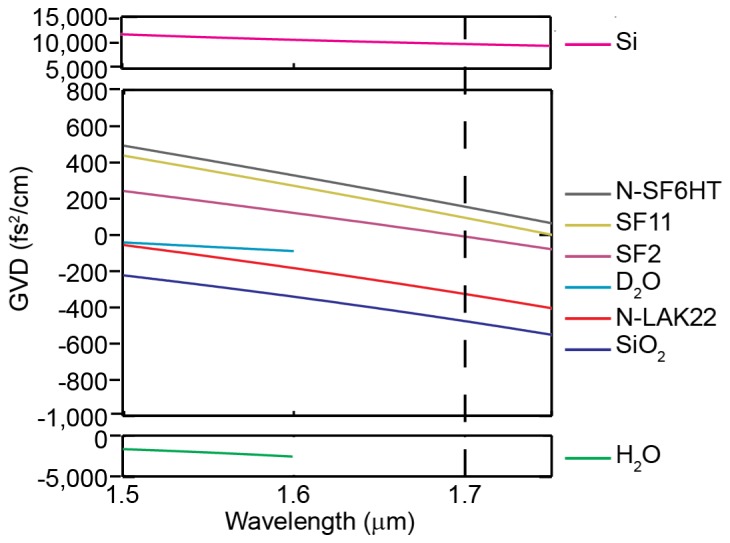
Material GVD vs. wavelength near 1,700 nm for common optical materials. The vertical line at 1.7 μm denotes our excitation wavelength. Note the different scales used for Si and H2O.
Second order autocorrelations were performed to measure how the laser pulse broadens after traveling through combinations of water (H2O), heavy water (D2O), Si, and the microscope. Figure 2 shows the experimental setup. The laser and PC rod combination produces a pulse of light centered at 1,700 nm with a 53 fs full-width at half maximum (FWHM). This initial pulse was measured by a second-order interferometric autocorrelator. After the interferometer, the light can pass through a variety of dispersive elements (1 mm cuvette filled with H2O, 1 cm cuvette filled with D2O, Si wafers of various thicknesses, and the microscope optics). Each sidewall of the cuvette is made of 1.25-mm thick fused silica, so each cuvette introduces approximately −100 fs2 group delay dispersion (GDD). To achieve a 2 mm path length through H2O, the incident light is double-passed through the 1-mm cuvette. A Si detector (SM05PD1A, Thorlabs) at the “Sample” position serves as the nonlinear element and produces a 2-photon induced current that is converted to voltage by a transimpedance amplifier (SR570, Stanford Research Systems) and then recorded by a computer.
Fig. 2.
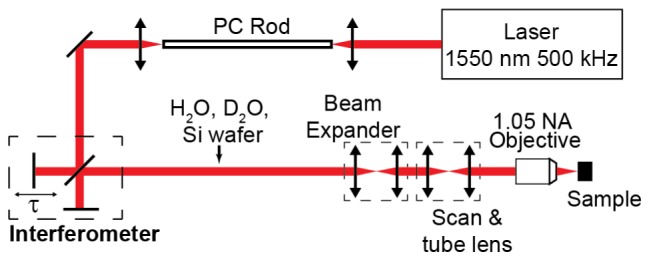
Experimental setup. The PC Rod shifts the wavelength of the laser from 1.55 um to 1.7 μm through soliton self-frequency shift [7]. Dispersive elements (H2O, D2O, microscope optics, and Si wafers) were independently added to the beam path.
Figure 3 shows the pulse spectrum and 2nd-order interferometric autocorrelations of our experiment. The numbers in the upper-right corner of Fig. 3(b)-3(h) are the intensity FWHM of each pulse (after deconvolution by assuming a sech2 pulse shape). The dispersion introduced by 2 mm H2O (Fig. 3(b)), which is the working distance of our objective, is nearly identical to that of 1 cm D2O (Fig. 3(c)). We use D2O as our 3PM immersion fluid because it has a similar linear index of refraction as H2O but significantly lower absorption [14]. The small GVD that we observed from D2O, which is corroborated by the calculated dispersion shown in Fig. 1, allows us to neglect its impact for 3PM since less than 2-mm thick D2O is present in any imaging conditions. The thickness of the brain tissue in our experiments may also introduce extra dispersion. Since water content of brain tissue is approximately 80% [15], we performed our experiments with 1- and 2-mm H2O together with our microscope. We found a 3-mm Si wafer is near the ideal thickness for our system (Figs. 3(f) and 3(h)). It is shown that the pulsewidth is compressed by over a factor of 2 after the 3-mm Si wafer, which should result in over a fourfold increase in the 3-photon excited signal.
Fig. 3.
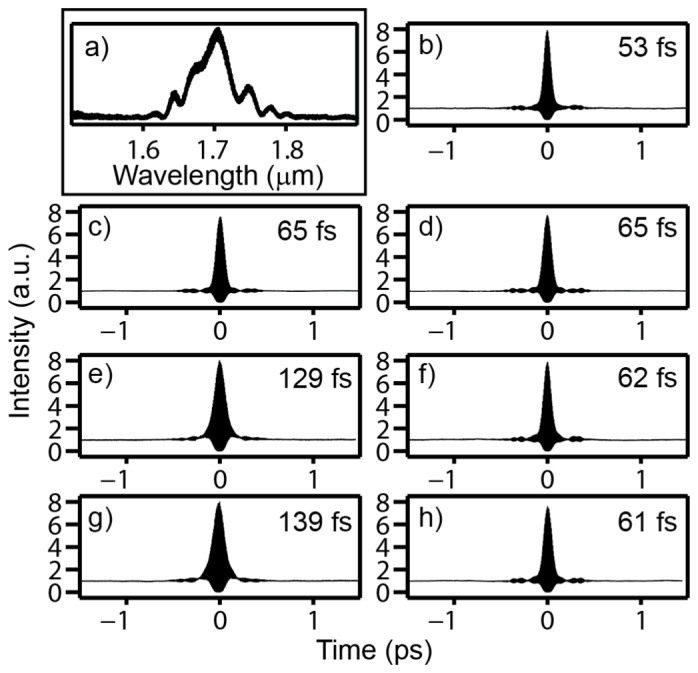
Spectrum of pulse and second-order interferometric autocorrelations after various optical elements. (a) Pulse spectrum after the PC rod. (b)-(h) Second-order interferometric autocorrelations: (b) immediately after the collimating lens following the PC rod, (c) after 2 mm H2O, (d) after 1 cm D2O, (e) after microscope and 1 mm H2O, (f) after microscope, 1 mm H2O, and 3 mm Si, (g) after microscope and 2 mm H2O, (h) after microscope, 2 mm H2O, and 3 mm Si. The intensity FWHM of the pulse, assuming a sech2 pulse, is also displayed in each panel.
We performed in vivo imaging to show how the introduction of the Si wafer will increase the 3-photon excited signal for the same input beam. The microscope setup was similar to that shown in Horton et al. [7], with the exception of a PC rod with a larger core area that produces a soliton with roughly twice the pulse energy of the initial system [16].
We placed the 3 mm Si wafer (Edmund Optics) at the Brewster angle in order to minimize power loss. Transmitted power was measured after the microscope objective both before and after insertion of the wafer. No difference in the measured power was observed. The Brewster angle incidence increases the optical path length through the Si by approximately 4% of the wafer thickness.
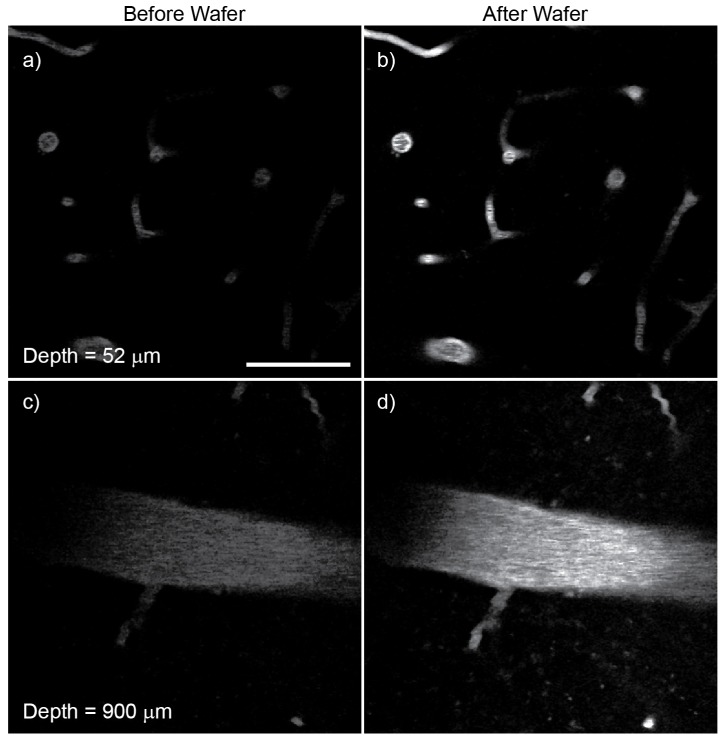
Figure 4 shows the results of in vivo experiments recorded on the mouse brain. The mouse was prepared similar to that described in Horton et al. [7]. We used D2O as the immersion fluid because it has much lower absorption than that of H2O at 1,700 nm. The power at the surface was 1.4 mW when imaging 50 μm below the surface and 25 mW when imaging 900 μm below the surface. Deeper imaging was possible, but the depth at 900 μm was chosen because a large vessel provided a good measure for brightness comparison. Each depth shows approximately 4x increase in signal using the Si wafer, which agrees well with our pulse width measurements. It is important to note that the relative signal increase was similar at each depth despite different amounts of D2O and brain tissue involved. Our results indicate that fine-tuning the Si thickness at different imaging depth is unnecessary when imaging down to approximately 1 mm depth in a mouse brain using a 53 fs pulse at 1,700 nm.
Fig. 4.
In vivo three-photon microscopy of Texas Red-labeled blood vessel within an intact mouse brain. (a) and (c) were recorded without the Si wafer, while (b) and (d) were recorded after insertion of the 3 mm wafer at the Brewster angle. The brightness of the images reflects the signal level. Scale bar, 50 μm.
Discussion
We showed that the simple introduction of a Si wafer resulted in a 4x improvement of 3-photon excited signal for our three-photon microscope. Although fine-tuning the GDD is possible using Si prisms [6,17,18], adding a Si wafer to the optical beam path is significantly simpler. Since Si wafers of various thicknesses are readily available commercially, the addition of the Si wafer provides a simple, practical solution for dispersion compensation at 1,700 nm.
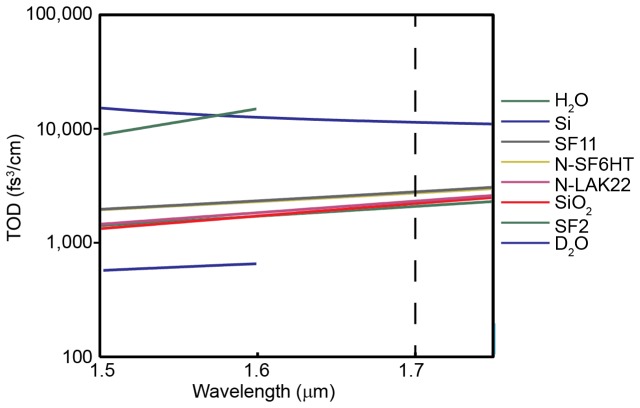
We were able to compress the pulse after the microscope to approximately 115% of the original pulse width using Si wafers at 0.5 mm thickness increments. The discrete nature of our dispersion compensation may introduce a maximum residual GDD of approximately 250 fs2, which can account for a fraction of the residual broadening (for example, we predict that 250 fs2 will broaden the pulse by ~9% (~58 fs vs. ~53 fs). Pulse broadening due to third order dispersion (TOD) is a concern at 1,700 nm. TOD for common optical materials is displayed in Fig. 5 . TOD is positive at 1,700 nm for many common glasses as well as Si, which means that Si cannot provide TOD compensation. Theoretical analysis shows that TOD of 30,000 fs3 will cause a 15% increase in minimum pulsewidth for a 53 fs pulse. It is interesting to note that many types of glasses have between 2000 to 2800 fs3/cm TOD (Fig. 5 and Table 1 ). Our imaging system includes approximately 12 cm of glass. Even though the exact types of glasses used in the microscope optics are not known, it is plausible that TOD could account for a fraction or all of the 15% minimum pulse width increase.
Fig. 5.
TOD of common optical materials.
Table 1. Calculated GVD and TOD of various materials at 1,700 nm. The bold values are calculations at 1,600 nm.
| Material | GVD (fs2/cm) | TOD (fs3/cm) |
|---|---|---|
| H2O | -2,525 | 14,932 |
| Si | 9,827 | 11,406 |
| SF11 | 95 | 2,795 |
| N-SF6HT | 156 | 2,727 |
| N-LAK22 | −326 | 2,317 |
| NBK7 | −448 | 2,261 |
| Fused Silica | −475 | 2,206 |
| SF2 | −9 | 2,082 |
| D2O | -89 | 660 |
In summary, we show that a Si wafer of appropriately chosen thickness can conveniently compensate for the anomalous dispersion introduced by the optical components in a three-photon microscope at 1,700 nm. A factor of over two pulsewidth reduction at the sample is obtained by the simple addition of a 3-mm Si wafer at Brewster angle incidence, which leads to a factor of 4 improvement in signal for three-photon in vivo imaging. Our results further indicate that fine-tuning the Si thickness is unnecessary as a function of imaging depth when imaging down to approximately 1 mm depth in a mouse brain using a 53 fs pulse at 1,700 nm. Finally, TOD generated by glass optics and H2O may be a concern at 1,700 nm, particularly if a pulse width much shorter than 50 fs is used.
Acknowledgments
This paper was partially supported by The National Institutes of Health ( R01EB014873). The authors would like to thank Dimitre Ouzounov, David Sinefeld, and Kriti Charan for helpful discussions with the experiment.
References and links
- 1.Walmsley I., Waxer L., Dorrer C., “The role of dispersion in ultrafast optics,” Rev. Sci. Instrum. 72(1), 1–29 (2001). 10.1063/1.1330575 [DOI] [Google Scholar]
- 2.Entenberg D., Wyckoff J., Gligorijevic B., Roussos E. T., Verkhusha V. V., Pollard J. W., Condeelis J., “Setup and use of a two-laser multiphoton microscope for multichannel intravital fluorescence imaging,” Nat. Protoc. 6(10), 1500–1520 (2011). 10.1038/nprot.2011.376 [DOI] [PMC free article] [PubMed] [Google Scholar]
- 3.Müller M., Squier J., Wolleschensky R., Simon U., Brakenhoff G. J., “Dispersion pre-compensation of 15 femtosecond optical pulses for high-numerical-aperture objectives,” J. Microsc. 191(2), 141–150 (1998). 10.1046/j.1365-2818.1998.00357.x [DOI] [PubMed] [Google Scholar]
- 4.Xi P., Andegeko Y., Weisel L. R., Lozovoy V. V., Dantus M., “Greater signal, increased depth, and less photobleaching in two-photon microscopy with 10 fs pulses,” Opt. Commun. 281(7), 1841–1849 (2008). 10.1016/j.optcom.2007.09.066 [DOI] [Google Scholar]
- 5.Fork R. L., Martinez O. E., Gordon J. P., “Negative dispersion using pairs of prisms,” Opt. Lett. 9(5), 150–152 (1984). 10.1364/OL.9.000150 [DOI] [PubMed] [Google Scholar]
- 6.Sherriff R. E., “Analytic expressions for group-delay dispersion and cubic dispersion in arbitrary prism sequences,” J. Opt. Soc. Am. B 15(3), 1224–1230 (1998). 10.1364/JOSAB.15.001224 [DOI] [Google Scholar]
- 7.Horton N. G., Wang K., Kobat D., Clark C. G., Wise F. W., Schaffer C. B., Xu C., “In vivo three-photon microscopy of subcortical structures within an intact mouse brain,” Nat. Photonics 7(3), 205–209 (2013). 10.1038/nphoton.2012.336 [DOI] [PMC free article] [PubMed] [Google Scholar]
- 8.Xu C., Webb W. W., “Multiphoton excitation of molecular fluorophores and nonlinear laser microscopy,” in Topics in Fluorescence Spectroscopy, Lakowicz J. R., ed. (Plenum, 1997), Vol. 5, pp. 471–540. [Google Scholar]
- 9.Nie B., Saytashev I., Chong A., Liu H., Arkhipov S. N., Wise F. W., Dantus M., “Multimodal microscopy with sub-30 fs Yb fiber laser oscillator,” Biomed. Opt. Express 3(7), 1750–1756 (2012). 10.1364/BOE.3.001750 [DOI] [PMC free article] [PubMed] [Google Scholar]
- 10.Agrawal G. P., Nonlinear Fiber Optics (Academic, 2001). [Google Scholar]
- 11.Salzberg C. D., Villa J. J., “Infrared refractive indexes of silicon germanium and modified selenium glass,” J. Opt. Soc. Am. 47(3), 244–246 (1957). 10.1364/JOSA.47.000244 [DOI] [Google Scholar]
- 12.Malitson I. H., “Interspecimen comparison of the refractive index of fused silica,” J. Opt. Soc. Am. 55(10), 1205–1209 (1965). 10.1364/JOSA.55.001205 [DOI] [Google Scholar]
- 13.Schott optical glass data sheets, http://www.schott.com/advanced_optics/us/abbe_datasheets/schott_datasheet_all_us.pdf
- 14.Kedenburg S., Vieweg M., Gissibl T., Giessen H., “Linear refractive index and absorption measurements of nonlinear optical liquids in the visible and near-infrared spectral region,” Opt. Mater. Express 2(11), 1588–1611 (2012). 10.1364/OME.2.001588 [DOI] [Google Scholar]
- 15.Agrawal H. C., Davis J. M., Himwich W. A., “Developmental changes in mouse brain: weight, water content and free amino acids,” J. Neurochem. 15(9), 917–923 (1968). 10.1111/j.1471-4159.1968.tb11633.x [DOI] [PubMed] [Google Scholar]
- 16.Wang K., Horton N. G., Charan K., Xu C., “Advanced fiber soliton sources for nonlinear deep tissue imaging in biophotonics,” IEEE J. Sel. Top. Quantum Electron. 20(2), 6800311 (2014). [Google Scholar]
- 17.Erny C., Heese C., Haag M., Gallmann L., Keller U., “High-repetition-rate optical parametric chirped-pulse amplifier producing 1-µJ, sub-100-fs pulses in the mid-infrared,” Opt. Express 17(3), 1340–1345 (2009). 10.1364/OE.17.001340 [DOI] [PubMed] [Google Scholar]
- 18.Sell A., Krauss G., Scheu R., Huber R., Leitenstorfer A., “8-fs pulses from a compact Er:fiber system: quantitative modeling and experimental implementation,” Opt. Express 17(2), 1070–1077 (2009). 10.1364/OE.17.001070 [DOI] [PubMed] [Google Scholar]


