Abstract
The measurement of soft tissue fiber orientation is fundamental to pathophysiology and biomechanical function in a multitude of biomedical applications. However, many existing techniques for quantifying fiber structure rely on transmitted light, limiting general applicability and often requiring tissue processing. Herein, we present a novel wide-field reflectance-based imaging modality, which combines polarized light imaging (PLI) and spatial frequency domain imaging (SFDI) to rapidly quantify preferred fiber orientation on soft collagenous tissues. PLI utilizes the polarization dependent scattering property of fibers to determine preferred fiber orientation; SFDI imaging at high spatial frequency is introduced to reject the highly diffuse photons and to control imaging depth. As a result, photons scattered from the superficial layer of a multi-layered sample are highlighted. Thus, fiber orientation quantification can be achieved for the superficial layer with optical sectioning. We demonstrated on aortic heart valve leaflet that, at spatial frequency of f = 1mm−1, the diffuse background can be effectively rejected and the imaging depth can be limited, thus improving quantification accuracy.
OCIS codes: (170.0110) Imaging systems; (170.6935) Tissue characterization; (290.5855) Scattering, polarization; (110.0113) Imaging through turbid media
1. Introduction
Many types of soft biological tissues primarily consist of aligned fibrous structures [1, 2]. The anisotropic fiber organization in soft tissues results in distinct mechanical properties and functions, directed towards optimal physiological function. Fully understanding these structure-function relationships and integrating this knowledge into predictions of the resulting tissue behavior remains an ongoing challenge for a wide range of tissue applications [3]. Directly incorporating fiber orientation information within soft tissue models better predicts their mechanical response [4].
A variety of imaging approaches have been developed to retrieve structural information based on the scattering and birefringent properties from aligned structures at both organ level [5–9] and microscopic level [10–12]. For example, small angle light scattering (SALS) has been used extensively in soft tissue analysis [6]. SALS has an advantage of directly quantifying the angular distribution of fibers rapidly and over large areas of tissue. However, it is a transmitted light technique and remains limited to either thin sections or tissue that have undergone some type of optical clearing (e.g. glycerol immersion). Moreover, transmural variations are lost as the resulting scattering patterns represent the through thickness average [13]. Microscopic fiber orientation imaging techniques typically have challenges for large sample imaging. Polarization-sensitive optical coherence tomography (OCT) has demonstrated its capability of extracting fiber orientation [9]. More recently, Konecky et al reported a technique using rotating spatial patterns to rapidly measure scattering orientation index(SOI) [14]. The typical challenge in tissue imaging arises from strong tissue scattering [15]. For transmission-based techniques, to reduce this scattering, the sample is normally thinly sectioned or chemically cleared [6, 7], which is destructive to the sample. In reflection-based imaging, cross-polarization gating is utilized to suppress diffuse photons [16]. Furthermore, many types of tissues are heterogeneous in structure through their depth. Without proper depth imaging capability, the acquired signal may be averaged over the depth which adversely affects the layer specificity of the measurement.
Here we report a novel wide –field imaging technique that combines polarized light imaging (PLI) with spatial frequency domain imaging (SFDI) at high spatial frequency [17] to determine the local fiber orientation on native tissues, which we term polarized light SFDI (pSFDI). In this integrated imaging technique, PLI utilizes the polarization dependent scattering property of fibers to determine the fiber orientation, and SFDI imaging at high spatial frequency is introduced to reject the highly diffuse photons and to control the imaging depth. As a result, the photons from the superficial layer of a multi-layered sample are highlighted, thus we can achieve more accurate fiber orientation quantification for the superficial layer. Furthermore, pSFDI is able to perform imaging on native tissue with minimal preparation and without the need for chemical treatment.
2. Methods and Instrumentation
2.1 Cylinder scattering simulation
Highly aligned fibrous structures exhibit strong polarization dependent light scattering properties. As a first order approximation, we modeled light scattering fibrous tissues as individual, infinitely long dielectric cylinders. For clarity, a single collagen fiber and scattering cylinder can be thought of as interchangeable terms in this paper. The theory of polarization dependent scattering by cylinders has been thoroughly described [18, 19]. The back-scattered light from a cylinder depends on both the incident light’s in-plane polarization angle and the cylinder’s orientation.
We developed a rotating polarization imaging model to study the properties of the light back-scattered from collagen fibers. Figure 1 depicts the simulation geometry. Fibers of varying diameters align in the x-z plane at 30 degree with respect to x axis. Linear polarized incident light traveling in the y direction illuminates the fibers at normal incidence, and linearly polarized backscattered light is collected at the same polar angle. In other words, the illumination and the collection are co-polarized; thus, only the photons with the same polarization as the incident photons are collected. The incident light (and collected light) polarization angle θ varies from 0 to 180 degrees anticlockwise with respect to the x-z plane.
Fig. 1.
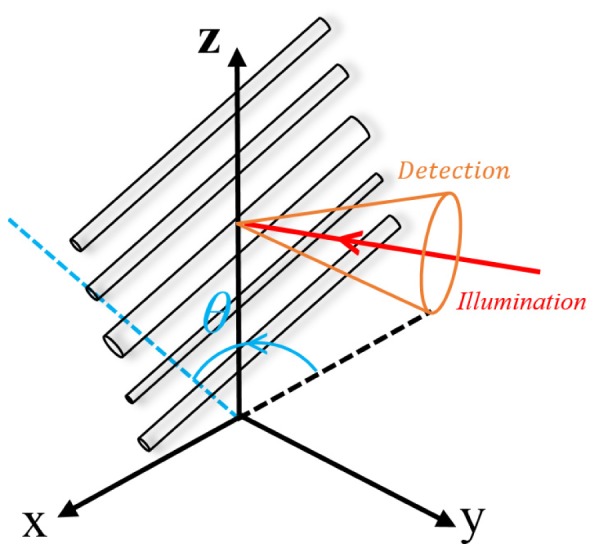
Cylinder light scattering simulation geometry. The cylinders orient at 30 degree with respect to x axis. The polarized light illuminates a collection of cylinders with multiple diameters at normal incidence. The polarization angle θ of the incident light rotates anti-clockwise from 0 degree to 180 degrees.
The back-scattered light can be analytically described using Mueller calculus by summing the scattered light from all fibers, shown in Eq. (1) as
| (1) |
where,
| (2) |
| (3) |
| (4) |
| (5) |
| (6) |
Mscat is the scattering matrix that describes the back scattering property of cylinders and the back scattering efficiency was summed over an angular range of [-φcol, φcol] during the construction of Mscat. The detailed derivation of the elements of scattering matrix Mscat can be found in the classic light scattering books [18, 19]. Mpol and Mrot are matrices representing the linear polarizer and rotator, respectively. Stokes vectors Sin and Sout describe the polarization state of the incident light and the scattered light, respectively. I,Q, U and V are the four elements of a Stokes vector with I representing the detected intensity. The incident light is unpolarized; thus, Sin is reduced to Sin = [1,0,0,0]T. Sout is calculated at each polarization angle θ. In our study, only the back-scattered light intensity Iout in Sout was examined.
We simulated cylindrical light scattering to establish the relationship between the collected polarized light signal and the fiber orientation, which led to the method for determining local fiber orientation. In the simulation, fibers with refractive index of 1.48 were modeled in a medium of refractive index of 1.33. The fibers were oriented at 30 degree with respect to x-axis. The illumination wavelength was 490nm with normal incidence. The polarization of the illumination was rotated through 180 degrees in one degree increment. The back-scattered light was then detected.
For real tissues, the collagen fibers are rarely all aligned to a single orientation. A distribution of fiber alignment is expected. To study the effects of local fiber distribution, we performed the same simulation over a collection of fibers with fiber orientation following a normal distribution. The preferred orientation or mean orientation was still at 30 degrees. The standard deviation of the fiber orientation varied from 0 degree to 20 degrees with an increment of 5 degrees. We also simulated the scattering property on fibers with totally random orientations. The overall scattering property was simulated on 3000 fibers.
2.2 SFDI imaging and diffuse background rejection
As photons propagate deeper into the tissue, they typically will 1) become highly diffusive through multiple scattering events and 2) interact with structurally distinct layers in multilayered samples. Both effects will either mask or distort the back-scattered photons from the superficial layer. Utilizing SFDI imaging at high spatial frequency allows for the rejection of these diffuse photons and enhancement of the information from the superficial layer. SFDI imaging is an effective tool for quantitative evaluation of tissue optical properties over a wide field of view [20]. In SFDI imaging, three phase-shifted sinusoidal illumination patterns are projected onto the sample. We collect diffuse reflectance images containing pattern-tissue interaction in order to retrieve sample optical properties. Besides optical property mapping, SFDI imaging can also perform depth controlled imaging by varying the spatial frequency. The penetration depth in SFDI imaging is determined by both optical properties (absorption and scattering) and spatial frequency. As the illumination pattern propagates into the medium, the modulation of spatial pattern becomes attenuated due to scattering and absorption. The modulation or AC image was extracted using demodulation technique shown in Eq. (9), where I1, I2 and I3 are the reflectance images of the sample under three sinusoidal illumination patterns with phase shifts of 0°, 120° and 240°,respectively [17]. Higher the spatial frequency is, faster modulation attenuation will be. Thus, the turbid medium acts like a low-pass filter. For high spatial frequency pattern, the modulation can only be preserved at very shallow depth. The effective penetration depth δ’eff depends on both the tissue optical properties and the spatial frequency of the illumination pattern. The effective penetration depth for a scattering dominant medium can be described as [20]
| (7) |
where μa is the absorption coefficient, is the reduced scattering coefficient and f is the spatial frequency. At high spatial frequency, the effective penetration depth mainly depends on the spatial frequency, and thus can be approximated as
| (8) |
This suggests that the penetration will be nearly constant across the entire sample and has weak dependency on sample optical properties. Thus sample wide penetration variation will be very small. The diffusive components are rejected through the demodulation process (Eq. (9).
| (9) |
| (10) |
Thus, we obtain a depth controlled image, or AC image, which highlights only the reflected photons that experience fewer scattering events: those from the superficial layer of the sample. The conventional diffuse reflectance image or DC image can also be recovered from I1, I2 and I3 using Eq. (10).
2.3 pSFDI imaging system
We developed a pSFDI imaging system, as shown in Fig. 2 , to perform fiber orientation mapping on native tissues. Compared to a standard SFDI imaging system, pSFDI has a rotating linear polarizer that serves as both the polarizer for illumination and analyzer for imaging. Sinusoidal patterns with a phase shift of 0°, 120° and 240° at a spatial frequency f = 1mm−1 were generated by a digital micromirror device (DMD) (Lightcrafter, Texas Instruments) and projected onto the sample under 490nm LED illumination. The projection unit was custom modified to achieve low magnification projection, which increased the achievable spatial frequency. A linear polarizer was mounted on a motorized rotational stage and was rotated over a 180-degree range with a step size of 5 degrees. At each polarization angle, a high-resolution camera (piA2400-17 gm/gc, Basler) recorded the three phase-shifted reflectance images. The camera has a native resolution of 2456x2058 pixels and has a pixel size of 3.45 microns. A Schneider 70mm lens (TELE-XENAR 2.2/70) with an F/# of 2.2 was used. The imaging field was approximately 22mm x 14mm. Automated custom software written in LabVIEW controlled the system, and required approximately 90 seconds for full image acquisition. The DMD system was operated in ‘stored-pattern-sequence’ mode to avoid internal gamma correction.
Fig. 2.
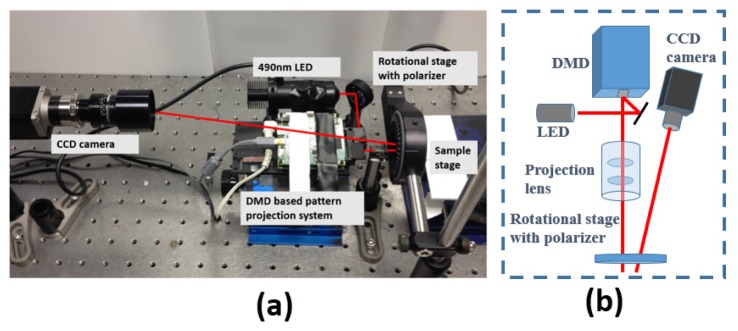
(a) Color picture of pSFDI imaging system. (b) Schematic of the pSFDI imaging system.
2.4. Ex-vivo tissue imaging
Based on the simulation results, we performed ex-vivo tissue imaging to demonstrate the technique. Both fresh bovine tendon and porcine aortic valve leaflet tissue (PVL) were imaged. Bovine tendon was chosen for a reference material as the collagen fibers typically run longitudinally along the length of the tendon. In addition, the gross fiber direction is observable by eye, which allows for quick validation checks. High degree of fiber orientation has been previously studies [21]. Cardiac valve leaflet tissues, especially aortic and aortic cusps, have been well studied [2, 22, 23]. These leaflets typically display characteristic fiber orientations, with fibers running along the circumferential direction. For that reason, and because leaflet tissue exhibits regional variation in fiber alignment, aortic valve leaflet tissue was studied to demonstrate the capability in sample-wide fiber orientation quantification with the pSFDI system.
2.4.1 Second-harmonic generation (SHG) imaging
Before fiber orientation mapping, we performed two-photon imaging to determine collagen fiber diameters in PVL. This diameter information was used in the simulation to improve the accuracy of the model, as well as to help form a preliminary understanding of PVL microstructure. Aortic valves were dissected from fresh porcine hearts and were stored temporarily in phosphate-buffered saline (PBS) prior to imaging. The SHG images of the collagen fiber networks in PVLs were obtained with a commercial two-photon microscope (Ultima System, PRAIRIE Technologies) at 900nm. The PVL was placed on a glass slide and covered by a cover slip during imaging. A 20x water immersion objective was used.
2.4.2 pSFDI imaging and sample preparation
We mapped the fiber orientation of ex-vivo bovine tendon, ex-vivo two-layer bovine tendon, PVL and combined tendon-PVL samples using pSFDI. The fibrosa side of the PVL was imaged. The fibrosa layer has high collagen concentration and dense fiber organization. Bovine tendon sections were sectioned from intact full tendons. The sections were cut parallel to the longitudinal direction of the tendon such that the collagen fiber direction was in-plane. To image with pSFDI, samples were placed flat against 2x3 inch glass slides and placed in the imaging field to reduce the specular reflection from the sample. The combined PVL-bovine tendon samples required the placement of a bovine tendon section immediately against the PVL and clamping the two to a glass side with non-destructive silicone rubber. The PVL-bovine tendon sample was larger than the projected illumination area; thus the sample was imaged twice and stitching was performed in post processing to form a whole image.
2.4.3 Small angle light scattering (SALS) imaging and sample preparation
The same PVL samples used in pSFDI were then imaged with SALS (after fixation and clearing) as an accuracy check and comparison. The SALS imaging technique has been previously described in detail and validated [6]. Briefly, the scattered light of a 5mW HeNe laser (λ = 632.8nm) was examined to determine the local fiber orientation. By raster scanning a sample through the beam path a sample-wide fiber orientation map was acquired. The porcine aortic valve leaflets were prepared for SALS imaging. Submersing the leaflets in 4 increasing grades of PBS/glycerol solution ranging from 50 to 100 percent glycerol cleared the tissue by extracting diffusive water without altering sample geometry. Cleared PVL samples were placed, without compression, between two glass slides and raster-scanned by a SALS device, with total scanning time of 30 minutes.
3. Results
3.1 Cylinder scattering simulation
Figure 3 shows the collagen fiber network from a localized region of the leaflet tissue. The size of the collagen fibers is relatively consistent with small variation. Fiber diameters were distributed approximately between 1µm to 3µm. The measured range of fiber diameter information was used in the model described in Section 2. Figure 4(a) shows a plot of the simulated back-scattered light from cylinders versus the incident polarization over a 180-degree polarization range. The simulation results show two peaks over 180 degrees. The higher peak is located at 30 degrees, which corresponds to true local fiber orientation, and the lower peak is 90 degrees away from the higher peak. Thus, the local fiber orientation can be determined by tracking the location of the higher peak.
Fig. 3.
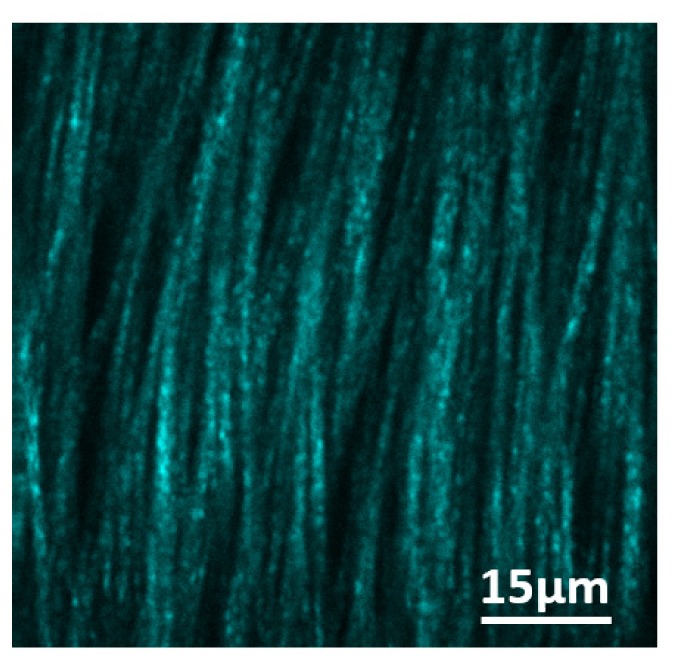
SHG image shows the collagen fibers in porcine aortic valve leaflet tissue.
Fig. 4.
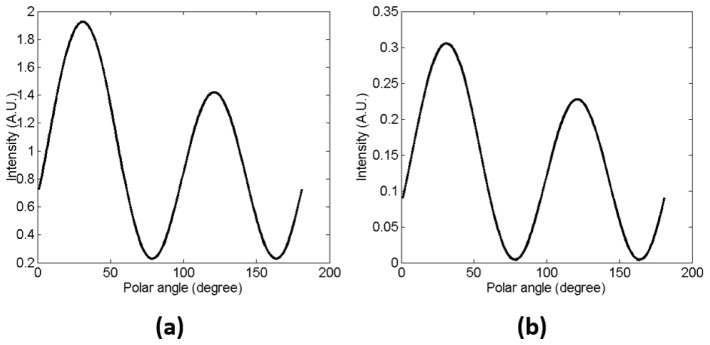
Polarization dependent back-scattered light over 180-degree polarization range for (a) collagen fibers and (b) collagen fibrils. Two peaks can be identified. The higher peak indicates that illumination polarization is parallel to the fiber orientation, while lower peak indicates they are perpendicular.
Collagen fibers consist of hundreds of collagen fibrils with diameters ranging from 260µm to 410µm [24]. We also simulated the scattering property of collagen fibrils and the result is shown in Fig. 4(b). Comparison between Fig. 4(a) and Fig. 4(b) suggested that both collagen fibers and fibrils had similar scattering property.
The fiber orientation distribution simulation result shown in Fig. 5 suggests that two distinct peaks still can be identified over 180 degree range even with fiber orientation distribution. Higher peaks are located at 30 degrees, which also corresponds to preferred local fiber orientation. However, as the fibers become more spread out, both the higher peak intensity and lower peak intensity decrease. This trend correlates with the alignment quality of fibers. For totally randomly oriented fibers, the scattering profile is flat over 180 degree range.
Fig. 5.
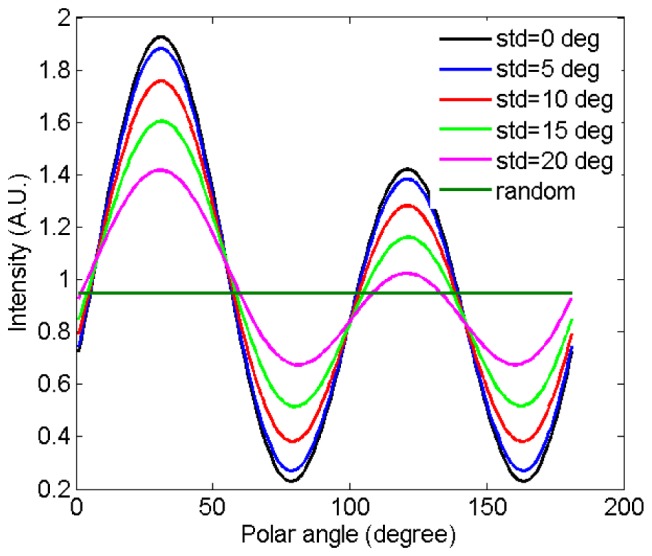
Polarization dependent back-scattered light over 180-degree polarization range for 6 fiber distributions. The higher peaks locate at 30 degree for normal distribution. With higher fiber orientation deviation, both higher peak and lower peak intensity decrease. No peak can be found for random distribution.
3.2 Collagen fiber orientation mapping on bovine tendon
Figure 6 shows the fiber orientation map of two bovine tendon samples quantified using the pSFDI imaging system. The red dashed rectangle in the standard color image shows the imaged area. The blue arrow indicates the gross fiber orientation for each bovine tendon based on visible features. The mean fiber orientation for the left and right sections of bovine tendon are about −80 degrees and 60 degrees, respectively. Figure 6(b) shows the back-scattered intensity from both DC and AC components over a 180-degree range from one pixel indicated by the black square in Fig. 6(a). Note that the data in the plot were from an individual pixel and no averaging was used. The black square was only for indicative purpose to highlight the location of data. The incident polarization modulated the reflectance intensity. Two peaks can be identified, which agrees with the simulation. The location of the higher peak indicates the local fiber orientation. The polar plots for both DC and AC show a very similar shape, although the DC plot has slightly higher SNR than the AC one. In terms of relative intensity, the AC component is only about 47% of the DC peak intensity, which confirms diffuse background rejection.
Fig. 6.
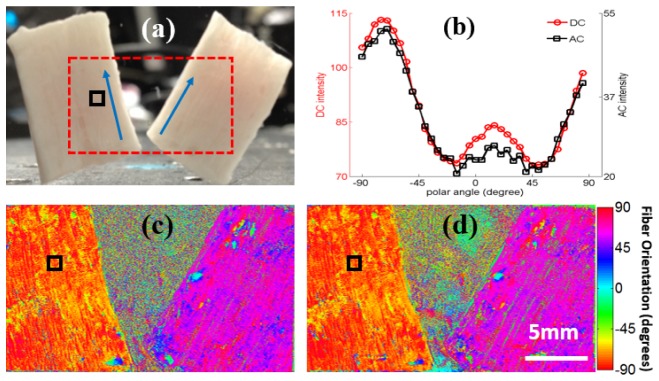
Collagen fiber orientation mapping on bovine tendons. (a) Blue arrows indicate the gross fiber orientation of the bovine tendons. Red rectangle shows the imaged area. (b) Back-scattered intensity plot over a small region indicated by a black square using both DC and AC components. (c) Fiber orientation map extracted using on AC components. (d) Fiber orientation map extracted using DC component.
Figure 6(c) and 6(d) show the fiber orientation map retrieved based on DC and AC components, respectively. These images were generated by identifying the angle at which the peak intensity was observed across polarization angles. The color represents preferred local fiber orientation. Overall, the two maps appear very similar, and the color-coded orientation map agrees well with the expected fiber orientation based on visual inspection. The bovine tendon has very consistent fiber orientation through its depth. Thus, using both DC and AC components, the fiber orientation map can be accurately quantified over a large area of the sample. This experiment demonstrated that pSFDI imaging was able to accurately retrieve the fiber orientation on a sample with simple structures and non-varying layers. For such samples, both DC and AC based orientation maps showed similar results.
To further explore the depth-controlled imaging capability of pSFDI, we imaged a two-layer model with two thin slices of fresh bovine tendon. The layers were arranged such that their preferred fiber orientations cross-aligned at ~45 degrees with top and bottom layer thicknesses of approximately 200µm and 1mm respectively. Collagen fiber orientation maps were retrieved using pSFDI at two spatial frequencies: 0.5 and 0.09mm−1.
Orientation maps gathered from a two-layer bovine tendon sample depicted the capability of the pSFDI system to discriminate top layer fiber information. The bottom tendon layer was visible underneath the top layer (Fig. 7(a) ). When the sample was imaged solely with PLI with no spatial pattern, it is clear from the yellow coded areas in the top layer region that collagen orientation was falsely retrieved (Fig. 7(b)), as bovine tendon should display a highly uniform orientation. Without depth control, the acquired signal represents photons that fully penetrated the top layer and interacted with the lower layer.
Fig. 7.
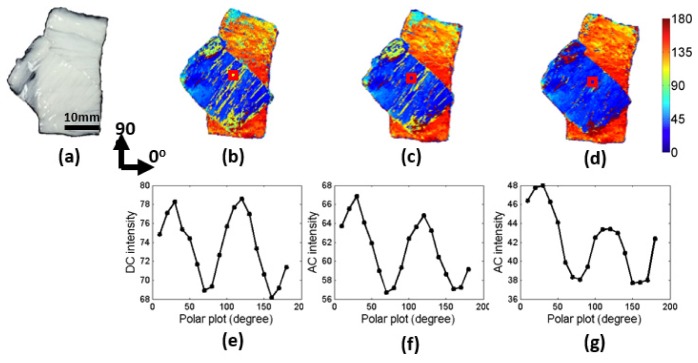
Depth controlled pSFDI imaging of a two-layer bovine tendon sample (a). The collagen fiber orientation map retrieved using polarized light imaging without spatial pattern in map (b). The collagen fiber orientation maps (c) and (d) retrieved at spatial frequencies 0.09 and 0.5 mm-1, respectively. The intensity plot (e-g) for localized regions in (b-d), respectively.
By introducing structured illumination and by tuning the spatial frequency from 0.09 mm−1 to 0.5 mm−1 (Fig. 7(c)-7(d)), top layer discrimination was achieved. The effective penetration depth decreased from over 1000 μm to approximately 300 μm estimated according to Eq. (8). Thus we noticed that retrieved collagen fiber orientation became more consistent over the top layer region, which was because the light primarily interacted with the top layer, and the contribution from the underlying layer was effectively eliminated. The polar plots (Fig. 7(e)-7(g)) from the region indicated by red square demonstrated the higher peak location moved from ~120 degree to ~40 degree as the spatial frequency increased.
3.3 Collagen fiber orientation mapping on heart valve leaflet
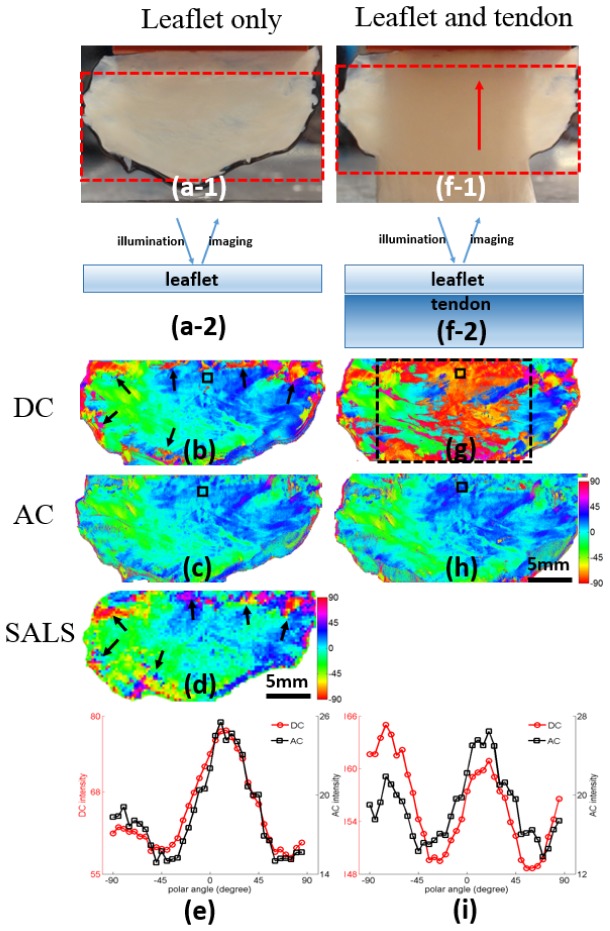
We performed two experiments on ex-vivo porcine PVL tissues to further examine the pSFDI performance on samples with complex structures. The leaflet was imaged alone first. The red rectangle in the standard color image illustrates the imaged area in Fig. 8 (a-1). Figure 8(b) and 8(c) show fiber orientation maps extracted using both DC and AC components, respectively. Overall, the two orientation maps show very similar results, and they have a good agreement with the fiber orientation map generated using SALS imaging shown in Fig. 8(d). By examining polarization dependent scattering (Fig. 8(e)) over a 180-degee polarization range for both DC and AC components in small regions indicated by the black squares in Fig. 8(b) and 8(c), we noted that the polar plots agreed well with each other and also with the simulation results. The DC component has higher overall intensity than AC component. This is because the diffuse photons were rejected in demodulation process. Two peaks can be identified in both plots, and the higher peak positions match with each other. However, Fig. 8(b) suggests that there are a few small regions where retrieved fiber orientation may not be reliable compared with the AC component based results, as indicated by black arrows. Similar features can also be identified in the SALS based orientation map shown in Fig. 8(d). This observation indicates that the fiber organization may be complex in those regions as confirmed by previous study [22]. In that study, fiber orientation of fibrosa and ventricularis layer were studied individually by separating these two layers from an intact leaflet. In most regions of a leaflet especially in the center region, the fiber orientation are comparable for fibrosa layer and ventricularis layer. However, towards the edge of the leaflet, the fibrosa and ventricularis layers display different fiber orientations. Transmission based imaging or conventional reflection based imaging is not able to well separate there two layers, thus, only through-the-thickness results can be obtained. By introducing the SFDI imaging, the signal from the superficial layer/fibrosa layer can be enhanced. The AC based orientation map shows the orientation transition is much smoother in those regions. This study indicates that both AC and DC based methods can quantify fiber orientation in the center region of the leaflet where fiber orientation is less depth dependent. However, towards the edge of the leaflet, the fibrosa and ventricularis layers show different fiber orientations. Thus AC component based method is able to quantify fiber orientation in superficial layer without being affected by deeper tissue by using optical sectioning.
Fig. 8.
pSFDI imaing on PVL (a-1 and 2) and PLV-tendon combination (f-1 and 2). DC component based fiber orientaion maps (b and g) for PLV and PLV-tendon combination, respectively. AC component based fiber orientation maps (c and h) for PLV and PLV-tendon combination, respectively. A SALS based orientation map (d) for PLV was obtained for comparison purpose. Polar plots of both AC and DC components from a small region indicated by black sqares (b and g) for both PLV (e) and PLV-tendon combination (i) respectively. Black arrows in (b) and (d) indicate unreliable fiber orientation. Dashed black rectangle in (g) indicates the overlapping region of PLV-tendon combination.
To demonstrate that fiber orientation can be better quantified by rejecting diffuse photons from deeper tissue using the AC component, we placed the same leaflet on a thinly sliced bovine tendon with ~1mm thickness shown in Fig. 8(f-1) and Fig. 8(f-2), and mapped the fiber orientation using both DC and AC components. The red arrow in Fig. 8(f) indicates gross fiber orientation of the tendon. Figure 8(g) and 8(h) show that there is a significant difference between retrieved fiber orientation maps. In the DC component based map, half of the orientation map shows the fiber orientation of bovine tendon in the overlapping region. On the other hand, using the AC component, the fiber orientation of the leaflet still can be quantified even with the presence of the highly scattering bovine tendon layer. This can be qualitatively understood as follows. In the region where the leaflet is thin, the back-scattered light intensity from the leaflet is small compared with the one from the bovine tendon layer. Thus, the detected signal carries orientation information mainly from the bottom layer. Once SFDI is introduced, it eliminates the highly diffuse photons from this bottom bovine tendon layer, and highlights the back-scattered photons from the top layer, which allows for the fiber orientation retrieval on superficial layer of the leaflet. This phenomenon can be further confirmed by plotting the intensity variation over 180-degree polarization range over a small region indicated by the small black square in Fig. 8(g) and 8(g). Figure 8(i) indicates 1) AC component has much lower intensity due to diffuse photon removal. Only about 17% of the peak intensity is detected in AC component compared with DC component. 2) The higher peak locations are different for both AC and DC components, which indicates the bovine tendon structures mainly determine fiber orientation without diffuse background rejection. The diffuse photons were successfully suppressed by using demodulation at high spatial frequency, which resulted in improved fiber orientation retrieval accuracy.
4. Discussion
In this paper, we described a new imaging technique, pSFDI, for mapping the fiber orientation of native tissues by utilizing polarization dependent scattering. We significantly improved the quantification accuracy in multilayered samples by rejecting the diffuse photons to limit the sampling depth using SFDI imaging technique. Compared with Konecky’s approach, pSFDI technique is different in the following ways: 1) pSFDI probes the fiber orientation by rotating the polarization of the illumination instead of rotating the illumination patterns. 2) The spatial patterns in pSFDI are used to reject diffuse background and to control the imaging depth instead of directly probing the fiber orientation. In conventional polarization difference imaging, the photons from superficial layer can be extracted by taking the difference between parallel detection and perpendicular detection [25]. The parallel detection captures photons with its original polarization state from both superficial and deeper tissue. The perpendicular detection removes the specular reflection and photons from superficial layer; thus the signal from deeper tissue can be highlighted as suggested by Morgan et al [26], which is the main difference compared with superficial detection in pSFDI. The polarization difference imaging is able to perform superficial detection, however, the imaging depth solely depends on the depolarization capability of the sample. In pSFDI imaging, parallel detection is used to collect photons with its original polarization state from superficial layer to deeper tissue. After the introduction of structured illumination, the imaging depth then depends on both sample’s optical property and spatial frequency of the pattern. By changing the spatial frequency, the imaging depth can be controlled. Thus, the superficial detection is possible.
The experimental data was processed using both DC and AC components. It is apparent that, for samples with simple structures like bovine tendon, DC and AC based results did not show much difference. This suggests that, for such samples, structured illumination does not add extra benefit. Thus, planar illumination may suffice and the imaging time can be reduced by 66%. However, for the naturally multilayered tissues, like heart valve leaflets, and more extreme artificial samples like the leaflet-tendon combination, AC component based results justified the structured illumination for improved superficial layer quantification accuracy. At a spatial frequency of 1mm−1, the penetration depth is estimated as 159 using Eq. (8), which is thinner than the average thickness of 265µm for a typical leaflet [2]. Thus, imaging at this spatial frequency, only the superficial layer of the leaflet is sampled, and we can obtain the layer specific fiber orientation map.
In our study, we used collagen fibers instead of collagen fibrils to model the light scattering property. A collagen fiber consists of hundreds of densely packed collagen fibrils. It is likely that these fibrils form a composite refractive index inside the fiber; thus, scattering is from the refractive index mismatch between extracellular matrix and densely packed fibrils. Since fibers consist individual fibers, part of scattering could be from fibrils. Our simulation on individual fibrils with diameter between 260nm to 410nm [24] suggested that fibrils have similar scattering property compared with fibers shown in Fig. 4. However, given the nature that fibrils are densely packed, we think individual fibers are major scatterers, which is consistent with previously reported light scattering studies [1, 5, 27].
We used a collection of fibers with multiple diameters to study the scattering property from the bulk tissue. As a first order approximation, only a mono-layer of fibers was modeled. In this model, one photon primarily interacts with one fiber. Thus, we were able to study the light-tissue interaction using an analytical method. However, this simplified model does not reveal full light-tissue interaction in bulk tissue. This model is sufficient to represent the fiber scattering property, and experimental results agree well with simulation results. The light-tissue interaction is more complex in real bulk tissues. The photons are mainly forward scattered and will interact with multiple layers of fibers rather than a single fiber layer. Furthermore, only cylindrical scatterers were considered in the model, while in real tissue, a much more complex array of both spherical and cylindrical scatterers exist. A Monte-Carlo model accounting for both spherical and cylindrical scatterers would be beneficial to fully study bulk tissue scattering.
Compared with other polarization based methods, pSDFI imaging requires only one linear polarizer versus at least 2 polarizers for other methods. This simple configuration significantly reduced the system calibration requirement. Furthermore, this configuration allowed for direct visualization of the light-structure interaction via the polar plot. One can estimate the local fiber orientation by locating the higher peak on the polar plot.
We quantified the fiber orientation directly from the polar plot of the back-scattered intensity by tracking the location of the main reflectance peak. Although straightforward, the accuracy is limited by the angular step size during the imaging. In our study, a five degree step size was used. To increase the accuracy, a smaller step size can be used at the expense of longer imaging time. Potentially, the fiber orientation can also be quantified by fitting the experimental data to analytical model, which may tolerate a larger angular step-size. Such fitting-based method may be less time efficient, but it may have the potential to extract richer information other than orientation. Furthermore, we noted that some tissues might have very complex fiber organization in certain regions, where two distinct peaks could be reduced to one large peak. Fitting-based method may fail in these regions. However, the preferred fiber orientation may still be determined by just tracking the peak position.
With our current pSFDI implementation, we were required to collect two separate images and stitch them together to accommodate the full leaflet. This is not a limitation of pSFDI imaging, but of our specific hardware. The 0.3” DMD chipset used here is relatively small and has lower resolution compared to 0.55” and 0.7” chipsets. In pSFDI imaging, the spatial patterns are represented by micromirrors. Fewer micromirrors per period are, higher the spatial frequency will be. Also, the spatial frequency can be increased by reducing the projection magnification. To achieve a spatial frequency of f = 1mm−1, we used 18 micromirrors to represent one spatial period and we also reduced the projection magnification. As a result, the projection field was relatively small, thus the leaflet was imaged twice to get the whole coverage. With a bigger chipset, the projection area will be bigger and the entire leaflet could potentially be imaged at high spatial frequency without the need for image stitching.
5. Conclusion
In this paper we described a novel imaging modality, pSFDI, which combines polarized light imaging and spatial frequency domain imaging techniques to perform fiber orientation mapping on superficial layer by rejecting diffuse photons and controlling the imaging depth at high spatial frequency. In the case of samples having simple fibrous structures, pSFDI imaging may be reduced to the polarized light imaging for increased acquisition speed while preserving accuracy. The small form factor and fast imaging speed allow for integration with mechanical testing devices to study sample response under controlled deformation. pSFDI imaging promises to be a versatile tool in matters concerning fibrous tissue microstructure.
Acknowledgments
This research work was supported by grants from National Institutes of Health under grants R21EB015892
References and links
- 1.Arifler D., Pavlova I., Gillenwater A., Richards-Kortum R., “Light scattering from collagen fiber networks: micro-optical properties of normal and neoplastic stroma,” Biophys. J. 92(9), 3260–3274 (2007). 10.1529/biophysj.106.089839 [DOI] [PMC free article] [PubMed] [Google Scholar]
- 2.Joyce E. M., Liao J., Schoen F. J., Mayer J. E., Jr, Sacks M. S., “Functional collagen fiber architecture of the pulmonary heart valve cusp,” Ann. Thorac. Surg. 87(4), 1240–1249 (2009). 10.1016/j.athoracsur.2008.12.049 [DOI] [PMC free article] [PubMed] [Google Scholar]
- 3.Sacks M. S., “Biaxial mechanical evaluation of planar biological materials,” Journal of Elasticity and the Physical Science of Solids. 61(1/3), 199–246 (2000). 10.1023/A:1010917028671 [DOI] [Google Scholar]
- 4.Sacks M. S., “Incorporation of experimentally-derived fiber orientation into a structural constitutive model for planar collagenous tissues,” J. Biomech. Eng. 125(2), 280–287 (2003). 10.1115/1.1544508 [DOI] [PubMed] [Google Scholar]
- 5.Drezek R., Dunn A., Richards-Kortum R., “Light scattering from cells: finite-difference time-domain simulations and goniometric measurements,” Appl. Opt. 38(16), 3651–3661 (1999). 10.1364/AO.38.003651 [DOI] [PubMed] [Google Scholar]
- 6.Sacks M. S., Smith D. B., Hiester E. D., “A small angle light scattering device for planar connective tissue microstructural analysis,” Ann. Biomed. Eng. 25(4), 678–689 (1997). 10.1007/BF02684845 [DOI] [PubMed] [Google Scholar]
- 7.Tower T. T., Tranquillo R. T., “Alignment maps of tissues: I. Microscopic elliptical polarimetry,” Biophys. J. 81(5), 2954–2963 (2001). 10.1016/S0006-3495(01)75935-8 [DOI] [PMC free article] [PubMed] [Google Scholar]
- 8.Liao R., Zeng N., Jiang X., Li D., Yun T., He Y., Ma H., “Rotating linear polarization imaging technique for anisotropic tissues,” J. Biomed. Opt. 15(3), 036014 (2010). 10.1117/1.3442730 [DOI] [PubMed] [Google Scholar]
- 9.Jiao S., Wang L. V., “Two-dimensional depth-resolved Mueller matrix of biological tissue measured with double-beam polarization-sensitive optical coherence tomography,” Opt. Lett. 27(2), 101–103 (2002). 10.1364/OL.27.000101 [DOI] [PubMed] [Google Scholar]
- 10.Axer H., Keyserlingk D. G., “Mapping of fiber orientation in human internal capsule by means of polarized light and confocal scanning laser microscopy,” J. Neurosci. Methods 94(2), 165–175 (2000). 10.1016/S0165-0270(99)00132-6 [DOI] [PubMed] [Google Scholar]
- 11.Bromage T. G., Goldman H. M., McFarlin S. C., Warshaw J., Boyde A., Riggs C. M., “Circularly polarized light standards for investigations of collagen fiber orientation in bone,” Anat. Rec. B New Anat. 274(1), 157–168 (2003). 10.1002/ar.b.10031 [DOI] [PubMed] [Google Scholar]
- 12.Yasui T., Tohno Y., Araki T., “Determination of collagen fiber orientation in human tissue by use of polarization measurement of molecular second-harmonic-generation light,” Appl. Opt. 43(14), 2861–2867 (2004). 10.1364/AO.43.002861 [DOI] [PubMed] [Google Scholar]
- 13.Tower T. T., Neidert M. R., Tranquillo R. T., “Fiber alignment imaging during mechanical testing of soft tissues,” Ann. Biomed. Eng. 30(10), 1221–1233 (2002). 10.1114/1.1527047 [DOI] [PubMed] [Google Scholar]
- 14.Konecky S. D., Rice T., Durkin A. J., Tromberg B. J., “Imaging scattering orientation with spatial frequency domain imaging,” J. Biomed. Opt. 16(12), 126001 (2011). 10.1117/1.3657823 [DOI] [PMC free article] [PubMed] [Google Scholar]
- 15.Alali S., Ahmad M., Kim A., Vurgun N., Wood M. F. G., Vitkin I. A., “Quantitative correlation between light depolarization and transport albedo of various porcine tissues,” J. Biomed. Opt. 17(4), 045004 (2012). 10.1117/1.JBO.17.4.045004 [DOI] [PubMed] [Google Scholar]
- 16.Nan Z., Xiaoyu J., Qiang G., Yonghong H., Hui M., “Linear polarization difference imaging and its potential applications,” Appl. Opt. 48(35), 6734–6739 (2009). 10.1364/AO.48.006734 [DOI] [PubMed] [Google Scholar]
- 17.Cuccia D. J., Bevilacqua F., Durkin A. J., Tromberg B. J., “Modulated imaging: quantitative analysis and tomography of turbid media in the spatial-frequency domain,” Opt. Lett. 30(11), 1354–1356 (2005). 10.1364/OL.30.001354 [DOI] [PubMed] [Google Scholar]
- 18.Bohren C. F., Huffman D. R., Absorption and Scattering of Light by Small Particles (John Wiley & Sons, 2008). [Google Scholar]
- 19.Hulst H. C., Van De Hulst H., Light Scattering by Small Particles (Courier Dover Publications, 1957). [Google Scholar]
- 20.Cuccia D. J., Bevilacqua F., Durkin A. J., Ayers F. R., Tromberg B. J., “Quantitation and mapping of tissue optical properties using modulated imaging,” J. Biomed. Opt. 14(2), 024012 (2009). 10.1117/1.3088140 [DOI] [PMC free article] [PubMed] [Google Scholar]
- 21.Sacks M. S., Chuong C. J., “Characterization of collagen fiber architecture in the canine diaphragmatic central tendon,” J. Biomech. Eng. 114(2), 183–190 (1992). 10.1115/1.2891370 [DOI] [PubMed] [Google Scholar]
- 22.Sacks M. S., Smith D. B., Hiester E. D., “The aortic valve microstructure: effects of transvalvular pressure,” J. Biomed. Mater. Res. 41(1), 131–141 (1998). [DOI] [PubMed] [Google Scholar]
- 23.Lee C.-H., Oomen P. J., Rabbah J. P., Yoganathan A., Gorman R. C., Gorman J. H., III, Amini R., Sacks M. S., “A high-fidelity and micro-anatomically accurate 3d finite element model for simulations of functional mitral valve,” in Functional Imaging and Modeling of the Heart (Springer, 2013), pp. 416–424. [DOI] [PMC free article] [PubMed] [Google Scholar]
- 24.Bozec L., van der Heijden G., Horton M., “Collagen fibrils: nanoscale ropes,” Biophys. J. 92(1), 70–75 (2007). 10.1529/biophysj.106.085704 [DOI] [PMC free article] [PubMed] [Google Scholar]
- 25.Jacques S. L., Ramella-Roman J. C., Lee K., “Imaging skin pathology with polarized light,” J. Biomed. Opt. 7(3), 329–340 (2002). 10.1117/1.1484498 [DOI] [PubMed] [Google Scholar]
- 26.Morgan S. P., Zhu Q., Stockford I. M., Crowe J. A., “Rotating orthogonal polarization imaging,” Opt. Lett. 33(13), 1503–1505 (2008). 10.1364/OL.33.001503 [DOI] [PubMed] [Google Scholar]
- 27.Saidi I. S., Jacques S. L., Tittel F. K., “Mie and Rayleigh modeling of visible-light scattering in neonatal skin,” Appl. Opt. 34(31), 7410–7418 (1995). 10.1364/AO.34.007410 [DOI] [PubMed] [Google Scholar]


