

Abstract
The degree of intactness of human cognitive functioning for a given individual spans a wide spectrum, ranging from normal to severely demented. The differential diagnosis for the causes of impairment along that spectrum is also wide, and often difficult to distinguish clinically, which has led to an increasing role for neuroimaging tools in that evaluation. The most frequent causes of dementia are neurodegenerative disorders, Alzheimer's disease being the most prevalent among them, and they produce significant alterations in brain metabolism with devastating neuropathologic, economic, social and clinical consequences. These alterations are detectable through positron emission tomography (PET), even in their earliest stages. The most commonly performed PET studies of the brain are carried out with [18F]fluorodeoxyglucose (FDG) as the imaged radiopharmaceutical. Such scans have demonstrated diagnostic and prognostic utility in evaluating patients with cognitive impairment, and in distinguishing among primary neurodegenerative disorders and other etiologies for cognitive decline. In addition to focusing upon the effects on cerebral metabolism examined with FDG PET, some other changes occurring in the brains of cognitively impaired patients assessable with other radiotracers will be considered. As preventive and disease-modifying treatments are developed, early detection of accurately diagnosed disease processes facilitated by the use of PET has the potential to substantially impact upon the enormous human toll exacted by these diseases.
Introduction
Among all applications of positron emission tomography (PET) of the brain in current clinical practice, evaluating changes in cognitive abilities is the one for which the greatest demand currently exists. The degree of intactness of human cognitive functioning spans a wide spectrum. This ranges from normal for a given individual, to a subjective perception of impairment that is not objectively documented by neuropsychologic tests, but which can represent the earliest stages of decline, to minimally impaired states with neuropsychologic functioning diminished slightly below the mean level of normal young performance (sometimes categorized as “age-associated” or “age-consistent”), to an intermediate state often referred to as “mild cognitive impairment” (MCI), to states of dementia of mild, moderate, or severe degree. While some of the people experiencing milder forms of impairment are on a path of progressive decline, others will have stable or reversible forms of impairment, and the differential diagnosis for the associated causes is wide at every level, with the actual cause often difficult to clinically discern.
Dementia affects approximately 24 million people worldwide, with about 5 million new cases occurring annually.1 The most common cause of decline that eventually leads to dementia, and the best-studied, is Alzheimer's disease (AD). This condition occurs in 10-15% of people over 65, and 40-50% of all those older than 85. The disease is present in approximately two-thirds of cases of dementia. It is estimated to currently afflict 5.1 million people at a cost to society of $148 billion in the United States alone, a number projected to rise to 11-16 million people by 2050, as the aging of the baby boomers expands our geriatric population.2 Other causes of cognitive decline include dementia with Lewy bodies, cerebrovascular disease, frontotemporal dementia, Creutzfeldt-Jakob disease, HIV-associated dementia, neurosyphilis, Parkinson's dementia, normal pressure hydrocephalus, and dementias due to exposure to toxic substances (heavy metals, alcohol, other drugs), metabolic abnormalities, or psychiatric disorders.
Limitations of Conventional Clinical Evaluation
A definite diagnosis of AD can be made only by histopathologic examination of brain tissue. 3 The identification and differential diagnosis of AD is especially challenging in its early stages, partly because of the difficulty in distinguishing it from the mild decline in memory that can occur with normal aging and from mild cognitive manifestations of other neuropsychiatric conditions, such as depression, as well as other causes of dementia. False positive and false negative diagnoses with respect to presence of AD are not uncommonly made, even by physicians experienced with the evaluation of dementia. 4-8 Moreover, clinical assessment frequently involves multiple examinations and laboratory tests over months or years.
There is greater need for early accurate diagnosis, now that several medications for the treatment of mild to moderate AD are available. Most are cholinesterase inhibitors, used to delay cognitive decline associated with mild to moderate disease. More recently, memantine was approved by the United States Food and Drug Administration for treating patients with moderately advanced disease. Patients with neurodegenerative disease have the most to gain from therapy that intervenes as early as possible in the course of inexorably progressive irreversible damage to brain tissue, and controlled clinical trials have demonstrated that cholinesterase inhibitors can improve, or delay decline in, memory and other cognitive functions in mild or moderately affected AD patients. 9-15 Treatment can cut by more than half the proportion of patients requiring nursing home placement over a given period of time. 16,17 Cholinergic and other18 agents also have beneficial effects with respect to reducing behavioral problems, improving patients' functional abilities, and decreasing caregiver burden. 13,19-22 Studies examining long-term effects of cholinesterase inhibitors indicate that drug treatment produces an average delay in cognitive decline in AD patients of nine to twelve months and a delay in the need for institutionalization of eighteen months on average. 19,23-25 Moreover, delaying the implementation of therapy by as little as six months – in addition to carrying the inherent adverse consequence of depriving the patient of the short-term advantages of potentially enhanced cognitive and functional abilities during that time – may have long-term consequences as well. 11,13,19,26 Because early treatment interventions are able to keep patients at higher levels of functioning longer, and future innovative therapies may be able to further delay the onset of dementia and slow its progression, or potentially reverse it when intercepted at a sufficiently early stage, it is becoming increasingly important to accurately diagnose dementia as early as possible.
Few studies have specifically addressed the question of clinical detection of very mild disease, particularly with comparison to the criterion standard of histopathologic diagnosis. In the report of the Quality Standards Subcommittee of the American Academy of Neurology,8 three “Class I” studies were identified in which the diagnostic value of clinical assessment could be meaningfully measured (Class I indicates “a well designed prospective study in a broad spectrum of persons with the suspected condition, using a ‘gold standard’ for case definition, and enabling the assessment of appropriate tests of diagnostic accuracy”), and only one of them6 focused upon evaluating dementia at a relatively early stage. To be included in that investigation, patients were required to have had onset of dementia symptoms within one year of entry. All of the 134 patients evaluated underwent a complete standardized diagnostic work-up comprised of a comprehensive medical history and physical, neurological examination, neuropsychologic testing, laboratory tests, and structural neuroimaging, and an average of three additional years of clinical follow-up with repeated testing. Sensitivity of this assessment for AD was 83-85%, while specificity was 50-55%, yielding an overall accuracy of 69%.
One impediment to accurately identifying presence of disease is reliance on standardized cut-off scores on mental status or cognitive screening tests. Highly educated individuals who have suffered cognitive decline may show normal performance on cognitive examinations, while people with less education may appear to have cognitive impairment or dementia when they actually have not declined. Test scores are most useful as a quantitative baseline against which to compare future assessments, rather than as diagnostic markers. A particular problem in the early stages of decline is that clinicians often have difficulty distinguishing complaints of the “worried well” (i.e., normal aging) from those of patients who have an underlying brain disorder that will result in progressive cognitive decline. Subjective complaints can indicate the presence of mood disorders or early dementia, and in any event, should be taken seriously.27,28
FDG PET Studies of Normal Brain and Healthy Aging
Clinical PET studies of the brain are carried out most commonly using [18F]fluorodeoxyglucose (FDG). The resulting scans are typically interpreted qualitatively, by visual analysis, although quantitative software tools are becoming increasingly used as adjuncts to interpretation. In either case, the relative distribution of FDG throughout the patient's brain is examined, and compared to the distribution expected for a normal subject.
When quantification is performed, it may be expressed as regional concentrations of measured radioactivity normalized to some internal reference standard – for example, a reference region of the brain, the whole brain activity, or the average whole-body concentration prior to excretion and decay-corrected to the actual time of imaging (i.e., standardized uptake value, or SUV). Those results, often termed ‘semi-quantitative,’ turn out to be adequate for most clinical applications, as well as for many research applications. In contrast, ‘absolute quantitative’ values are derived from biologically based mathematical models that reflect the partitioning of radioactivity into compartments that can reflect both physiological boundaries (e.g., the vascular space, the blood-brain barrier, the plasma membrane of neurons) and biochemical processes (enzymatic anabolism and degradation, transport molecules). These models necessarily represent substantial simplifications of the actual biological environment, but nevertheless have proven capable of yielding quantitative estimates in good agreement with similar measures obtained by more invasive methods. In the case of FDG studies, the biological parameter that is being estimated is the rate of regional glucose utilization, based on a method described by Sokoloff and his colleagues,29 originally developed with 14C-labeled 2-deoxyglucose. Early measures of regional glucose utilization rates in the human brain30-34 yielded estimates of global cerebral metabolism of approximately 5.5 mg glucose/min/100g, which ranged from 3.6-5.2 mg glucose/min/100g in white matter to 5.8-10.3 mg glucose/min/100g in gray matter tissues. Regional values which have been more recently published,35-37 reflecting measurements using instruments and techniques with improved imaging capabilities, are in substantial agreement with these initially reported values. A recent study by Yamaji et al. 37 is notable for having obtained regional SUV measurements of cortex in the same group of subjects in whom absolute quantitative values were obtained, with remarkably close correspondence of the two types of measures seen in healthy brain. Frontal cortex was calculated to utilize 7.9 mg of glucose per minute per 100g brain tissue and had an SUV of 7.7; sensorimotor cortex demonstrated values of 8.1 and 7.8 for corresponding absolute and SUV determinations, parietal cortex 7.8 and 7.7, temporal cortex 7.1 and 7.0, and occipital cortex 7.8 and 7.7, respectively.
Cerebral blood flow can be measured with absolute quantification or semi-quantitatively using the tracer H215O with PET. Rate of blood flow is normally tightly coupled with local metabolic needs of healthy brain tissue, through vasoconstrictive-vasodilatory autoregulation of blood supply. Thus, within a vascular territory, measures of cerebral blood flow and glucose metabolic rate co-vary nearly linearly. Between different vascular territories, however, different constants of proportionality can pertain. For example, since most of the lateral neocortex is supplied by the middle cerebral artery branch of the carotid circulation, the pattern of distribution of H215O closely parallels that of the metabolic tracer FDG throughout most of the cortical surface. However, dissociations can occur. The cerebellum, despite its lower metabolic activity relative to neocortex, is more richly perfused, being supplied by arterial branches of the vertebrobasilar circulation. Also, in certain pathologic circumstances (e.g., cardiovascular disease), the normal coupling between metabolism and perfusion can be disturbed, such that a consistent relationship may not exist even within a vascular territory.
With either tracer, an important issue is determining how PET-based measurements of normal brain function can be expected to change during the course of healthy aging. Effects of normal aging on adult brain function have been examined with PET. In a study of 37 healthy adults ranging in age from 19 to 50 years,37 the most significant age-related decline in cerebral blood flow was found in the mesial frontal cortex, encompassing the anterior cingulate cortex, and extending rostrally into the supplementary motor area. In an independent study of 27 healthy adults ranging from 19-76 years old,38 the most significant age-related decline was found in the medial orbito-frontal cortex, and this was the only regional effect to remain significant after correction for partial volume effects of cerebral atrophy. Likewise, measures of metabolism using FDG have also identified an age-related decline in healthy adults,35 most consistently in frontal cortex. nevertheless, as previously reviewed,39 studies of carefully selected subjects find declines to be minimal in glucose metabolism throughout most of the brain in normal aging.
From Normal to Mild Decline in Cognition to Dementia
As described above, minimal gradual changes are expected with healthy aging, with respect to both cognitive abilities and cerebral metabolism. Evaluating patients in the earliest stages of potentially pathologic change requires initiating that process at the time that decline first becomes evident. The decline may be noted by a physician with whom the patient has an ongoing relationship, by a family member or other close contact of the patient, or by the history provided by a patient which is deemed to be reliable. The key concept is that there has been mild decline in cognition (MDC) – i.e., a decline relative to the patient's own normal level of performance, greater or faster than would be expected for normal aging.
In patients who are high-functioning to begin with, MDC can occur at a much earlier point in time (often several years earlier) than the point at which the patient would meet criteria for a specific diagnostic category such as even mild cognitive impairment (MCI), as impairment is defined at least in part by how the patient performs relative to a normal group (see Figure 1). A limitation with impairment-based categories is that even when the comparative normal group is adjusted for age and educational level, there is a wide range of baseline abilities among say, 65 year old college graduates, varying with factors such as premorbid ability, further educational achievement, differences in decades of professional and social activity, etc.
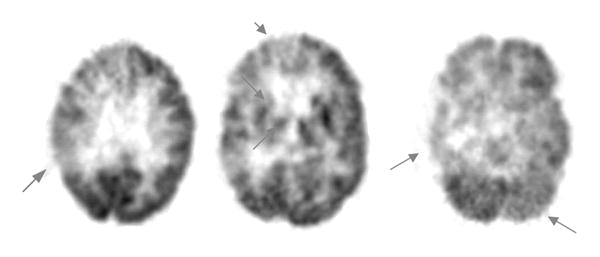
Figure 1. Longitudinal visual and quantitative PET evaluations of an initially clinically “normal” subject with Mild Decline in Cognition (MDC).
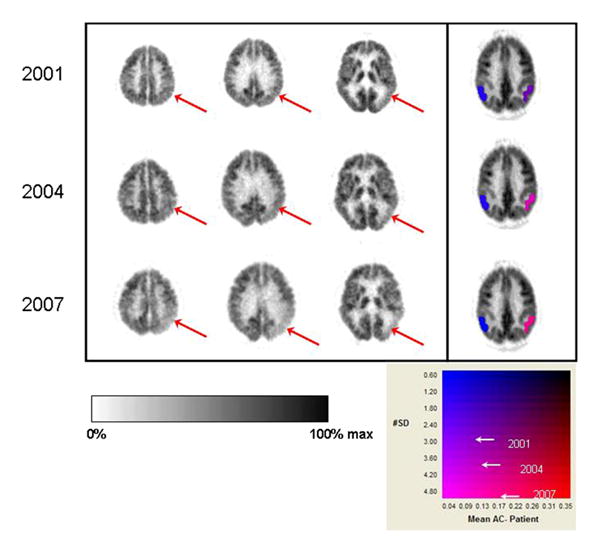
First three columns of images represent transaxial slices through the brain, displayed from superior (parietal cortex posteriorly) to inferior (temporal cortex posteriorly) levels. Right side of image is left side of brain. PET data are displayed in an inverse linear gray scale (left color bar underneath brain images). In the fourth column, color denotes standardized volumes of interest quantifying FDG activity in parietotemporal cortex (2-dimensional color scale underneath brain images; y-axis denotes number of standard deviations (SD), x-axis denotes magnitude of difference from asymptomatic controls.) (Top) FDG PET scan of high-functioning 71 year old male, who noted mild decline in his own cognition, but was considered “normal” both by general clinical evaluation and formal neuropsychologic testing. Scan reveals mild metabolic asymmetry with left temporal cortex (arrow in rightmost plane) lower than right. Left parietotemporal cortex was quantified as 3 SD and 9% below normal. Posterior cingulate cortex was also quantified as falling 3 SD below normal (not shown) at this point, and scan was interpreted as concerning for incipient dementia process. (Middle) Progression of posterior hypometabolism (arrows in middle and right planes). Left parietotemporal cortex was quantified as 4 SD and 12% below normal. Patient now met criteria for “mild cognitive impairment” (MCI) on formal neuropsychologic testing (Bottom) Further progression of posterior hypometabolism (arrows in left, middle, and right planes). Left parietotemporal cortex was quantified as 5 SD and 16% below normal. Patient now met criteria for borderline MCI/dementia.
How accurately can FDG PET be used in the evaluation of non-demented patients, who are in the earliest stages of cognitive decline? Certain patterns of regional cerebral metabolism are predictive of future cognitive decline (Figure 2), and it is clear that metabolic changes associated with early AD, such as decreases in posterior cingulate and associative cortical activity, can be detected with PET even before the symptomatic manifestations of the disease become evident.41-43 As recently reviewed,44 overall accuracies achieved with use of FDG PET have been nearly as high in very mildly affected patients as in demented patients. PET may be especially valuable in this clinical setting, considering the difficulty of distinguishing these patients from those with mild memory loss attributed to normal aging.
Figure 2. Baseline metabolic comparison of clinically normal subjects who showed declining cognition versus cognitive stability over the subsequent two years.
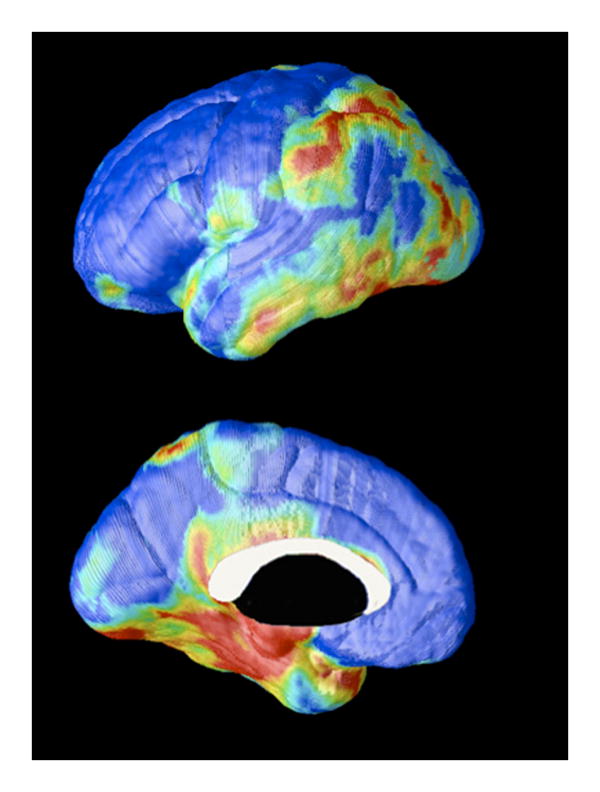
A 3-dimensional MR-based mapping technique of coregistered PET data applied to 19 clinically normal subjects to compare baseline metabolism among those whose neuropsychologic testing demonstrated significant decline (n=4) over the subsequent two years, versus those who remained stable (n=15). Larger differences are represented as higher on the rainbow scale. Decliners had relative hypometabolism in entorhinal, parahippocampal, parietal, temporal, and posterior cingulate cortical areas at baseline.40
FDG-PET may serve explicitly as a prognostic tool, to determine likelihood of deterioration of mental status in the period following the time of scanning. Relative hypometabolism of associative cortex can be accurately used to predict whether cognitive decline will occur at a rate faster than would be expected for normal aging, over the several years following a PET evaluation.42,45 Moreover, the magnitude of decline over a two-year period, for some standardized measures of memory, correlates with the initial degree of hypometabolism of inferior parietal, superior temporal and posterior cingulate cortical regions.46 As cognitive impairment caused by a neurodegenerative disease progresses, associated progression of regions of hypometabolism also occurs. Physicians examining brain PET scans for dementia prognosis in cognitively impaired patients with depression and thyroid disease should interpret positive scans with caution, however, due to the potentially confounding effects of those conditions on regional brain metabolism.44 For example, Bench et al reported that metabolism of certain cerebral regions are negatively correlated with mood symptoms and severity of psychomotor slowing in depression;47 these regions were found to include the inferior parietal and superior temporal cortex, areas also affected in AD.
With respect to incremental prognostic value of PET beyond conventional clinical assessment, it has been found that among patients having clinical working diagnoses presuming non-progressive etiologies for their cognitive complaints, those whose PET patterns were nevertheless indicative of progressive dementia were more than 18 times likelier to experience progressive decline than those with non-progressive PET patterns.45 When neurologists and other dementia experts diagnosed their patients as having progressive dementia, they were correct in 84 percent of those cases. Adding a positive diagnosis from a PET scan boosted the accuracy of that prediction to 94 percent, and a negative PET scan made it 12 times more likely that the patient would remain cognitively stable.
MCI is seen as a transitional stage between normal aging and dementia including but not exclusive to the AD-type.48 The outcome of MCI varies, indicating that it is a heterogeneous disorder. While eventually many will develop AD, some will develop other types of dementia, some remain stable and others revert to normal cognition. Several imaging studies have investigated this condition, particularly in MCI patients with marked memory impairment (i.e., ‘amnestic’ MCI), who are at especially high risk for declining to AD with an estimated conversion rate of over 10% per year.
In longitudinally following patients from a state of explicitly normal cognition to explicitly MCI, it has been found that regional metabolism can be predictive of this transition. It was found by de Leon and colleagues that reduced baseline metabolic levels in part of the hippocampal formation, the entorhinal cortex, predicted an MCI diagnosis 3 years later.49 At baseline, entorhinal cortical metabolism was reduced 18% in those subjects who declined to MCI relative to those who did not decline at the follow-up. This baseline metabolic reduction predicted decline to MCI with 83% sensitivity and 85% specificity. While reductions in medial temporal lobe volumes do correlate with the decline from NL to MCI,50-52 and can be predictive of future dementia,53 this metabolic decline occurred in excess of atrophic changes. After correcting for atrophy, the decliners still showed 11% decreased entorhinal cortex metabolism as compared to the non-decliners, and the predictive accuracy was almost the same, at 80%,49 analogously to significant metabolic reductions which have been demonstrated to persist in MCI and AD after atrophy correction.54-56
In addition to alterations in brain metabolism generally identifiable in MCI patients,49,54,55,57,58 particularly in medial temporal areas, specific regions of hypometabolism have been shown to be predictive of MCI conversion to probable Alzheimer's disease,43,59-63 most consistently in parietal, temporal and posterior cingulate cortex. Predictive accuracies of these patterns have been high, typically ranging from 80 to 100%.
Genetic background concomitantly affects risk for declining from a state of normal cognitive function to developing AD, as well as patterns of brain glucose metabolism. The epsilon 4 allele of the apolipoprotein E gene is associated with a significantly increased risk of developing AD of senile onset; overall, those with the 4/3 or 4/4 genotype are more than twice as likely to have AD compared to individuals with the 3/3 genotype.64 FDG-PET studies have linked the epsilon 4 allele to hypometabolism in posterior cingulate, parietal, and temporal cortex, and have identified greater metabolic asymmetry in nondemented relatives of individuals with probable AD.46,65-67 Furthermore, significant metabolic decline in these regions has been longitudinally observed in those who have inherited the epsilon 4 allele as measured by repeating PET in the same subjects over a two-year interval,46 and decreased posterior cingulate metabolism is observable in subjects as young as in their twenties who have inherited the allele.67,68
Diagnosis of Dementing Illnesses
A wide variety of neurodegenerative diseases have been demonstrated to produce significant alterations in brain function detectable with PET. Distinguishing these alterations with PET has served as a subject of considerable investigation for three decades,69-72 and continues to be actively studied and extensively reviewed.44,73-75 Many thousands of patients with clinically diagnosed -- and, in some cases, histopathologically confirmed – causes of dementia from many independent laboratories have been studied using PET measures of cerebral blood flow, glucose metabolism, oxygen utilization, amyloid and other microstructural imaging agents, as well as of neurotransmitter receptors, transporters, and enzyme systems. The best studied application of this type is the use of FDG-PET to evaluate for presence of AD. Sensitivity of FDG-PET in this context has been consistently high, indicating that by the time a patient presents with a neurodegenerative dementia, substantial alteration of cortical metabolic function has occurred (Figure 3). The associated decreases in glucose metabolism in certain brain areas are readily detectable on FDG images, and identification of the particular brain areas of involvement can be valuable in the differential diagnosis of dementia. For example, in contrast to the relatively preserved occipital metabolism seen even in late stages of AD (Figure 3 bottom row), occipital cortex is not preferentially spared by the dementia of Parkinson's disease, or Dementia with Lewy Bodies (Figure 4); similarly, subcortical structures preserved in AD are not preferentially spared in vascular dementia. Other neurodegenerative dementias with well-established characteristic patterns of hypometabolism, particularly in the less advanced stages, when assistance with accurate diagnosis is most needed, include frontotemporal dementia (prefrontal and/or anterior temporal cortex affected out of proportion to other cortical areas), and Huntington's disease (caudate and then putamen markedly affected at a time that cortical metabolism is relatively intact).44
Figure 3. Changes in cortical metabolism typical for various degrees of impairment, from normal to late AD.
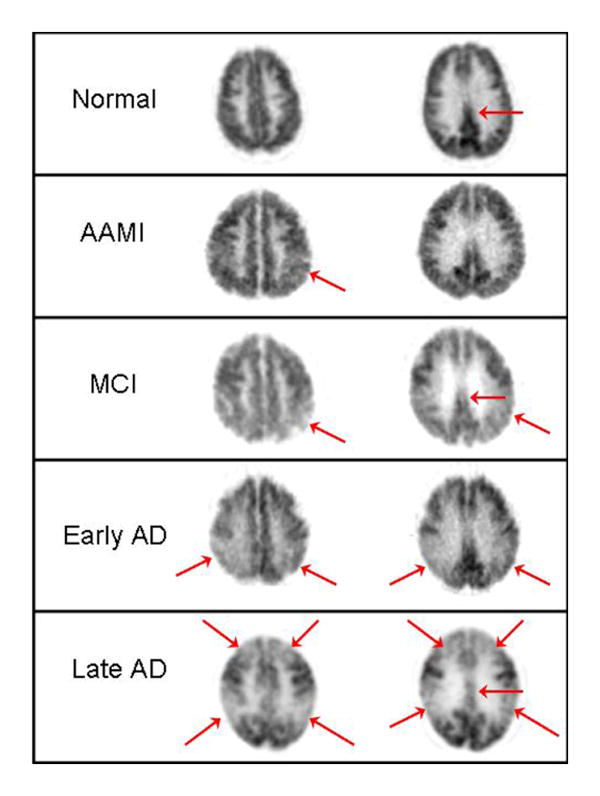
FDG PET images of transaxial planes from five patients, shown at comparable axial levels. (First row) Normal pattern, provided for reference. Note how posterior cingulate cortex (arrow) normally has activity that is visibly higher than in average cortex. (Second row) Patient with Age Associated Memory Impairment, not meeting criteria for MCI. Arrow denotes a patchiness in the inferior parietal cortex that is beginning to emerge, and activity in posterior cingulate cortex is also seen to be less robust than in normal subject. (Third row) Mild Cognitive Impairment, nearing conversion to Alzheimer's disease, with clear hypometabolism of parietal, parietotemporal and posterior cingulate cortex. (Fourth row) Early Alzheimer's disease, demonstrating posterior-predominant cortical hypometabolism. (Fifth row) Late Alzheimer's disease, with both prefrontal, parietal, temporal, and posterior cingulate cortical regions markedly hypometabolic, but with continued relative preservation of sensorimotor and visual cortex. At lower planes than shown here, basal ganglia, thalamus, cerebellum and brainstem would also be seen to be relatively preserved at all stages.
Figure 4. Dementia with Lewy bodies.
FDG PET pattern is typically posterior-predominant, as in AD, but without preferential sparing of occipital cortex.
In most earlier studies of the diagnostic accuracy of PET, the assessment was based upon comparison of PET findings to clinical assessments performed near the time of PET. The ability of that approach to determine diagnostic accuracy is limited by the fact that clinical diagnosis can be inaccurate, particularly for patients presenting in the earliest stages of disease -- a time when the opportunity for effective therapy, and for meaningful planning, is greatest. Studies comparing neuropathologic examination with imaging are thus most informative in assessing the diagnostic value of PET. In a pooled analysis76 of three previously published studies,77-79 histopathologically confirmed sensitivity and specificity of PET for detecting the presence of AD were 92% and 71%, respectively. In the largest single-institution series published up to that point, Hoffman and co-workers80 found sensitivity and specificity of PET for Alzheimer's disease to fall in the range of 88-93% and 63-67%, respectively. A subsequent multi-center study collected data from an international consortium of clinical facilities which had acquired both brain FDG-PET and histopathologic data for patients undergoing evaluation for dementia.41 The PET results identified patients with AD with sensitivity and specificity of 94% and 73%, respectively. This latter study, which included over three times as many patients as the four previous series combined, included a stratified examination of the subset of patients with documented early or mild disease. Performance of PET with respect to sensitivity (95%), specificity (71%) and overall accuracy (89%) was nearly the same. The above values are in accordance with the ranges found in a broader review of the PET literature which also included studies lacking neuropathologic confirmation of diagnoses,81 that reported sensitivities ranging from 90% to 96% and specificities ranging from 67% to 97%, as well as in an assessment of the PET literature reported by the American Academy of Neurology,82 based on their review of published studies which demonstrated diagnostic accuracies of 86%-100% for PET.
Other Tracers
While clinical application of PET in the evaluation of patients with conditions leading to cognitive impairment and dementia has largely focused upon FDG, many other tracers have been employed in this context. Though a detailed consideration of those tracers is beyond the scope of the present review, a few such examples will be mentioned here.
To begin, use of PET to study cerebrovascular disease, as with AD, also enjoys a long history, extending back to the time of the earliest dementia studies.83,84 These conditions overlap, in that uncontrolled chronic cerebrovascular disease can eventually lead to vascular dementia (Figure 5). PET has been used to directly quantify several parameters pertinent to the status of the cerebrovascular system, including cerebral blood flow, cerebral blood volume, and cerebral rate of oxygen metabolism, using 15O-labeled water, carbon monoxide, and oxygen gas. This has allowed estimation of further relevant parameters through calculations based on the values derived from those measurements, including cerebrovascular mean transit time, cerebral perfusion pressure, oxygen extraction fraction, and stoichiometry of oxygen and glucose utilization. Each of these has been reported to change, in different ways, under circumstances stemming from the pathophysiological events that occur during cerebrovascular compromise, and the evolution of stroke as well as its aftermath. For example, oxygen extraction fraction data, calculated from PET measures of regional oxygen metabolism and blood flow using [15O]oxygen gas and [H215O]water, respectively, were demonstrated to predict stroke risk in patients having a history of stroke or transient ischemic attack in the distribution of an occluded carotid artery.85,86 Patients with elevated oxygen extraction fractions (operationally defined by asymmetry, through reference to a control group, approximately corresponding to exceeding the contralateral region by more than 8%), after adjusting for age, had a 6-fold higher risk of suffering a stroke (all but one occurring ipsilateral to the side with higher oxygen extraction fraction) than controls. 85 It was independently found that increased hemispheric oxygen extraction (defined by a reference value derived from the mean and variance of the extraction fraction of a control group, corresponding to exceeding 53.3%) was associated with a 7-fold higher risk of suffering a stroke.86 (A less significant difference was found between groups categorized according to asymmetry of oxygen extraction fraction.) In the setting of acute stroke, restoration of cerebral blood flow demonstrated with [15O]water, in patients scanned before and after thrombolytic therapy with tissue plasminogen activator (tPA), predicted clinical improvement assessed three weeks later.87 In PET studies performed within 5-18 hours of onset of middle cerebral artery stroke, the extent of abnormally low cerebral blood flow or oxygen metabolism (but not blood volume, perfusion pressure, or oxygen extraction fraction) correlated with final infarct size and long-term clinical outcome.88 Beyond investigation of these relatively well-studied hemodynamic parameters measurable with PET, studies with newer tracers (e.g., those recognizing activated microglial cells or benzodiazepine receptors) are also showing promise of contributing clinically meaningful information to the assessment of patients with cerebrovascular disease. Recent studies have also turned to comparing the above hemodynamic parameters measured with PET alone to parameters obtained with use of acetazolamide,89 or obtained with perfusion-weighted MRI.90-91 It remains to be seen what impact any of these methods to assess various aspects of cerebral status will have on routine clinical management of patients with cerebrovascular disease.
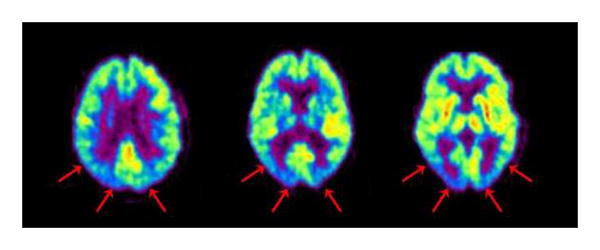
Figure 5. Vascular dementia.
Patient was diagnosed both clinically and by structural imaging with vascular dementia. Arrows on this scan indicate hypometabolism of the right parietal cortex (left), right basal ganglia and thalamus (middle) and right temporal cortex (right). The hypometabolism of the left cerebellum (right) is characteristic of cross-cerebellar diaschisis, caused by diminished afferent input from contralateral cortex.
Much of the attention of the past few years in dementia imaging has been focused upon imaging of amyloid plaques and neurofibrillary tangles with PET. Just as changes in glucose metabolism occur early in the development of AD pathology, evidence from postmortem studies indicates that the accumulation of senile plaques and neurofibrillary tangles, the neuropathological hallmarks of AD, occurs over the decades prior to clinical AD diagnosis.92 In an effort to visualize these neuropathological lesions in vivo, several groups have independently developed PET tracers with which to label these pathologies. Best studied in humans are the thioflavin T derivative [11C]PIB, which recognizes beta-amyloid plaques, and [18F]FDDNP, which labels plaques and tangles. Both have been used in patients with AD93,94 and with MCI.95,96 These types of compounds may prove particularly useful in drug development, in particular for those drugs that are aimed at diminishing the burden of insoluble plaques or neurofibrillary tangles in the brain.
Many other tracers have been aimed at neurotransmitter systems affected by Alzheimer's and other neurodegenerative diseases, including probes for cholinergic receptors and cholinesterase enzymes, dopaminergic transporters, and serotonin receptors. For example, reduced density of medial temporal serotonin receptors can serve as an index of hippocampal pyramidal neuronal loss, and [18F]MPPF is a selective imaging probe for 5-HT1A receptors in hippocampus and other brain areas. This permits quantification of 5-HT1A receptors in the human brain with PET, in a manner that distinguishes patients with AD from normal controls.97 While many of these tracers have been useful in uniquely enabling examination of molecular processes associated with dementia in living brain tissue, it remains to be seen what role they may play clinically.
Future Directions
It is evident that the biologic changes that occur with AD take place decades before the onset of clinical symptoms. Utilizing more powerful diagnostic approaches allows the earlier detection of initial changes in a target population before a diagnosis of AD can be made. Currently, the tools for identifying the early changes of AD are outpacing the available therapeutic options. With advances in potential disease-modifying treatments, the benefits of early detection will become of greater importance allowing therapy to be initiated as early as possible.
Much attention is currently focused upon methods intended to prevent Alzheimer's disease or to modify its course. Given the low incidence and slow progression of normal elderly to AD (1-3%/year),98 using traditional clinical endpoints to test the efficacy of such treatments would require very large samples, long follow-up, and great expense to follow cognitively normal persons treated with a candidate primary prevention therapy to assess impact on development of AD. FDG-PET imaging may be used to expedite the process by detecting brain abnormalities in individuals who might be at heightened risk for AD but who have not yet developed symptoms. Some studies used statistical power analyses to test the feasibility of using brain glucose metabolism as outcome measure in long-term treatment studies of AD in comparison to cognitive test scores.99,100 For example, it was estimated that to detect a 33% treatment response with 80% power in a typical 1-year, double-blind, placebo-controlled treatment study, a cognitive study using the Mini Mental State Examination would require 224 AD patients per group, compared with 36 patients per group would be needed for an FDG-PET study,99 due to the relatively small variance in regional brain metabolism measures from session to session, compared with the variance in neuropsychologic test performance.
Finally, PET may be used to examine cerebral responses to nonpharmacological preventative strategies. As an example of this approach, effects of a lifestyle intervention, consisting of healthy diet, exercise, and cognitive stimulation, on brain function and other physiological indices related to cardiac and brain health were measured.101 Healthy volunteers were randomized to the active intervention or a control activity. The intervention group showed significant changes in frontal lobe activity on PET compared to the control group that suggested increased efficiency in regional brain function. Larger clinical trials are underway to further assess the effects of such interventions.
Acknowledgments
We are indebted to Erin Siu and Vicky Lau for their assistance with manuscript preparation.
Footnotes
Publisher's Disclaimer: This is a PDF file of an unedited manuscript that has been accepted for publication. As a service to our customers we are providing this early version of the manuscript. The manuscript will undergo copyediting, typesetting, and review of the resulting proof before it is published in its final citable form. Please note that during the production process errorsmaybe discovered which could affect the content, and all legal disclaimers that apply to the journal pertain.
References
- 1.Ferri CP, Prince M, Brayne C, et al. Global prevalence of dementia: a Delphi consensus study. Lancet. 2005;366:2112–2117. doi: 10.1016/S0140-6736(05)67889-0. [DOI] [PMC free article] [PubMed] [Google Scholar]
- 2.Alzheimer's Association. Alzheimer's Disease Facts and Figures. 2007 accessible through www.alz.org.
- 3.Powell MR, Smith GE, Knopman DS, et al. Cognitive measures predict pathologic Alzheimer disease. Arch Neurol. 2006;63:865–868. doi: 10.1001/archneur.63.6.865. [DOI] [PubMed] [Google Scholar]
- 4.Callahan CM, Hendrie HC, Tierney WM. Documentation and evaluation of cognitive impairment in elderly primary care patients. Ann Intern Med. 1995;122:422–429. doi: 10.7326/0003-4819-122-6-199503150-00004. [DOI] [PubMed] [Google Scholar]
- 5.Hoffman RS. Diagnostic errors in the evaluation of behavioral disorders. JAMA. 1982;248:964–967. [PubMed] [Google Scholar]
- 6.Lim A, Tsuang D, Kukull W, et al. Clinico-neuropathological correlation of AD in a community-based case series. J Am Geriatr Soc. 1999;47:564–569. doi: 10.1111/j.1532-5415.1999.tb02571.x. [DOI] [PubMed] [Google Scholar]
- 7.McDaniel LD, Lukovits T, McDaniel KD. AD: the problem of incorrect clinical diagnosis. J Geriatr Psychiatry Neurol. 1993;6:230–234. doi: 10.1177/089198879300600409. [DOI] [PubMed] [Google Scholar]
- 8.Knopman DS, DeKosky ST, Cummings JL, et al. Practice parameter: diagnosis of dementia (an evidence-based review). Report of the Quality Standards Subcommittee of the American Academy of Neurology. Neurology. 2001;56:1143–1153. doi: 10.1212/wnl.56.9.1143. [DOI] [PubMed] [Google Scholar]
- 9.Birks J, Iakovidou V, Tsolaki M. Cochrane Database Systemic Review. Vol. 4. Update Software Ltd; Oxford, UK: 2000. [Accessed August 30, 2000]. Rivastigmine for AD; p. CD001191. The Cochrane Library. [Google Scholar]
- 10.Burns A, Rossor M, Hecker J, et al. the International Donepezil Study Group The effects of donepezil in AD: results from a multinational trial. Dementia. 1999;10:237–244. doi: 10.1159/000017126. [DOI] [PubMed] [Google Scholar]
- 11.Corey-Bloom J, Anand R, Veach J, for the ENA 713 B352 Study Group A randomized trial evaluating the efficacy and safety of ENA 713 rivastigmine tartrate), a new acetylcholinesterase inhibitor, in patients with mild to moderately severe AD. Int J Geriatr Psychopharmacol. 1998;1:55–65. [Google Scholar]
- 12.Knapp MJ, Knopman DS, Solomon PR, Pendlebury WW, Davis CS, Gracon SI. A 30-week randomized controlled trial of high-dose tacrine in patients with AD. The Tacrine Study Group. JAMA. 1994;271:985–991. [PubMed] [Google Scholar]
- 13.Raskind MA, Peskind ER, Wessel T, Yuan W. Galantamine in AD: A 6-month randomized, placebo-controlled trial with a 6-month extension. The Galantamine USA-1 Study Group. Neurology. 2000;54:2261–2268. doi: 10.1212/wnl.54.12.2261. [DOI] [PubMed] [Google Scholar]
- 14.Rogers SL, Friedhoff LT, Apter JT, et al. The efficacy and safety of donepezil in patients with AD: results of a US multicentre, randomized, double-blind, placebo-controlled trial. Dementia. 1996;7:293–303. doi: 10.1159/000106895. [DOI] [PubMed] [Google Scholar]
- 15.Rosler M, Anand R, Cicin-Sain A, et al. Efficacy and safety of Rivastigmine in patients with AD: international randomized controlled trial. BMJ. 1999;318:633–638. doi: 10.1136/bmj.318.7184.633. [DOI] [PMC free article] [PubMed] [Google Scholar]
- 16.Knopman D, Schneider LS, Davis K, et al. Long-term tacrine (Cognex) treatment effects on nursing home placement and mortality. The Tacrine Study Group. Neurology. 1996;47:166–177. doi: 10.1212/wnl.47.1.166. [DOI] [PubMed] [Google Scholar]
- 17.Small GW, Donohue JA, Brooks RL. An economic evaluation of donepezil in the treatment of AD. Clin Ther. 1998;20:838–850. doi: 10.1016/s0149-2918(98)80145-8. [DOI] [PubMed] [Google Scholar]
- 18.Sano M, Ernesto C, Thomas RG, et al. A controlled trial of selegiline, alpha-tocopherol, or both as treatment for AD. N Engl J Med. 1997;336:1216–1222. doi: 10.1056/NEJM199704243361704. [DOI] [PubMed] [Google Scholar]
- 19.Coyle J, Kershaw P. Galantamine, a cholinesterase inhibitor that allosterically modulates nicotinic receptors: effects on the course of AD. Biol Psychiatry. 2001;49:289–299. doi: 10.1016/s0006-3223(00)01101-x. [DOI] [PubMed] [Google Scholar]
- 20.Morris JC, Cyrus PA, Orazem J, et al. Metrifonate benefits cognitive, behavioral, and global function in patients with AD. Neurology. 1998;50:1222–1230. doi: 10.1212/wnl.50.5.1222. [DOI] [PubMed] [Google Scholar]
- 21.Tariot P, Solomon P, Morris J, et al. the Galantamine Study Group A 5-month, randomized, placebo-conrtrolled trial of galantamine in AD. Neurology. 2000;54:2269–2276. doi: 10.1212/wnl.54.12.2269. [DOI] [PubMed] [Google Scholar]
- 22.Weiner MF, Martin-Cook K, Foster BM, Saine K, Fontaine CS, Svetlik DA. Effects of donepezil on emotional/behavioral symptoms in AD patients. J Clin Psychiatry. 2000;61:487–492. doi: 10.4088/jcp.v61n0705. [DOI] [PubMed] [Google Scholar]
- 23.Fago JP. Dementia: causes, evaluation, and management. Hosp Pract (Off Ed) 2001;36:59–69. doi: 10.1080/21548331.2001.11444083. [DOI] [PubMed] [Google Scholar]
- 24.Imbimbo BP, Verdelli G, Martelli P, Marchesini D. Two-year treatment of AD with eptastigmine. Dement Geriatr Cogn Disord. 1999;10:139–147. doi: 10.1159/000017114. [DOI] [PubMed] [Google Scholar]
- 25.Rogers SL, Friedhoff LT. Long-term efficacy and safety of donepezil in the treatment of AD: an interim analysis of the results of a US multicentre open label extension Study. Eur Neuropsychopharmacol. 1998;8:67–75. doi: 10.1016/s0924-977x(97)00079-5. [DOI] [PubMed] [Google Scholar]
- 26.Doody RS, Geldmacher DS, Gordon B, Perdomo CA, Pratt RD. Open-label, multicenter, phase 3 extension study of the safety and efficacy of donepezil in patients with Alzheimer disease. Donepezil Study Group. Arch Neurol. 2001;58:427–433. doi: 10.1001/archneur.58.3.427. [DOI] [PubMed] [Google Scholar]
- 27.Jonker C, Geerlings MI, Schmand B. Are memory complaints predictive for dementia? A review of clinical and population-based studies. Int J Geriatr Psychiatry. 2000;15:983–991. doi: 10.1002/1099-1166(200011)15:11<983::aid-gps238>3.0.co;2-5. [DOI] [PubMed] [Google Scholar]
- 28.Jorm AF, Butterworth P, Anstey KJ, et al. Memory complaints in a community sample aged 60-64 years: associations with cognitive functioning, psychiatric symptoms, medical conditions, APOE genotype, hippocampus and amygdala volumes, and white-matter hyperintensities. Psychol Med. 2004;34:1495–1506. doi: 10.1017/s0033291704003162. [DOI] [PubMed] [Google Scholar]
- 29.Sokoloff L, Reivich M, Kennedy C, DesRosiers MH, Patlak CS, Pettigrew KD, et al. The [14C]deoxyglucose method for the measurement of local cerebral glucose utilization: Theory, procedure and normal values in the conscious and anesthesized albino rat. J Neurochem. 1977;28:897–916. doi: 10.1111/j.1471-4159.1977.tb10649.x. [DOI] [PubMed] [Google Scholar]
- 30.Huang SC, Phelps ME, Hoffman EJ, Sideris K, Selin CJ, Kuhl DE. Noninvasive determination of local cerebral metabolic rate of glucose in man. Am J Physiol. 1980;238:E69–82. doi: 10.1152/ajpendo.1980.238.1.E69. [DOI] [PubMed] [Google Scholar]
- 31.Kuhl DE, Phelps ME, Kowell AP, Metter EJ, Selin C, Winter J. Effects of stroke on local cerebral metabolism and perfusion: mapping local metabolism and perfusion in normal and ischemic brain by emission computed tomography of 18FDG and 13NH3. Ann Neurol. 1980;8:47–60. doi: 10.1002/ana.410080108. [DOI] [PubMed] [Google Scholar]
- 32.Mazziotta JC, Phelps ME, Miller J, Kuhl DE. Tomographic mapping of human cerebral metabolism: normal unstimulated state. Neurology. 1981;31:503–516. doi: 10.1212/wnl.31.5.503. [DOI] [PubMed] [Google Scholar]
- 33.Phelps ME, Huang SC, Hoffman EJ, Selin C, Sokoloff L, Kuhl DE. Tomographic measurement of local cerebral glucose metabolic rate in humans with (F-18)2-fluoro-2-deoxyglucose: Validation of method. Ann Neurol. 1979;6:371–388. doi: 10.1002/ana.410060502. [DOI] [PubMed] [Google Scholar]
- 34.Reivich N, Kuhl D, Wolf A, Greenberg J, Phelps M, Ido T, et al. The [18F]fluorodeoxyglucose method for the measurement of local cerebral glucose utilization in man. Circ Res. 1979;44:127–137. doi: 10.1161/01.res.44.1.127. [DOI] [PubMed] [Google Scholar]
- 35.Moeller JR, Ishikawa T, Dhawan V, Spetsieris P, Mandel F, Alexander GE, et al. The metabolic topography of normal aging. J Cereb Blood Flow Metab. 1996;16:385–398. doi: 10.1097/00004647-199605000-00005. [DOI] [PubMed] [Google Scholar]
- 36.Ishii K, Sakamoto S, Sasaki M, Kitagaki H, Yamaji S, Hashimoto M, et al. Cerebral glucose metabolism in patients with frontotemporal dementia. J Nucl Med. 1998;39:1875–1878. [PubMed] [Google Scholar]
- 37.Schultz SK, O'Leary DS, Boles Ponto LL, Watkins GL, Hichwa RD, Andreasen NC. Age-related changes in regional cerebral blood flow among young to mid-life adults. Neuroreport. 1999;10:2493–6. doi: 10.1097/00001756-199908200-00011. [DOI] [PubMed] [Google Scholar]
- 38.Meltzer CC, Cantwell MN, Greer PJ, Ben-Eliezer D, Smith G, Frank G, et al. Does cerebral blood flow decline in healthy aging? A PET study with partial-volume correction. J Nucl Med. 2000;41:1842–8. [PubMed] [Google Scholar]
- 39.Mazziotta JC, Phelps ME. Positron emission tomography studies of the brain. In: Phelps M, Mazziotta J, Schelbert H, editors. Positron Emission Tomography and Autoradiography: Principles and Applications for the Brain and Heart. New York: Raven Press; 1986. pp. 493–579. [Google Scholar]
- 40.Apostolova LG, Dinov ID, Zoumalan C, Steiner CA, Siu E, Toga AW, Cummings JL, Small GW, Thompson PM, Phelps ME, Silverman DH. MR-Guided 3D PET Mapping of Longitudinal Changes in Regional Cerebral Metabolism of Normal Subjects. International Conference on Alzheimer's Disease (ICAD2006); Madrid. 2006. abstr. [Google Scholar]
- 41.Silverman DHS, Small GW, Chang CY, Lu CS, Kung De Aburto MA, Chen W, et al. Positron emission tomography in evaluation of dementia: regional brain metabolism and long-term outcome. JAMA. 2001;286:2120–2127. doi: 10.1001/jama.286.17.2120. [DOI] [PubMed] [Google Scholar]
- 42.Herholz K, Nordberg A, Salmon E, Perani D, Kessler J, Mielke R, et al. Impairment of neocortical metabolism predicts progression in Alzheimer's disease. Dement Geriatr Cogn Disord. 1999;10:494–504. doi: 10.1159/000017196. [DOI] [PubMed] [Google Scholar]
- 43.Minoshima S, Giordani B, Berent S, Frey K, Foster NL, Kuhl DE. Metabolic reduction in the posterior cingulate cortex in very early Alzheimer's disease. Ann Neurol. 1997;42:85–94. doi: 10.1002/ana.410420114. [DOI] [PubMed] [Google Scholar]
- 44.Silverman DHS. Brain 18F-FDG PET in the diagnosis of neurodegenerative dementias: comparison with perfusion SPECT and with clinical evaluations lacking nuclear imaging. J Nucl Med. 2004;45:594–607. [PubMed] [Google Scholar]
- 45.Silverman DHS, Truong CT, Kim SK, Chang CY, Chen W, Kowell AP, et al. Prognostic value of regional cerebral metabolism in patients undergoing dementia evaluation: comparison to a quantifying parameter of subsequent cognitive performance and to prognostic assessment without PET. Mol Genet Metab. 2003;80:350–355. doi: 10.1016/S1096-7192(03)00139-2. [DOI] [PubMed] [Google Scholar]
- 46.Small GW, Ercoli LM, Silverman DH, Huang SC, Komo S, Bookheimer SY, et al. Cerebral metabolic and cognitive decline in persons at genetic risk for Alzheimer's disease. Proc Natl Acad Sci U S A. 2000;97:6037–42. doi: 10.1073/pnas.090106797. [DOI] [PMC free article] [PubMed] [Google Scholar]
- 47.Bench CJ, Friston KJ, Brown RG, Frackowiak RSJ, Dolan RJ. Regional cerebral blood flow in depression measured by positron emission tomography: the relationship with clinical dimensions. Psychol Med. 1993;23:579–90. doi: 10.1017/s0033291700025368. [DOI] [PubMed] [Google Scholar]
- 48.Petersen RC, Doody R, Kurz A, Mohs RC, Morris JC, Rabins PV, et al. Current concepts in mild cognitive impairment. Arch Neurol. 2001;58:1985–1992. doi: 10.1001/archneur.58.12.1985. [DOI] [PubMed] [Google Scholar]
- 49.de Leon MJ, Convit A, Wolf OT, Tarshish CY, De Santi S, Rusinek H, et al. Prediction of cognitive decline in normal elderly subjects with 2-[18F]fluoro-2-deoxy-D-glucose/positron-emission tomography (FDG/PET) Proc Natl Acad Sci USA. 2001;98:10966–10971. doi: 10.1073/pnas.191044198. [DOI] [PMC free article] [PubMed] [Google Scholar]
- 50.Jack CR, Peterson RC, Xu Y, O'Brien PC, Smith GE, Ivnik RJ. Rates of hippocampal atrophy correlate with change in clinical status in aging and AD. Neurol. 2000;55:484–489. doi: 10.1212/wnl.55.4.484. [DOI] [PMC free article] [PubMed] [Google Scholar]
- 51.Rusinek H, De Santi S, Frid D, Tsui W, Tarshish C, Convit A, et al. Regional brain atrophy rate predicts future cognitive decline: 6-year longitudinal MR imaging study of normal aging. Radiology. 2003;229:691–696. doi: 10.1148/radiol.2293021299. [DOI] [PubMed] [Google Scholar]
- 52.Jack CR, Jr, Shiung MM, Gunter JL, O'Brien PC, Weigand SD, Knopman DS, et al. Comparison of different MRI brain atrophy rate measures with clinical disease progression in AD. Neurol. 2004;62:591–600. doi: 10.1212/01.wnl.0000110315.26026.ef. [DOI] [PMC free article] [PubMed] [Google Scholar]
- 53.den Heijer T, Geerlings MI, Hoebeek FE, Hofman A, Koudstaal PJ, Breteler M. Use of hippocampal and amygdala volumes on magnetic resonance imaging to predict dementia in cognitively intact elderly people. Arch Gen Psychiat. 2006;63(1):57–62. doi: 10.1001/archpsyc.63.1.57. [DOI] [PubMed] [Google Scholar]
- 54.De Santi S, de Leon MJ, Rusinek H, Convit A, Tarshish CY, Boppana M, et al. Hippocampal formation glucose metabolism and volume losses in MCI and AD. Neurobiology of Aging. 2001;22:529–539. doi: 10.1016/s0197-4580(01)00230-5. [DOI] [PubMed] [Google Scholar]
- 55.Mosconi L, Tsui WH, De Santi S, Rusinek H, Li J, Convit A, et al. Reduced Hippocampal metabolism in Mild Cognitive Impairment and Alzheimer's disease: automated FDG-PET Image Analysis. Neurol. 2005;64:1860–1867. doi: 10.1212/01.WNL.0000163856.13524.08. [DOI] [PubMed] [Google Scholar]
- 56.Ibanez V, Pietrini P, Alexander GE, Furey ML, Teichberg D, Rajapakse JC, et al. Regional gluose metabolic abnormalities are not the result of atrophy in Alzheimer's disease. Neurol. 1999;50:1585–1593. doi: 10.1212/wnl.50.6.1585. [DOI] [PubMed] [Google Scholar]
- 57.Nestor PJ, Fryer TD, Smielewski P, Hodges JR. Limbic hypometabolism in Alzheimer's disease and mild cognitive impairment. Ann Neurol. 2003;54(3):343–351. doi: 10.1002/ana.10669. [DOI] [PubMed] [Google Scholar]
- 58.Mosconi L, De Santi S, Li Y, Li J, Zhan J, Tsui WH, et al. Visual rating of medial temporal lobe metabolism in mild cognitive impairment and Alzheimer's disease using FDG-PET. European J Nucl Med. 2006;33:210–221. doi: 10.1007/s00259-005-1956-z. [DOI] [PubMed] [Google Scholar]
- 59.Chetelat G, Desgranges B, de la Sayette V, Viader F, Eustache F, Baron JC. Mild cognitive impairment: Can FDG-PET predict who is to rapidly convert to Alzheimer's disease? Neurology. 2003;60:1374–7. doi: 10.1212/01.wnl.0000055847.17752.e6. [DOI] [PubMed] [Google Scholar]
- 60.Drzezga A, Lautenschlager N, Siebner H, et al. Cerebral metabolic changes accompanying conversion of mild cognitive impairment into Alzheimer's disease: A PET follow-up study. Eur J Nucl Med Mol Imaging. 2003;30:1104–1113. doi: 10.1007/s00259-003-1194-1. [DOI] [PubMed] [Google Scholar]
- 61.Arnaiz E, Jelic V, Almkvist O, et al. Impaired cerebral glucose metabolism and cognitive functioning predict deterioration in mild cognitive impairment. Neuroreport. 2001;12:851–5. doi: 10.1097/00001756-200103260-00045. [DOI] [PubMed] [Google Scholar]
- 62.Drzezga A, Grimmer T, Riemenschneider M, et al. Prediction of individual clinical outcome in MCI by means of genetic assessment and (18)F-FDG PET. J Nucl Med. 2005;46:1625–1632. 2005. [PubMed] [Google Scholar]
- 63.Anchisi D, Borroni B, Franceschi M, Kerrouche N, Kalbe E, Beuthien-Beumann B, et al. Heterogeneity of brain glucose metaboism in mild cognitive impairment and clinical progression to Alzheimer disease. Archives of Neurol. 2005;62:1728–1733. doi: 10.1001/archneur.62.11.1728. [DOI] [PubMed] [Google Scholar]
- 64.Evans DA, Beckett LA, Field TS, Feng L, Albert MS, Bennett DA, et al. Apolipoprotein E epsilon-4 and incidence of Alzheimer disease in a community population of older persons. JAMA. 1997;277:822–4. [PubMed] [Google Scholar]
- 65.Small GW, Mazziotta JC, Collins MT, Baxter LR, Phelps ME, Mandelkern MA, et al. Apolipoprotein E type 4 allele and cerebral glucose metabolism in relatives at risk for familial Alzheimer disease. JAMA. 1995;273:942–947. [PubMed] [Google Scholar]
- 66.Reiman EM, Caselli RJ, Yun LS, Chen K, Bandy D, Minoshima S, et al. Preclinical evidence of Alzheimer's disease in persons homozygous for the E4 allele for apolipoprotein E. New Eng J Med. 1996;334:752–758. doi: 10.1056/NEJM199603213341202. [DOI] [PubMed] [Google Scholar]
- 67.Reiman EM, Chen K, Alexander GE, Caselli RJ, Bandy D, Osborne D, et al. Functional brain abnormalities in young adults at genetic risk for late-onset Alzheimer's dementia. Proc Natl Acad Sci U S A. 2004;101:284–289. doi: 10.1073/pnas.2635903100. [DOI] [PMC free article] [PubMed] [Google Scholar]
- 68.Silverman DHS, Hussain SA, Ercoli LM, Huang SC, Czernin J, Phelps ME, Small GW. Detection of differences in regional cerebral metabolism associated with genotypic and educational risk factors for dementia. Proceedings of the International Conference on Mathematics and Engineering Techniques in Medicine and Biological Sciences; Las Vegas. 2000. pp. 422–7. [Google Scholar]
- 69.Benson DF, Kuhl DE, Phelps ME, Cummings JL, Tsai SY. Positron emission computed tomography in the diagnosis of dementia. Trans Am Neurol Assoc. 1981;106:68–71. [PubMed] [Google Scholar]
- 70.Farkas T, Ferris SH, Wolf AP, De Leon MJ, Christman DR, Reisberg B, et al. 18F-2-deoxy-2-fluoro-D-glucose as a tracer in the positron emission tomographic study of senile dementia. Am J Psychiatry. 1982;139:352–3. doi: 10.1176/ajp.139.3.352. [DOI] [PubMed] [Google Scholar]
- 71.Foster NL, Chase TN, Fedio P, Patronas NJ, Brooks RA, Di Chiro G. Alzheimer's disease: focal cortical changes shown by positron emission tomography. Neurology. 1983;33:961–5. doi: 10.1212/wnl.33.8.961. [DOI] [PubMed] [Google Scholar]
- 72.Frackowiak RS, Pozzilli C, Legg NJ, Du Boulay GH, Marshall J, Lenzi GL, Jones T. Regional cerebral oxygen supply and utilization in dementia. A clinical and physiological study with oxygen-15 and positron tomography. Brain. 1981;104:753–78. doi: 10.1093/brain/104.4.753. [DOI] [PubMed] [Google Scholar]
- 73.Devous MD., Sr Functional brain imaging in the dementias: role in early detection, differential diagnosis, and longitudinal studies. Eur J Nucl Med Mol Imaging. 2002;29:1685–96. doi: 10.1007/s00259-002-0967-2. [DOI] [PubMed] [Google Scholar]
- 74.Small GW, Bookheimer SY, Thompson PM, Cole GM, Huang SC, Kepe V, Barrio JR. Current and future uses of neuroimaging for cognitively impaired patients. Lancet Neurol. 2008:161–172. doi: 10.1016/S1474-4422(08)70019-X. &. [DOI] [PMC free article] [PubMed] [Google Scholar]
- 75.Silverman DHS, Alavi A. PET imaging in the assessment of normal and impaired cognitive function. Radiol Clin N Am. 2005;43:67–77. doi: 10.1016/j.rcl.2004.09.012. [DOI] [PubMed] [Google Scholar]
- 76.Silverman DHS, Small GW, Phelps ME. Clinical value of neuroimaging in the diagnosis of dementia: sensitivity and specificity of regional cerebral metabolic and other parameters for early identification of AD. Clin Positron Imaging. 1999;2:119–130. doi: 10.1016/s1095-0397(99)00020-5. [DOI] [PubMed] [Google Scholar]
- 77.Mielke R, Schroder R, Fink GR, Kessler J, Herholz K, Heiss WD. Regional cerebral glucose metabolism and postmortem pathology in AD. Acta Neuropathol (Berl) 1996;91:174–179. doi: 10.1007/s004010050410. [DOI] [PubMed] [Google Scholar]
- 78.Salmon E, Sadzot B, Maquet P, Degueldre C, Lemaire C, Rigo P, et al. Differential diagnosis of Alzheimer's disease with PET. J Nucl Med. 1994;35:391–8. [PubMed] [Google Scholar]
- 79.Tedeschi E, Hasselbalch SG, Waldemar G, Juhler M, Hogh P, Holm S, et al. Heterogeneous cerebral glucose metabolism in normal pressure hydrocephalus. J Neurol Neurosurg Psychiatry. 1995;59:608–15. doi: 10.1136/jnnp.59.6.608. [DOI] [PMC free article] [PubMed] [Google Scholar]
- 80.Hoffman JM, Welsh-Bohmer KA, Hanson M, Brain B, Hulette C, Earl N, Coleman RE. FDG PET imaging in patients with pathologically verified dementia. J Nucl Med. 2000;41:1920–1928. [PubMed] [Google Scholar]
- 81.Gambhir SS, Czernin J, Schwimmer J, Silverman DHS, Coleman RE, Phelps ME. A tabulated summary of the FDG PET literature. J Nucl Med. 2001;42(5 Suppl):1S–93S. [PubMed] [Google Scholar]
- 82.Knopman DS, DeKosky ST, Cummings JL, Chui H, Corey-Bloom J, Relkin N, et al. Practice parameter: diagnosis of dementia (an evidence-based review). Report of the Quality Standards Subcommittee of the American Academy of Neurology. Neurology. 2001;56:1143–53. doi: 10.1212/wnl.56.9.1143. [DOI] [PubMed] [Google Scholar]
- 83.Ackerman RH, Correia JA, Alpert NM, Baron JC, Gouliamos A, Grotta JC, et al. Positron imaging in ischemic stroke disease using compounds labeled with oxygen-15. Initial results of clinicophysiologic correlations. Arch Neurol. 1981;38:537–43. doi: 10.1001/archneur.1981.00510090031002. [DOI] [PubMed] [Google Scholar]
- 84.Baron JC, Bousser MG, Rey A, Guillard A, Comar D, Castaigne P. Reversal of focal “misery-perfusion syndrome” by extra-intracranial arterial bypass in hemodynamic cerebral ischemia: A case study with 15O positron tomography. Stroke. 1981;12:454–9. doi: 10.1161/01.str.12.4.454. [DOI] [PubMed] [Google Scholar]
- 85.Grubb RL, Jr, Derdeyn CP, Fritsch SM, Carpenter DA, Yundt KD, Videen TO, et al. Importance of hemodynamic factors in the prognosis of symptomatic carotid occlusion. JAMA. 1998;280:1055–60. doi: 10.1001/jama.280.12.1055. [DOI] [PubMed] [Google Scholar]
- 86.Yamauchi H, Fukuyama H, Nagahama Y, Nabatame H, Ueno M, Nishizawa S, et al. Significance of increased oxygen extraction fraction in five-year prognosis of major cerebral arterial occlusive diseases. J Nucl Med. 1999;40:1992–8. [PubMed] [Google Scholar]
- 87.Heiss WD, Grond M, Thiel A, von Stockhausen HM, Rudolf J, Ghaemi M, et al. Tissue at risk of infarction rescued by early reperfusion: A positron emission tomography study in systemic recombinant tissue plasminogen activator thrombolysis of acute stroke. J Cereb Blood Flow Metab. 1998;18:1298–307. doi: 10.1097/00004647-199812000-00004. [DOI] [PubMed] [Google Scholar]
- 88.Marchal G, Benali K, Iglesias S, Viader F, Derlon JM, Baron JC. Voxel-based mapping of irreversible ischaemic damage with PET in acute stroke. Brain. 1999;122:2387–400. doi: 10.1093/brain/122.12.2387. [DOI] [PubMed] [Google Scholar]
- 89.Nemoto EM, Yonas H, Pindzola RR, Kuwabara H, Sashin D, Chang Y, Jovin T. PET OEF reactivity for hemodynamic compromise in occlusive vascular disease. J Neuroimaging. 2007;17:54–60. doi: 10.1111/j.1552-6569.2006.00080.x. [DOI] [PubMed] [Google Scholar]
- 90.Endo H, Inoue T, Ogasawara K, Fukuda T, Kanbara Y, Ogawa A. Quantitative assessment of cerebral hemodynamics using perfusion-weighted MRI in patients with major cerebral artery occlusive disease: comparison with positron emission tomography. Stroke. 2006;37:388–9. doi: 10.1161/01.STR.0000199030.37274.88. [DOI] [PubMed] [Google Scholar]
- 91.Takasawa M, Jones PS, Guadagno JV, Christensen S, Fryer TD, et al. How Reliable Is Perfusion MR in Acute Stroke?. Validation and Determination of the Penumbra Threshold Against Quantitative PET. Stroke. 2008 doi: 10.1161/STROKEAHA.107.500090. E-pub Feb 7. [DOI] [PubMed] [Google Scholar]
- 92.Price JL, Morris JC. Tangles and plaques in nondemented aging and “preclinical” Alzheimer's disease. Ann Neurol. 1999;45:358–68. doi: 10.1002/1531-8249(199903)45:3<358::aid-ana12>3.0.co;2-x. [DOI] [PubMed] [Google Scholar]
- 93.Shoghi-Jadid K, Small GW, Agdeppa ED, et al. Localization of neurofibrillary tangles and beta-amyloid plaques in the brains of living patients with Alzheimer's disease. Am J Geriatr Psychiatry. 2002;10:24–35. [PubMed] [Google Scholar]
- 94.Klunk WE, Engler H, Nordberg A, et al. Imaging brain amyloid in Alzheimer's disease with Pittsburgh Compound-B. Ann Neurol. 2004;55:306–319. doi: 10.1002/ana.20009. [DOI] [PubMed] [Google Scholar]
- 95.Small GW, Kepe V, Ercoli L, et al. PET of brain amyloid and tau in mild cognitive impairment. N Engl J Med. 2006;355:2652–2663. doi: 10.1056/NEJMoa054625. [DOI] [PubMed] [Google Scholar]
- 96.Kemppainen NM, Aalto S, Wilson IA, et al. PET amyloid ligand [11C]PIB uptake is increased in mild cognitive impairment. Neurol. 2007;68:1603–1606. doi: 10.1212/01.wnl.0000260969.94695.56. [DOI] [PubMed] [Google Scholar]
- 97.Kepe V, Barrio JR, Huang SC, et al. Serotonin 1A receptors in the living brain of Alzheimer's disease patients. Proc Natl Acad Sci U S A. 2006;103:702–707. doi: 10.1073/pnas.0510237103. [DOI] [PMC free article] [PubMed] [Google Scholar]
- 98.Petersen RC, Smith GE, Waring SC, Ivnik RJ, Tangalos EG, Kokmen E. Mild cognitive impairment: clinical characterization and outcome. Arch Neurol. 1999;56:303–308. doi: 10.1001/archneur.56.3.303. [DOI] [PubMed] [Google Scholar]
- 99.Alexander GE, Chen K, Pietrini P, Rapoport SI, Reiman EM. Longitudinal PET Evaluation of Cerebral Metabolic Decline in Dementia: A Potential Outcome Measure in Alzheimer's Disease Treatment Studies. Am J Psychiatry. 2002;159:738–745. doi: 10.1176/appi.ajp.159.5.738. [DOI] [PubMed] [Google Scholar]
- 100.Reiman EM, Caselli RJ, Chen K, Alexander GE, Bandy D, Frost J. Declining brain activity in cognitively normal apolipoprotein E epsilon 4 heterozygotes: A foundation for using positron emission tomography to efficiently test treatments to prevent Alzheimer's disease. Proceedings of the National Academy of Sciences of the United States of America. 2001;98:3334–3339. doi: 10.1073/pnas.061509598. [DOI] [PMC free article] [PubMed] [Google Scholar]
- 101.Small GW, Silverman DHS, Siddarth P, Ercoli LM, Miller KJ, et al. Effects of a 14-day healthy aging lifestyle program on cognition and brain function. Am J Geriatr Psychiatr. 2006;14:538–545. doi: 10.1097/01.JGP.0000219279.72210.ca. [DOI] [PubMed] [Google Scholar]