

Abstract
Single cell investigations have enabled unexpected discoveries, such as the existence of biological noise and phenotypic switching in infection, metabolism and treatment. Herein, we review methods that enable such single cell investigations specific to metabolism and bioenergetics. Firstly, we discuss how to isolate and immobilize individuals from a cell suspension, including both permanent and reversible approaches. We also highlight specific advances in microbiology for its implications in metabolic engineering. Methods for probing single cell physiology and metabolism are subsequently reviewed. The primary focus therein is on dynamic and high-content profiling strategies based on label-free and fluorescence microspectroscopy and microscopy. Non-dynamic approaches, such as mass spectrometry and nuclear magnetic resonance, are also briefly discussed.
Keywords: Single cell analysis, Metabolism, Bioenergetics, Microfluidics, Microscopy
1. Introduction
Understanding metabolism and energy flow through cells has recently generated considerable interest. This is due to implications in metabolic engineering and the use of microbes as factories for the production of chemical compounds. Exploratory or optimization investigations to this end commonly take place within the widely available flasks and Petri dishes, as well as dedicated bioreactors (Fig. 1a and b). In these, many cells (>1011) are simultaneously stimulated and their output is collectively analyzed.
Fig. 1. From many down to the single cell.

(a) An industrial scale fermenter with an approximate height of a few meters (credit U.S. Department of Energy). (b) A bioreactor growing algae; the vertical dimension of the instrument is a few cm containing approximately 1012 cells (credit U.S. Department of Energy). (c) A budding Yarrowia lipolytica yeast, with the daughter cell exhibiting an approximate 2 μm diameter. (c) Schematic representations of the 2D, 1D and 0D confinement types discussed in this review.
In population level studies, however, the performance of individuals is masked and stimuli gradients across the population are enforced due to the geometric boundary conditions of the growth microenvironment. Single cell methods need to be implemented to address these, as recently evidenced by the wide success of single cell genomic and proteomic approaches. Herein, we review methods for studying single cell physiology – specifically metabolism and bioenergetics – where cells are now treated as isolated biochemical factories, thus enabling the precise measurement of (a) their metabolic profile, (b) culture heterogeneity, as well as (c) the effect of the microenvironment.
Single-cell experiments offer the potential in gaining a unique insight in cell metabolism. It is however, important to note that care has to be taken when designing single cell experiments and interpreting results. In addition to the need for statistical significance, the differences between experimental conditions at the population-level and the micro-volume that contains an individual cell need to be considered. Such differences include population-level characteristics that are challenged by isolating an individual, such as cell-to-cell communication (e.g. via quorum sensing), spatiotemporal gradients of stimuli and the co-existence of cells in various growth stages.
The review is divided in two parts. In the first, we discuss methods for biomass manipulation down to the single cell level. This is a critical step, as the volume of a typical microbial cell (bacteria or yeast) is approximately 12 orders of magnitude smaller than common reactor volumes (~L). This is highlighted in Fig. 1a–c through the scale comparison between typical industrial and laboratory scale reactors with that of an individual Yarrowia lipolytica yeast cell. Thus, the study of single cells necessitates appropriate sampling and manipulation to address this considerable volume mismatch. This can be achieved via multiple strategies, both stochastic (e.g. serial dilutions) and deterministic (e.g. micromanipulators).
In the second part of the review, we discuss methods for probing the metabolism and bioenergetics of single cells. Areas such as single cell mass-spectrometry, bioimaging, optical sensing and spectroscopy are covered. The applications of such methods, such as strain selection, profiling intracellular metabolites, and dynamic metabolic mapping (e.g. respiration monitoring), will also be discussed for each individual technique.
2. Single cell manipulation
The sampling and manipulation of cells down to the individual has been of substantial interest since the very beginning of Life Sciences. One of the first recorded single cell study involved the use of a micropipette to place a single Erwinia amylovora cell on an apple blossom and study its infectivity (Hildebrand, 1937). This technique – with minor modifications – served with great success early physiology, (Mortimer and Johnston, 1959) genetics (Zelle, 1951) and microbiology (Hildebrand, 1950) studies. Since then, a significantly wider variety of methods has emerged. These are primarily based on modern micro- and nanotechnologies involving advanced fabrication, materials and chemical functionalization methods.
Herein, our objective is to highlight the most recent developments in single cell manipulation, as well as pioneering ones; it is also worth noting that excellent reviews exist on similar topics (Andersson and van den Berg, 2003; Brehm-Stecher and Johnson, 2004; Nilsson et al., 2009; Schmid et al., 2010; Lecault et al., 2012; Zenobi, 2013; Huang et al., 2014; Grünberger et al., 2014; Avesar et al., 2014; Mu et al., 2013; Bennett and Hasty, 2009). First, flow-through methods will be discussed, namely: methods in which single cells flow continuously in an ordered manner during their analysis. This section will be followed by confinement techniques that enable cell isolation and confinement in zero-, one, or two-dimensions (Fig. 1d) (Grünberger et al., 2014). Such confinement techniques can be further divided into permanent and reversible or dynamic ones and can be based on both chemical and physical approaches. The section will conclude with a comparison between these approaches.
A critical aspect of both flow-through and confinement strategies is the enabling fabrication method, which in the majority of examples is based on Soft Lithography. The latter will not be discussed in detail in the present review and the potentially interested reader is referred to recent excellent recent reviews on the topic (Xia and Whitesides, 1998; Quake and Scherer, 2000; Weibel et al., 2007).
2.1. Flow-through methods
Flow cytometry and droplet microfluidics are the two most common methods of flow-through analysis. While both are high-throughput techniques (Hong et al., 2009), their difference is that the droplet encapsulated cells experience a restricted and personal microenvironment, while in flow cytometry cells experience similar nutrient and stimuli initial concentrations. These methods are well established and they have recently enabled immense strides in single cell phenotypic analysis, namely the identification and analysis of metabolically distinct individuals from an isogenic population using both droplet microfluidics (Wang et al., 2014) and flow cytometry (van Heerden et al., 2014).
2.1.1. Flow cytometry
Similar to its first ever designs (Croslandtaylor, 1953; Kamentsk et al., 1965), most modern flow cytometers contain a nozzle and a flow chamber. These, through the principle of hydrodynamic focusing, guide individual cells to flow sequentially through a microanalysis location, mostly optical (i.e. fluorescence or light scattering) or mass spectrometry based. In this way, high content screening at the single cell level can be achieved at rates as high as 104 cells/s (Fig. 2a) (Shapiro, 2003; Taylor, 2007). In minor modifications, the cells can also be sorted depending on their fluorescent (or other) properties, thus forming the so-called Fluorescence Activated Cell Sorters (FACS).
Fig. 2. Flow-through single cell analysis.

(a) The schematic of a conventional single cell flow cytometer is illustrated (Reprinted by permission from Macmillan Publishers Ltd.: Nature Reviews Microbiology (Barnett et al., 2008), Copyright (2008). (b) Loading of single cells in droplets at a microfluidic T-junction; the black arrows point to the individual cell in the droplet (reproduced from Pan et al. (2011) with permission from The Royal Society of Chemistry). (c) Single hybridoma cell encapsulation in arrested droplets (reprinted by permission from Macmillan Publishers Ltd.: Nature Protocols (Mazutis et al., 2013), Copyright (2013).
Flow cytometers are widespread and accessible instruments, with applications ranging from the most early studies on biological noise (stochasticity) (Ozbudak et al., 2002; Blake et al., 2003; Newman et al., 2006), to more recent investigations in metabolic engineering (Tracy et al., 2010). Additionally, research and development on cytometers is still an active research field, with recent advances in instrument miniaturization and the introduction of novel types of cell interrogation. Microfabricated cytometers (microcytometers) emerged with the advent of microfluidics (Fu et al., 1999), aiming primarily at reducing capital investment requirements (Huh et al., 2005). Another advantage of scaling down cytometers is the ability to integrate more complex functionality, such as more efficient cell transport and sorting (Schrum et al., 1999), as well as more efficient single cell analysis (Wolff et al., 2003).
Regarding the available types of interrogation, most conventional cytometers analyze and sort cells based on their fluorescent and light-scattering properties. More recently, especially in microcytometers, the use of dielectric (Gawad et al., 2004) or Raman (Lau et al., 2008) spectroscopies, as well as the measurement of cell capacitance (Sohn et al., 2000), impedance (Shaker et al., 2014) and mechanical properties (Zheng et al., 2013) have emerged. Highly-multiplexed single cell analysis using flow cytometers recently became available through the ‘mass cytometry’ based on inductively coupled plasma (ICP) mass spectrometry (Bendall et al., 2011).
2.1.2. Droplet microfluidics
Droplet microfluidics (including digital microfluidics) is essentially a two-phase fluidic microsystem formed via the interaction of two immiscible fluids, specifically by shearing one into the other (Thorsen et al., 2001; Garstecki et al., 2006; Teh et al., 2008). Droplets in microfluidics offer several distinct advantages, forming thus an ideal assay platform for screening or other purposes (Wang et al., 2014). These advantages include the generation of highly mono-disperse (Nisisako et al., 2002) and size-variable microreactors (Tice et al., 2003), which can additionally be transported in a dilution free and zero cross-contamination manner (H. Song et al., 2006). More recently, techniques for accurate mixing of pL volumes using droplets have been reported (Song and Ismagilov, 2003; Niu et al., 2011; Kintses et al., 2010).
A wide variety of methods to encapsulate single-cells into individual droplets also exist (Fig. 2a and b) (He et al., 2005; Edd et al., 2008; Koester et al., 2008; Huebner et al., 2007), including droplets made of hydrogels such as agarose (Eun et al., 2011). Thus, the aforementioned compartmentalization-driven advantages of droplets can translate into unique features in investigating single cell physiology (Guo et al., 2012; Mazutis et al., 2013), and genomic content (Leung et al., 2012; Novak et al., 2011; Zeng et al., 2010). The first is that cell-secreted molecules remain confined within the volume of the droplet, and thus can rapidly reach detectable concentrations (Wang et al., 2014; Baret et al., 2009; Aharoni et al., 2005). The second advantage is the ability to rapidly mix minute (pL) volumes of reagents, hence enabling reduced reagent consumption (Brouzes et al., 2009), as well as the high-precision timing of reaction kinetics. The latter was recently demonstrated by identifying mutants producing enzymes with improved productivity and activity (Agresti et al., 2010).
One disadvantage of droplet based single cell analysis compared to conventional flow cytometry is the stochastic nature of encapsulating cells in droplets, which may reduce cell throughput (Lagus and Edd, 2013). On the other hand, single cell confinement in microdroplets allows for identification of cells with superior properties of secreting a product metabolite and identifying genetic elements that are responsible for an elevated production phenotype of secreted products (Wang et al., 2014). No other methods are available to identify such super-producing cells.
2.2. Permanent confinement
Permanent confinement methods enable the irreversible and non-dynamic positioning of an individual cell or of a population of single cells. This, generally, can be achieved via chemical or physical potentials (or barriers) that forbid cell motion in all, or in specific directions. Depending on the type of confinement, the cell position may fluctuate within controlled multicellular or subcellular distances (i.e. a few μm’s down to a few nm) in one-, two- or even three dimensions (Fig. 1). Such methods will be reviewed in this section and classified depending on their confinement size and dimensionality.
2.2.1. 3D microcavities
In this embodiment, a micron-scale topographic cavity – or an array of cavities – is engraved on a surface, thus confining isolated cells in that microenvironment, however, without generally restricting their motion. Microwells and microchemostats belong to this category, offering confinement levels of generally cellular resolution.
2.2.1.1. Microwells
A type of microcavity is a lithographically defined microwell (Fig. 3a) (Charnley et al., 2009). In these, a cell suspension is introduced over the microwell array, and cell loading in the microwells commonly occurs by sedimentation (gravity) (Parce et al., 1989). Single cell immobilization is ensured by employing appropriate seeding cell concentration, seeding time and microwell dimensions (Rettig and Folch, 2005; Sasuga et al., 2008) (Fig. 3b). It is worth noting that this type of cell confinement is very common as it is compatible with a wide range of microfabrication and functionalization techniques, as well as types of materials, including SiO2 (Deutsch et al., 2006), poly (ethylene glycol) (Lutolf et al., 2009), PDMS (Lecault et al., 2011), (including functionalized PDMS (Ochsner et al., 2007)), functionalized hydrogels (Gobaa et al., 2011), the photoresist SU8 (Zurgil et al., 2014), and solid agarose (Wood et al., 2010). Up to 3600 cell traps have been reported using microwells (Ryley and Pereira-Smith, 2006).
Fig. 3. Confinement in 3D microcavities.

(a) A schematic of the fabrication and seeding of PDMS microwell arrays. The procedure involves pouring and curing the prepolymer on to a patterned master and subsequently peeling off and placing the microwells in a Petri dish; finally, the cell suspension is introduced and allowed to sediment onto the microwells and excess cells from the top surface are rinsed (reprinted from Rettig and Folch (2005); Copyright (2005) American Chemical Society). (b) An SEM image of single trapped Jurkat T cells in an array of cell retainers etched in SiO2; scale bar is 20 μm (reproduced from Deutsch et al. (2006) with permission from The Royal Society of Chemistry). (c) Mammalian cells trapped in microwell arrays at the bottom of a microfluidic channel; the microwells are the circular structures and the microfluidic channel walls are denoted by the straight lines (reproduced from Khademhosseini et al. (2004) with permission from The Royal Society of Chemistry).
2.2.1.2. Microchemostats
Microfabricated chemostats enable continuous and dynamic stimuli delivery and product removal from the microenvironment surrounding the confined cells (Balagadde et al., 2005; Liu et al., 2008). In one of the first of such demonstrations, Khademhosseini et al. (2004) reported an array of microwells impregnated at the bottom surface of a microfluidic channel. The array was able to trap populations of single mammalian cells simply by controlling the flow conditions (Fig. 3c). This architecture has recently evolved into microwell arrays separated by the microfluidic channels via hydrogel layers (Cosson and Lutolf, 2014). To enable handling of smaller and more motile cells, Groisman et al. (2005) developed an array of microchambers (~100 × 100 μm2) connected to apertures whose diameter was flow dependent. This enabled bacteria loading and at high flow-rates (large aperture), and subsequently trapping them at lower flow rates (smaller aperture). Similarly, ‘Lobster Traps’ were demonstrated in a crosslinkable bovine serum albumin (BSA) matrix; in these, – following cell seeding – the loading apertures permanently seal by raising the temperature and forcing the BSA matrix to expand (Connell et al., 2010).
2.2.2. Confinement in 2D
Single cell populations are most commonly studied in microsystems that enforce 2D confinement, namely allowing cell motion within a 2D plane. This is typically achieved through volume exclusion by geometrically minimizing the available space in the third dimension, thus ensuring the formation of a 2D cell monolayer. In one of the earliest reports of this type, Cookson et al. (2005) reported the Tesla microchemostat (TμC) by integrating large seeding microchannels with a 4 μm thick trapping region (Fig. 4a). This size mismatch enabled the stable trapping of many single cells of Saccharomyces cerevisiae within a single focal plane for more than 24 h (Fig. 4b). This basic architecture has found many applications in long-term bioimaging of both eukaryotic cells (Bennett et al., 2008; Lee et al., 2008), and bacteria (Ullman et al., 2013; Binder et al., 2014). More recently, Denervaud et al. (2013) reported a massively parallel array of microchemostats capable of confining 1152 individual cells. In this embodiment, a DNA spotter was used to array single cells on a surface and subsequently align them with individual chambers interconnected to media delivery microchannels.
Fig. 4. 2D and 1D confinement.

A zoomed-in view of the Tesla microchemostat (a), illustrating the ‘diode loop’ with the trapping (gray) and loading (black) regions; (b) the shallow trapping region of Tesla microchemostat is shown, where cells are confined in 2D; the scale bar is 20 μm (Cookson et al., 2005) (Copyright©2005 EMBO and Nature Publishing Group). (c) A bioreactor with a shallow circular 2D growth area placed inside a deeper supply channel; note the radially arranged channels that enable nutrient supply and waste removal (reproduced from Gruenberger et al. (2012) with permission from The Royal Society of Chemistry). (d) 1D bacterial growth in 1D patterned agarose (lower) in contrast to agarose pads were bacterial crowding takes place (upper); reproduced from Moffitt et al. (2012) with permission from The Royal Society of Chemistry.
Despite their simplicity, most 2D confinement architectures may suffer from significant build-up of chemical gradients of nutrients and waste throughout the cell monolayer; this may lead to significant phenotypic heterogeneity within the colony (Mather et al., 2010). More recent 2D confinement architectures have partially addressed this. In one approach, some level of environmental control was possible by including multiple inlet and outlet microchannels for the supply of nutrients and waste removal (Gruenberger et al., 2012) (Fig. 4c). It is worth noting that the effect of nutrient gradients on bacterial metabolism and chemotaxis has also been investigated in pore-scale microfluidic models, which elegantly simulate subsurface and bioremediation conditions (Long and Ford, 2009; Zhang et al., 2010; Vasdekis et al., 2014).
2.2.3. Confinement in 1D
In this embodiment, the cells are contained within a linear track, thereby placing strict boundary conditions for motion and proliferation in directions perpendicular to the track itself (Carlson et al., 1997) (Fig. 1d). This enables more straightforward tracking of both individual cells and their lineages in comparison to 2D or 3D growth, as illustrated in Fig. 4d. In the earliest report of this type, Balaban et al. (2004) grew Escherichia coli cells within grooves of dimensions similar to the width of the bacteria. The grooves were molded in PDMS and bonded to a membrane through which nutrients and stimuli were delivered to the cells.
Subsequent attempts aimed at facilitating cell loading and nutrient supply. Regarding the former, in one approach, the Weitz group integrated the tracks with indentations of sub-cellular dimensions (Rowat et al., 2009). This prevented the cells from flowing through, thus enforcing their trapping within the track. Upon loading, the hydrodynamic resistance of the apertures increased ensuring single cell occupancy. In a more multiplexed assay – the ‘mother machine’ – cell seeding took place by diffusion from much larger microchannels, thus infilling approximately 4000 growth tracks (Wang et al., 2010). Regarding nutrient supply, this has been optimized from the initial designs by employing agarose-made linear tracks instead of the more conventional PDMS (Moffitt et al., 2012). The inclusion of media carrying trenches next to the tracks (Norman et al., 2013), as well as the use of channels of an orthogonal – asymmetric – geometry have also been reported (Long et al., 2013). Advanced microfabrication techniques based on electron beam lithography allowing the fabrication of much narrower tracks have been recently reported, primarily for the 1D confinement of much smaller bacteria (Moolman et al., 2013).
2.2.4. Confinement in 0D
Under 0-D confinement the cells are strictly immobilized at a fixed location within only minor sub-cellular position fluctuations. Generally, there are two ways of achieving this: the more traditional approach involving gels and surface functionalization strategies, as well as more recent ones based on micro- or nanofabricated filter beds through which the cell suspension is flown. We will employ early microfluidic nomenclature of the latter strategy, namely percolation filtration (He et al., 1999; de Mello and Beard, 2003), in which the filter exhibits dimensions smaller than the cell in order to trap the targets under continuous flow-driven, shear pressure.
2.2.4.1. Axial percolation filtration (APF)
The cell suspension flows perpendicular to the filter bed in this embodiment. In one of the earliest reports of this type, Wheeler et al. (2003) integrated a microfluidic ‘T-junction’ with a micron-scale trap: a stagnation point develops at the center of the T-junction (Fig. 5a), which locally stabilizes the flow stream and cells gently land and stay in the dock. In a subsequent, pioneering report, Di Carlo et al. (2006) developed an array of hydrodynamic trapping structures with a U-shaped geometry (Fig. 5b). The U-shaped trapping site contains a narrow aperture smaller than the cell size, preventing it from flowing through and enforcing to reside within the trap. This basic design later evolved to enable the integration of the trap with a pneumatically isolated microchamber (Eyer et al., 2012), as well as trapping of individual bacteria (Vasdekis, 2013; M.-C. Kim et al., 2011), including architectures capable of removing the daughter cells (Probst et al., 2013b). Similarly, instead of the U-shaped geometry, monolithic PDMS pads have been recently reported (Fig. 5c). These also enable the selective trapping of mother and release of daughter cells, respectively (Huberts et al., 2013).
Fig. 5. 0D confinement.
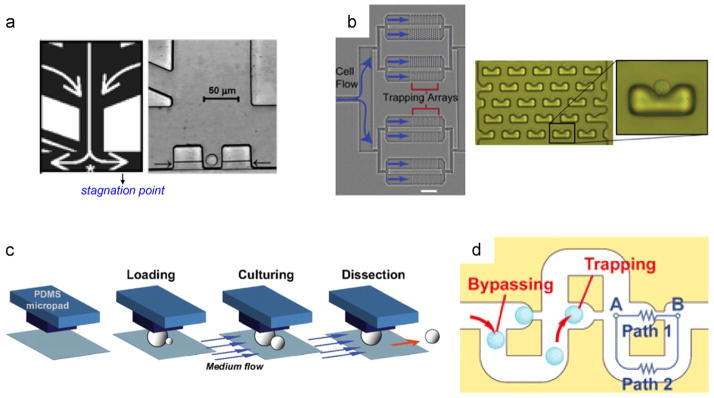
(a) Microfluidic single cell trapping (left), where cells are trapped at the stagnation point and kept there immobilized by flow driven hydrostatic pressure (denoted by white arrows). A bright field image of an individual trapped Jurkat T-cell (right); adapted from Wheeler et al. (2003); Copyright (2003) American Chemical Society. (b) A single cell trapping array is illustrated (left, scale bar is 500 μm); a higher resolution image of the trapping array (middle), along with an individual trapped cell (right); reproduced from Di Carlo et al. (2006) with permission from The Royal Society of Chemistry. (c) Monolithic PDMS pads for trapping yeast cells, while releasing the daughter cells under the continuous flow of media (adapted from Lee et al. (2012)). (d) A schematic diagram of a microfluidic ‘lateral percolation’ trap; the operation principle is based on the geometric relationship between paths 1 and 2. When the trap is empty, the resistance of path 1 is lower until a cell occupies, after which subsequent cells will follow the bypass loop (adapted from Tan and Takeuchi (2007)); Copyright (2007) National Academy of Sciences, USA).
2.2.4.2. Lateral percolation filtration (LPF)
In this approach, in essence an evolution from APF, the cell suspension flows parallel to the filter plane. LPF is generally based on the ‘basin-style’ design, where the trapping microstructures are aligned perpendicular to the flow direction (Fig. 5d). Sophisticated hydrodynamics enable a pressure gradient to build up between loading and trapping sites, forcing the cells to move into the traps. This pressure gradient is reversed once a cell is trapped, thus preventing secondary cells from entering the same trapping site. This was initially demonstrated by Tan and Takeuchi (2007) for microparticles, and later evolved into a high-throughput microarray of more than 2000 traps (Kobel et al., 2012; Bell et al., 2014), as well microsystems for co-culturing heterotypic cells (Hong et al., 2012). It is worth noting that both the APF and LPF confinement can be applied to immobilizing cells encapsulated within droplets, instead of cells by themselves (Schmitz et al., 2009; Khorshidi et al., 2014).
2.2.4.3. Hydrogel encapsulation
The encapsulation of living cells in hydrogels is a very traditional approach, with a wide range of available materials and gelation stimuli (agarose, gelatin, poly (ethylene glycol), alginate etc.) (Zelle, 1951). In one embodiment, the cells are deposited on a slide and the gel is placed on top and subsequently solidified (Young et al., 2012). Image analysis enables cell tracking over multiple generations, including the dynamic mapping of their gene regulatory networks and phenotype by imaging (Rosenfeld et al., 2005; Kaufmann et al., 2007). Alternatively, prior to gelation, the cell suspension may be mixed with a hydrogel solution – a very common immobilization technique for maintaining a 3D culture architecture in immune and regenerative medicine (Hunt and Grover, 2010; Hubbell, 1995).
While practical, hydrogel encapsulation suffers from two shortcomings: uncontrolled cell growth and the resulting challenge of single cell tracking (Fig. 4d), as well as limited nutrient and stimuli exchange over time. The latter has been recently addressed via the microfluidic integration of hydrogel encapsulated cells; in this way, small molecules present in the microfluidic solution surround and subsequently diffuse into the gel, thereby enabling a dynamic microenvironment chemical control. In such approaches, hydrogel gelation by UV light for integration inside microfluidic networks (Heo et al., 2003; Braschler et al., 2005; Falconnet et al., 2011), as well as solidified gels integrated vertically with microchannels, have been reported (Robert et al., 2010). Gelation in these methods may involve exposure to high temperatures or UV light (Kang et al., 2014), or the potentially safer ion-based crosslinking (Kang et al., 2014).
2.2.4.4. Surface–cell interactions
Cell–surface interactions still receive substantial attention since they are involved in areas such as biofilm formation, antifouling of implants and tumor architectures (Warrick et al., 2013; Tuson and Weibel, 2013; Guillemot et al., 2007). Such interactions may arise from physical (e.g. Van der Waals), or biochemical forces (e.g. protein, lipopolysaccharides and DNA mediated), and their combinations. Despite ongoing investigations, surface tethering of single cells has been employed for many years and such key examples in single cell physiology technologies are highlighted here.
In an early example, polylysine coated nitrocellulose membranes were employed for immobilizing S. cerevisiae and E. coli for up to 4 h, while continuously releasing their newborn cells (Helmstetter, 1991; Helmstetter et al., 1992). The technique, termed ‘baby machine’, is the chemical equivalent of the recently reported ‘dissection platform’ (Lee et al., 2012). Polylysine is water soluble and thus compatible with PDMS. This has enabled many microfluidic investigations on single cells (Taniguchi et al., 2010; Vasdekis et al., 2012). Cholesterol containing co-polymers, and APTES (aminopropyltriethoxysilane), are also water soluble and have been shown to be straightforward methods for tethering yeast in microfluidics (Stojkovic and Znidarsic-Plazl, 2010; Kuhn et al., 2012).
Chemical patterns on surfaces will, in turn, enable patterned immobilized cells even down to the single cell level (Mrksich and Whitesides, 1995; Whitesides et al., 2001). Many techniques exist for generating such surface chemical patterns, such as microcontact printing of self-assembled monolayers (SAMs) (Singhvi et al., 1994), which can also be reversed electrochemically (Jiang et al., 2003). Photolithographically defined SAM patterns using UV (Ward et al., 2001) or visible radiation (Jang et al., 2009), as well as electrochemical (Sun et al., 2008) and photocatalytic methods, have been reported more recently (Bearinger et al., 2009). Again, the microfluidic integration of chemical patterns is an important aspect. To this end, chemical patterning in-situ has been recently demonstrated (Jang et al., 2010), including the integration of metabolic monitoring capabilities using electrochemical pH sensors (Douglas et al., 2009).
While in most cases functionalized surfaces have been employed, bare – non functionalized – coverslips have also been shown to provide a strong enough tether both for yeast (Mettetal et al., 2008) and bacteria (Siegal-Gaskins and Crosson, 2008). Cell-specific tethering is also possible, for example, via antibody, protein, or peptide specific adhesion, as recently reviewed elsewhere (Didar and Tabrizian, 2010).
Cell–surface interactions are the simplest method to immobilize single cells with high viability. However, care has to be taken in selecting the appropriate strategy as phenotypic changes may occur upon surface contact, such as the increased EPS matrix in E. coli (Otto and Hermansson, 2004); for a more detailed discussion on this topic, the reader is referred to the following – bacteria focuses – review article (Tuson and Weibel, 2013).
2.3. Dynamic confinement
In dynamic confinement, single cells or populations of single cells are immobilized and released upon demand. Applications of this type usually involve the post-trapping analysis of the target, such as lysis mediated proteomics and transcriptomics. External stimuli (optical, electrical, acoustic etc.) and recently passive microstructures that generate a reversible trapping potential are commonly employed to this end. These approaches will be reviewed in this section and classified depending on the potential type they employ.
2.3.1. Mechanical micromanipulation
Different types of mechanical micromanipulation exist, such as hydrodynamic, acoustic, or the use of pneumatic valves in microfluidics. Each type is reviewed separately below.
2.3.1.1. Pneumatically isolated microcavities
This is a special class of microcavities formed by two valves that pneumatically seal a portion of a microfluidic channel (Fig. 6a). The elastomeric nature of PDMS and multi-layer soft lithography are critical in such embodiments (Unger et al., 2000). The cells are generally in-between two valves and can be released by opening the valves (Kim et al., 2012). Due to their simplicity, and lab-on-a-chip compatibility, this type of dynamic microcavities has made a tremendous impact in elucidating biological noise (Cai et al., 2006) and in single cell sequencing and transcriptomics (Weinstein et al., 2009; Fan et al., 2011; Streets et al., 2014).
Fig. 6. Dynamic confinement 1.

(a) A schematic representation of a pneumatically isolated microcavity; cell trapping occurs by compressing the flow channel by the two control channels (reprinted by permission from Macmillan Publishers Ltd.: Nature (Cai et al., 2006), Copyright (2006). (b) A fluorescently labeled E. coli trapped inside a submicrofluidic indentation; release takes place by increasing the flow rate (reproduced from Vasdekis (2013) with permission from The Royal Society of Chemistry). (c) A single cell hydrodynamic trap by generating microeddies around a solid cylinder at low frequency oscillations of flow (reproduced from Lutz et al. (2006); Copyright (2006) American Chemical Society). (d) A stagnation point generated at the junction of two perpendicular microchannels; active feedback flow control ensures the stabilization of the stagnation point and the immobilization of a single cell therein (reprinted with permission from Tanyeri et al. (2010)); Copyright (2010), AIP Publishing LLC).
2.3.1.2. Hydrodynamic
Hydrodynamic manipulation is generally achieved in contact and non-contact methods. In the former, we recently demonstrated that trapped cells in percolation filters can overcome the trap barrier simply by increasing the flow rate (Vasdekis, 2013). In this way, the drag force increases, eventually leading to cell escape (Fig. 6b). Regarding non-contact methods, forms of this type include microvortices (Karimi et al., 2013) and stagnation point microflows (Perkins et al., 1997). In microvortices, microeddies are generated in the proximity of solid boundaries under fluid oscillation conditions (Fig. 6c) (Lutz et al., 2006), with reversible trapping occurring at the eddie center (Lieu et al., 2012). Stagnation point trapping occurs at the junction of two streams (Fig. 6d) (Tanyeri et al., 2010). By combining active flow control and microscopy, a condition of zero force exerted on a cell can be reached, leading to stable trapping at the junction (Tanyeri et al., 2011). Non-contact methods are generally simpler; however, they do not enable strict immobilization with the cell position and orientation fluctuating over time.
2.3.1.3. Acoustic
Acoustic manipulation is based on ultrasonic standing waves and was discovered in the early seventies (Baker, 1972). In these, ultrasonic transducers, which generate acoustic waves and hence trapping forces, are integrated with microfluidics (Friend and Yeo, 2011). Acoustic trapping has shown to preserve cell viability, despite the significant temperature increase (~15 °C) (Bazou et al., 2005; Evander et al., 2007). More recently, the acoustic trapping power requirements were substantially reduced by employing piezoelectric substrate and surface acoustic waves (SSAW) (Ding et al., 2012).
2.3.2. Optical micromanipulation
2.3.2.1. Optical tweezers
Optical tweezers (OT) is arguably the most common form of single cell dynamic manipulation (Ashkin and Dziedzic, 1987; Ashkin et al., 1986). In OT’s, a laser beam is focused in the cell medium, generating a strong electromagnetic field gradient that pulls individual cells towards the beam center (Fig. 7a) (Huang et al., 2014), where they remain for prolonged durations (Neuman et al., 1999). By passing the optical beam through a spatial light modulator (Eriksson et al., 2007), or a microlens array (Werner et al., 2011), multiple focused spots are generated. This gives rise to multiple optical potentials, and recently up to 200 optically trapped cells have been reported. The optical focused spot can be also moved, enabling thus the deterministic transport of the trapped cells. This has been shown to conveniently enable the isolation and transportation of single cells within microfluidic (Probst et al., 2013a) or hydrogel growth chambers (Arai et al., 2005). A unique advantage of OTs is that they immobilize single cells away from surfaces, and are thus very popular with Raman microspectroscopy (Chen et al., 2006).
Fig. 7. Dynamic confinement 2.

Schematic representation of single cell trapping by OT (a) and a ‘dual beam trap’ (b). (c) Radiation pressure forces enable selective release of microwell loaded cells (reproduced from Kovac and Voldman (2007)); Copyright (2007) American Chemical Society). (d) DEP trapping of a Pollen grain in an eight electrode electric field cage (reprinted from Schnelle et al. (1993)) Copyright (1993), with permission from Elsevier). (e) The cell loading and retrieval is illustrated for the magnetic microrafts (reprinted with permission from Gach et al. (2011)); Copyright (2011), AIP Publishing LLC).
2.3.2.2. Scattering forces (radiation pressure)
Focused optical beams may also induce weak repulsive forces along the light propagation axis, (Ashkin, 1970) this concept that has also found multiple single cell applications (Ashok and Dholakia, 2012). Single cell immobilization is possible at the center of two lightly focused, counter propagating laser beams-an approach frequently referred to as the ‘dual beam trap’ (Fig. 7b) (Lincoln et al., 2007). Alternatively, scattering forces may be employed to force a trapped cell out of position to its release; this approach was demonstrated by Kovac et al. for forcing cells outside of their trapping microwells (Fig. 7c) (Kovac and Voldman, 2007). Recently, single cell trapping and transport was demonstrated using integrated optical waveguides and resonators. This approach reduces the experimental complexity as well as enabling deterministic light propagation and cell transport along a lithographically defined optical waveguide (Ahluwalia et al., 2010; Yang et al., 2009).
2.3.2.3. Optoelectronic Tweezers
In optoelectronic tweezers (OET), the cell suspension is introduced in between two electrodes, one of which is additionally coated with a photoconductive layer. Upon illumination, a non-uniform electric field is generated between the two electrodes, which in turn induces a dipole and a ‘dielectrophoretic’ force on the cells that traps them on the photoconductive surface (Hughes, 2002). Due to their low light intensity requirements and ability to employ spatial light modulators to generate multiple excitation locations, OETs can generate massively high-throughput trap arrays, with up to 15,000 trapping sites demonstrated (Chiou et al., 2005). Recent progress in OET has enabled their microfluidic integration (Huang et al., 2013), as well as their further simplification and miniaturization by employing alternative illumination strategies such as micro-LED arrays (Jeorrett et al., 2014).
2.3.2.4. Light stimulated hydrogels
In Section 2.2.4, hydrogels were discussed in the context of 0D confinement. However, hydrogels can also be optically degraded and thus enable dynamic control of their cell confining potential (Tamura et al., 2014). Alternatively, hydrogels can also be optically polymerized, as recently demonstrated in combination with microwell trap arrays: the trapped cells were covered with a photosensitive hydrogel, which was selectively illuminated and solidified apart from locations where target cells resided. These cells could then be recovered by simple washing (Fig. 7c) (Sun et al., 2014).
2.3.2.5. Photothermal
Photothermal single cell manipulation is less common, but has been employed to release trapped cells in microfluidic trap arrays, as reported in the seminal work by Tan and Takeuchi (2007). This involved the integration of an aluminum pad in the cell trap location. Upon illumination with a laser beam, the local temperature around the pad was raised, thus inducing a bubble that forces the cells to overcome the trap potential and be released.
2.3.3. Dielectrophoretic micromanipulation
Similar to the optoelectronic tweezers case, in dielectrophoretic (DEP) manipulation, an electric field is generated in the vicinity of microfabricated electrodes; this then induces a dipole in the cells in close proximity (Voldman, 2006). This forces the cells to experience a Coulomb interaction and a resulting trapping force. DEP applications involve cell screening, sorting or transport (Khoshmanesh et al., 2011), as well as immobilization by employing specific quadrupole, octopole or ring electrode geometries (Fig. 7d) (Schnelle et al., 1993; Hunt et al., 2008; Thomas et al., 2009). In electrode arrays, the cell may also be transported from electrode to electrode under the application of specific voltage patterns (Manaresi et al., 2003). Recently, DEP forces were employed to release immobilized cells from a microfluidic trap array (Zhu et al., 2012).
Due to the need of electrode integration, DEP trapping microsystems usually require complex fabrication. Buffer heating effects may also occur due to power dissipation at the electrodes, which was measured to reach up to 20 °C (Seger et al., 2005). Despite such shortcomings, reversible DEP immobilization has found applications in single cell metabolic studies, such as bacterial proliferation in controlled microenvironments (Dusny et al., 2012).
2.3.4. Magnetic micromanipulation
In magnetic micromanipulation, magnetically labeled cells are placed in the proximity of magnets (Ino et al., 2008). The need for magnetically labeled cells was recently successfully eliminated by using paramagnetic buffers (Winkleman et al., 2004). Gach et al. (2011) demonstrated cell release in magnetic polymer microwells, where under the action of a magnetic field, selective removal of an individual microwell was possible (Fig. 7e). To eliminate cell, buffer, or microwell labeling, magnetic nanowires or microparticles were recently shown to trap single cells; the microparticles rotate under the action of a rotating magnetic field, thus generating microvortices and trapping single cells within (Petit et al., 2012; Ye and Sitti, 2014).
2.4. Summary
As discussed in this section, a wide variety of techniques exist, each with its own resolving abilities and target information (e.g. high-throughput versus dynamic analysis, or high/low content screening, mammalian/microbial cells), as well as access requirements to microfabrication or bioanalytic facilities. Table 1 summarizes these approaches, highlighting for each technique its capacity (in number of cells), ability to control the microenvironment by supplying nutrients and removing byproducts, as well as advantages (+) and shortcomings (−) in recovering cells and expertise requirements.
Table 1.
A table summarizing single cell manipulation strategies as discussed in Section 2. The ‘method’ column describes the associated technique, including the characteristic ‘type’ (i.e. flow through, dynamic, permanent), its ability to ‘recover’ cells, its ‘capacity’ (in number of cells), the ‘expertise’ requirements (+, −: low, high), its ability to control the chemical ‘microenvironment’, its ‘surface noise’ properties (arising from non-specific surface adhesion and leading to optical or chemical noise), and finally the related ‘section’, where more information and references can be found.
| Method | Type | Recovery | Capacity | Expertise | Micrenvironment | Surface noise | Section |
|---|---|---|---|---|---|---|---|
| Flow-cytometry | Flow-through | + | 104–105 cells | + | Not available | + | 2.1.1 |
| Microfluidic droplets | Flow-through | + | 103–104 cells | − | Not available | + | 2.1.2 |
| Microwell | Permanent | − | 102–103 cells | + | − | − | 2.2.1 |
| Microchemostats | Permanent | − | 102–103 cells | − | Microfluidics | − | 2.1.2 |
| 2D confinement | Permanent | − | 102–103 cells | − | Microfluidics | − | 2.2.2 |
| 1D confinement | Permanent | − | 102–103 cells | − | Microfluidics | − | 2.2.3 |
| Axial percolation | Permanent | − | 101–103 cells | − | Microfluidics | − | 2.2.4 |
| Lateral percolation | Permanent | − | 101–103 cells | − | Microfluidics | − | 2.2.4 |
| Hydrogels | Permanent | − | 101–103 cells | + | Microfluidics | − | 2.2.4 |
| Surface functionalization | Permanent | − | 101–103 cells | + | Microfluidics | − | 2.2.4 |
| Pneumatic microcavities | Dynamic | + | 100–102 cells | − | Microfluidics | − | 2.3.1 |
| Hydrodynamic | Dynamic | + | 100–102 cells | − | Microfluidics | − | 2.3.1 |
| Acoustic | Dynamic | + | 100–102 cells | − | Microfluidics | − | 2.3.1 |
| Optical tweezers | Dynamic | + | 100–102 cells | + | Microfluidics | + | 2.3.2 |
| Radiation pressure | Dynamic | + | 100–102 cells | − | Microfluidics | + | 2.3.2 |
| Optoelectronic tweezers | Dynamic | + | 100–104 cells | + | Microfluidics | − | 2.3.2 |
| Photothermal/catalytic | Dynamic | + | serial | + | − | − | 2.3.2 |
| Dielectrophoresis | Dynamic | + | 100–102 cells | − | Microfluidics | − | 2.3.3 |
| Magnetic tweezers | Dynamic | + | 100–102 cells | + | Microfluidics | − | 2.3.4 |
3. Probing single cells
Multiple methods to probe single cell physiology exist, operating either in steady state or dynamic fashion. Each method has its distinct resolving capabilities and targets specific cell characteristics, such as its size, mass, and volume, as well as specific organelles or metabolites. Several excellent reviews have been published on the topic (Zenobi, 2013; Borland et al., 2008; Galler et al., 2014; Trouillon et al., 2013), including recent ones on biomechanics, microanalytical separations and genomics (Zheng et al., 2013; Borland et al., 2008; Kalisky and Quake, 2011), – topics that will not be reviewed herein.
On the contrary, our focus in this section is on methods that directly or indirectly probe the metabolic-state, or energy flow of single cells. Depending on their nature, the techniques are divided into non-destructive ones that permit dynamic analysis, namely label-free and fluorescence mediated microanalysis. We will also briefly discuss non-dynamic techniques, namely mass spectrometry and nuclear magnetic resonance. Key applications in single cell physiology and metabolic analysis will be discussed separately for each technique.
3.1. Label free microanalysis
Label free microanalysis techniques will be reviewed in this section, namely techniques that can probe single cell physiology without the need of cell staining. Cell proliferation, mass, volume and chemometric content are the typical pieces of information that can be extracted from single cells with such strategies, and will be reviewed separately.
3.1.1. Proliferation
In proliferation studies, cell growth in terms of number of individuals and their size is investigated, both of which have direct links to cell cycle and metabolic state. The most common instrument used to this end is conventional microscopy; however, more advanced, label-free, holographic approaches are becoming increasingly popular (Cotte et al., 2013). With the advent of advanced microfluidic architectures, proliferation studies have been revolutionized, and it is now possible to track parameters of multiple individual cells for many generations and under controlled chemostatic conditions (Lecault et al., 2011; Groisman et al., 2005). Such recent developments involve the long-term and dynamic analysis of cell size and size homeostasis, as well as the relationship of these characteristics between mother and offspring cells (Fig. 8a) (Nobs and Maerkl, 2014). Single cell lifespan analysis was recently reported, linking cell age to specific phenotypic variations (Lee et al., 2012). In this study, a microfluidic dissection device enabled single cell tracking with no cell-crowding due to the continuous removal of the newborn cells by flow (Fig. 5c). 1D confinement structures have also been extensively employed to track lineages of single cells (Rowat et al., 2009), as well as their response to chemical perturbations, such as antibiotics (Balaban et al., 2004). It is also worth adding that portable cell-phone compatible microscopy platforms have been recently demonstrated, enabling important single-cell physiology and motility investigations (Cui et al., 2008; Su et al., 2012).
Fig. 8. Label-free microanalysis.

(a) Single cell proliferation in a microchemostat (reprinted from Nobs and Maerkl (2014)). (b) The Raman spectrum of a bacterium is plotted, including the major bands attributions (reprinted from Schuster et al. (2000); Copyright (2000) American Chemical Society). (c) Raman images of yeast at different wavenumber regions, marking specific intracellular molecular fractions (adapted from Rosch et al. (2005); Copyright©2005 John Wiley & Sons, Ltd.). In (d) a multiplex SRS image of single algal cells, depicting photosynthetic pigments (red), lipids (green) and protein (blue); (adapted from Fu et al. (2012)); Copyright (2000) American Chemical Society). (e) Elemental maps from X-ray emission of the marine species D. norvegica using a nuclear microprobe at a 5 μm spatial resolution (adapted from Gisselson et al. (2001)). (f) A budding yeast cell imaged by soft X-ray tomography, where different colors represent different organelles (adapted from Parkinson et al. (2008); Copyright 2014 by the Association for the Sciences of Limnology and Oceanography, Inc.). (For interpretation of the references to color in this figure legend, the reader is referred to the web version of this article.)
3.1.2. Single cell volume and mass
The mass and volume are two physical characteristics also directly linked to cell cycle and metabolic state. Their importance has been recently recognized and several strategies for their measurement have been developed to this end.
3.1.2.1. Volume
Volume measurements can be imaging or impedance (resistance) based. An advanced imaging approach is the Reflection Interference Contrast (RIC) method, where angled white-light illumination gives rise to interference fringes; the number of which is directly proportional to the height of the cell (Strohmeier and Bereiterhahn, 1987). In an alternative imaging approach, Bottier et al. (2011) employed ‘negative staining’, namely the addition of a fluorescent, non-permeable dye in the buffer surrounding the cells, followed by substantially simpler image analysis. Impedance based methods are also very popular, such as the commercial Coulter technique, where cells decrease the electrical conductivity of an aperture as they transit in front of it. The conductivity decrease has an amplitude directly dependent on the cell volume (Coulter, 1956).
The Coulter instrument was recently integrated with a temperature stabilized chemostat to enable ‘continuous’ population-scale measurements; the authors reported volume measurements of both yeast and mammalian cells for more than 3 h of continuous growth (Bryan et al., 2012). Microfluidic approaches have also been reported. In one approach, microfluidic traps were integrated with the electrode-based volume sensor, enabling the monitoring of real-time volume changes of single cells for several minutes (Hua and Pennell, 2009). In another embodiment, Riordon et al. integrated the electrodes with a pneumatic valve in order to engineer the sensitivity of the volume sensor. By pressurizing the valve, the buffer volume in the vicinity of the electrodes is modified, in turn modulating accordingly the sensor dynamic range and sensitivity (Riordon et al., 2012).
3.1.2.2. Mass
In one of the earliest attempts for accurate mass determination of a single – hydrated – cell, the Manalis group developed the ‘suspended micro-channel resonator’. In this approach, a microfluidic channel is engraved in a vacuum suspended microcantilever; as a cell flows through the microchannel, the mass of the microcantilever and its resonant frequency are modified (Godin et al., 2010). Thus, by detecting changes in the microcantilever’s resonance frequency, the ‘buoyant’ mass of a single cell can be accurately determined with extraordinary sensitivity of 20–30 fg (Burg et al., 2007). Recently, the same group integrated a single cell trap (Section 2.2.4) for long-term immobilization and measurements of the single cell mass variation under chemometric conditions (Weng et al., 2011). More recently, MEMS resonant sensors have been developed, on top of which adherent cells are deposited for continuous mass monitoring (Corbin et al., 2014). In this embodiment, due to the resonator being in a hydrated state, the reported mass resolution is lower, on the order of 1 pg (Park et al., 2010).
Interferometric optical techniques are also possible to infer mass information at the single cell level (Popescu et al., 2014). The operation principle is based on the optical phase delay experienced by light transmitted through a cell, which is proportional to the mass density of the cell. While initial attempts focused on the sensing of the refractive index of single cells (W.Z. Song et al., 2006), more recently, direct imaging techniques, such as the ‘spatial light interference microscopy (SLIM)’, have emerged (Wang et al., 2011). These are label-free and non-invasive and, contrary to the aforementioned mechanical methods, they can perform rapid and sensitive mass measurements of individual cells even within populations (Mir et al., 2011).
3.1.3. Microspectroscopic chemical analysis
Microspectroscopy is a type of chemical analysis, realized by exciting the cell with a specific form of radiation, and analyzing the spectral response. Various such methods exist, categorized by the type of employed radiation, while imaging can also be achieved by spectral analysis at different (sub-cellular) locations. Common microspectroscopy methods for cell-physiology studies, such as Raman, infra-red and microbeam spectroscopy will be reviewed separately in the following paragraphs.
3.1.3.1. Raman
In Raman microspectroscopy, laser light illuminates and scatters from a single cell at a different wavelength. This spectral shift depends on the vibrational frequencies of the intracellular molecules, which are distinct for specific chemical bonds. In this way, the intracellular content, such as proteins, fatty acids, and nucleic acids, can be analyzed (Fig. 8b) (Brehm-Stecher and Johnson, 2004). Raman techniques emerged more recently in cell biology (Puppels et al., 1990). By addressing related technical challenges (Brauchle and Schenke-Layland, 2013), Raman analysis became possible not only on dehydrated (Schuster et al., 2000), but also on hydrated (Krafft et al., 2006) cells (Fig. 8c).
One of the unique characteristics of Raman microanalysis is its compatibility with optical tweezers (Section 2.3.2). This is frequently referred to as Laser Tweezers Raman Spectroscopy (LTRS) and is based on the use of a single laser beam that both traps and excites the target cell (Xie et al., 2005). This has enabled unique bioprocessing investigations, such as ethanol and lipid biosynthesis (Peng et al., 2010; Wu et al., 2011). However, care needs to be taken to avoid cell photodamage, especially for prolonged single cell studies; the use of a near-IR excitation laser has been shown to only partially address this (Xie et al., 2003). Metabolic analysis at the single cell level can also be performed by isotopic labeling, whereby the incorporation of heavy isotopes shifts the Raman bands of the molecular bonds involved in the label incorporation (Wagner, 2009).
3.1.3.2. Resonant Raman
In this microspectroscopy embodiment, the laser excitation wavelength is chosen to overlap with the absorption bands of fluorescent molecules inside the sample. In this way, the ‘resonance’ Raman effect is achieved, which greatly enhances the signal levels of the target by at least 103–104 times. Typical examples involve the use of a UV excitation laser to detect the resonant Raman spectra of amino or nucleic acids (Asher, 1988; Puppels et al., 1991). Due to the presence of autofluorescent compounds/pigments, resonance Raman has been particularly useful in the biochemical and metabolic studies of photosynthetic microorganisms (Li et al., 2012). Recently, the dynamics of cytochrome c under physiological and stress conditions were studied by resonance Raman, revealing its role in cell apoptosis (Okada et al., 2012). Due to its enhanced signal levels, resonance Raman greatly enhances the measurement’s temporal resolution and minimizes photodamage; however, photobleaching of the involved fluorescent molecules can occur, eventually leading to signal degradation (Chen et al., 2006).
3.1.3.3. Surface enhanced Raman (SERS)
SERS is an alternative way to enhance the Raman efficiency and signal levels. In SERS, the cells are placed on either a rough, or a periodically structured metal surface (Camden et al., 2008). The latter amplifies the local electromagnetic field; in turn, increasing signal sensitivity by a factor of up to 1015 (Nie and Emery, 1997). However, SERS is strongly dependent on the distance of the metal surface to the target, with the enhancement levels decaying considerably even within 10 nm. This can be addressed by appropriate metal layer chemical functionalization (Section 2.2.4), which enables the simultaneous cell capture and SERS analysis (Liu et al., 2011). Metallic nanoparticles may also be used, which upon internalization enable intracellular SERS microspectroscopy (Yuan et al., 2013; Vitol et al., 2012). Tip-enhanced Raman spectroscopy is also based on the same principle, with the tip itself acting as the local optical amplifier, and overall enabling Raman images of very high spatial resolution (down to 10 nm) (Schmid et al., 2013).
3.1.3.4. Coherent Raman
Coherent anti-Stokes Raman scattering (CARS) and Stimulated Raman Scattering (SRS) are two popular forms of coherent Raman microspectroscopy of single cells. In CARS, the sample is illuminated with two short-pulse (fs) laser beams instead of a single continuous wave like in spontaneous Raman. The frequency difference of the two excitation lasers needs to be equal to the vibrational frequency of the target bond, thus mapping specific chemical entities, such as lipids or proteins (Cheng and Xie, 2004). As a result, in comparison to spontaneous Raman, a significantly enhanced signal is obtained by more than 2 orders of magnitude (Pezacki et al., 2011). CARS is a non-linear optical process (similar to two-photon absorption), hence exhibiting enhanced sectioning capabilities and making it ideal for 3D biological imaging. However, CARS is mostly applicable for imaging abundant intracellular species, as its signal strength rolls off rapidly at low target analyte concentrations.
In CARS imaging, the background noise contribution from non-resonant chemical species is usually high, resulting in reduced chemical contrast. This has been addressed by implementing phase sensitive detection in Stimulated Raman Scattering (SRS) (Freudiger et al., 2008). As a result, multi-wavelength, rapid imaging of high resolution and specificity is possible, such as the biochemical and metabolic analysis of photosynthetic micro-organisms (Fig. 8d) (Fu et al., 2012), and the internalization kinetics of small molecules (Fu et al., 2014).
Both CARS and SRS are highly promising in single cell chemical imaging due to their label-free nature, enhanced specificity, and sectioning ability. This is particularly pertinent in lipid imaging and spectroscopy at the single cell level. Such intracellular compartments are both abundant and exhibit a strong C–H vibration mode at 2850 cm−1, making them readily detected with coherent Raman techniques with unsurpassed temporal resolution and chemical contrast. As a result, the areas of fundamental lipid biology and metabolism have experienced rapid growth due to the advent of such imaging platforms (Hellerer et al., 2007; Nan et al., 2003). Both CARS and SRS however, require complex optical set-ups, while the long term effects of the employed intense laser pulses on the cell physiology and integrity remain to be identified (Petrov et al., 2007; Yakovlev, 2003; Radulovic et al., 2013).
3.1.3.5. Infrared (IR) microspectroscopy
In this embodiment, the IR absorption spectrum of an individual cell is captured to directly identify the structure and function of intracellular macromolecules (Quaroni and Zlateva, 2011; Kazarian and Chan, 2013). The challenge in this strategy is primarily the signal saturation due to the strong IR absorption of water, which can be addressed by employing dehydrated samples (Romeo et al., 2004). Alternatively, attenuated-total-reflection (ATR) approaches can be employed to confine the excitation close to the substrate-medium interface, thus avoiding the water absorption, but also likely exciting a partial volume of the cell (Kuimova et al., 2009). A third successful approach to avoid water absorption is the use of tailored designed chambers that minimize the media thickness, such as low-thickness (Nasse et al., 2009), or open access microfluidics (Holman et al., 2009).
Due to the employment of longer excitation wavelengths, IR microscopy exhibits a larger (diffraction limited) excitation area compared to Raman. Despite this, the IR absorption spectra of isolated cells can still be measured, as in the successful determination of metabolite (EtOH) formation dynamics (Goff et al., 2009) and DNA conformation (Whelan et al., 2011) in isolated cells. The use of solid immersion optical elements can increase the resolution down to 2–3 μm (Chan and Kazarian, 2003). True super-esolution IR imaging can be achieved by coupling IR to an Atomic Force Microscope probe, a strategy that has been shown to successfully detect triglycerides in dried cells with a 100 nm spatial resolution (Deniset-Besseau et al., 2014).
3.1.3.6. X-rays
Many types of X-ray microspectroscopy techniques for single cell elemental turn-over analysis exist, either in fluorescence or transmission mode (Sakdinawat and Attwood, 2010). The X-ray fluorescence microprobe is one of the first approaches in biology well suited for the measurement of the concentration, location and turn-over rates of specific inorganic elements (Fig. 8e) (Gisselson et al., 2001). A major application of this approach in the context of metabolism is the measurement of trace metal cycling at the single cell level for environmental applications (Twining et al., 2003; Yun et al., 1998). Soft X-ray microspectroscopy is a more recent technique, based on high-brightness synchrotron light sources and commonly operating in transmission mode (STXM) (Hitchcock et al., 2005; Barinov et al., 2009). 3D tomographic imaging is also possible in STXM by simply rotating the sample at discrete angles (Parkinson et al., 2008) (Fig. 8f). Overall, X-ray microspectroscopic imaging is ideal for structural imaging due to its 3D and nm resolution; long-term dynamic imaging is more challenging however because radiation dose can be damaging (Beetz and Jacobsen, 2003).
3.1.4. Electrochemical analysis
Electrochemical methods are ideally suited for the analysis of the extracellular environment and the influence of cell secretion and cell-to-cell communication. To a similar note, microelectrophoretic approaches can also be applied to single cell analysis, as recently reviewed elsewhere (Borland et al., 2008). Electrochemical methods are very attractive due to their low-capital investment requirements and microfluidic compatibility (Trouillon et al., 2013; D. Kim et al., 2011; Lama et al., 2012; Nebel et al., 2013b). Herein, our focus will be on single cell respiration since oxygen – a common electron acceptor in metabolism – is rather electroactive and thus readily detectable. In the early attempts, scanning electrochemical microscopy (SECM) was employed, where a tip scanned over the cells and measured current modulations due to localized oxygen concentration variations (Kaya et al., 2003). While SECM has enabled very important findings, it was recently argued that the readings’ accuracy is limited due to the cell’s topography and associated challenges in maintaining the exact same scanning path during long-term measurements (Nebel et al., 2013a). This challenge can be conveniently addressed by integrating the sensing electrodes with microfluidic control of the cell position, an approach that has recently enabled the precise quantification of respiration kinetics in single photosynthetic bacteria (Koide et al., 2011, 2012).
3.2. Fluorescence mediated microanalysis
In this section we will review fluorescent methods for registering metabolic activity and bioenergetics of single cells. This has been an established field for a many decades now, and numerous strategies and toolkits exist – a significant number of which are commercially available. Many excellent resources exist on this topic, such as the J.R. Lakowicz textbook for a complete background on fluorescence (Lakowicz, 2006), as well as a few recent reviews on single cell fluorescent imaging and spectroscopy (Lichtman and Conchello, 2005; Ntziachristos, 2006; Stender et al., 2013). Detailing all available methods is beyond the scope of this review; our aim instead is to highlight key available methods (Section 3.2.1) and related contrast agents (Section 3.2.2) of practical use in investigating energy flow and metabolism at the single cell level.
3.2.1. Methods
Fluorescent single cell methods are generally divided into cytometry, microscopy, and their modifications, such as Fluorescence Correlated Spectroscopy (FCS) and Fluorescent Recovery After Photobleaching (FRAP). These are briefly discussed below.
3.2.1.1. Cytometry
In cytometry – also described earlier in the context of single cell manipulation (Section 2.1.1) – the cells flow in front of one or more laser beams and their scattering or fluorescent properties are detected by opposing detectors. Alternative embodiments include the Laser Scanning (LSC) and Imaging cytometry, both of which are also commercially available. In LSC, the laser excitation is scanned over cells deposited on slides or membranes, and thus is not limited to studies involving only cells in solution as in conventional flow-cytometry (Pozarowski et al., 2013; Pozarowski et al., 2006). Imaging cytometry refers to a wide range of techniques of high-throughput cell microscopy (Doudkine et al., 1995). In the most common embodiment, cells are deposited on a slide and imaged at the single cell level using basic or advanced microscopy modalities (Chumnanpuen et al., 2012). More recently, microfluidic image cytometry (MIC) was reported, where cells are contained in discrete microfluidic chambers and undergo growth and long-term imaging cytometry for high-content screening (Kamei et al., 2010; M.J. Kim et al., 2011).
3.2.1.2. Microscopy
The most common modality of fluorescent microscopy is the epifluorescent microscope using a laser (coherent) or a lamp (incoherent) excitation source (Webb and Brown, 2013). To enhance the imaging contrast and enable 3D optical sectioning, techniques such as the confocal (laser scanning (White et al., 1987) or spin-disk (Nakano, 2002)), multi-photon (Denk et al., 1990) imaging, as well as light-sheet microscopy (Keller et al., 2010; Verveer et al., 2007) are currently available. Substantial accomplishments in superesolution microscopy have been recently reported, with even 10 nm resolution being possible (Huang et al., 2009). The most common and commercially available strategies involve the Structured Illumination Microscopy (SIM), with a reported resolution of about 100–150 nm (Gustafsson 2005), and Stimulated Emission Depletion Microscopy (STED) with a 30 nm resolution limit (Willig et al., 2006). 30–50 nm optical resolution can also be achieved by modulating the emission of single molecules, either stochastically, such as Stochastic Optical Reconstruction Microscopy (STORM) (Rust et al., 2006), and Photoactivated Localization Microscopy (PALM) (Shroff et al., 2008), or, as more recently, deterministically using polarization modulation techniques (Hafi et al., 2014).
3.2.1.3. Fluorescence lifetime imaging (FLIM)
In FLIM, the image contrast is derived by the fluorophore excited-state lifetime at each pixel, rather than its intensity. Generally, there are two FLIM types, one operating in the frequency domain (frequency modulated illumination and detection) (Lakowicz et al., 1992), and one that operates in the time domain by counting photons using fast lasers and detectors (Becker et al., 2004). FLIM is a unique imaging modality because it enables fluorophore discrimination based on their conformation and their local chemical microenvironment, both of which directly affect their excited state lifetime (Gratton et al., 2003). A common challenge in FLIM is the low photon budget at the pixel of each image, which however has been recently overcome by processing the image using the phasor analysis method (Digman et al., 2008). As a result, FLIM has found many applications in metabolic imaging, especially by discriminating free and protein bound NADH (short and long lifetime respectively). This has in essence revolutionized in-vivo metabolic imaging applications, such as the discrimination of proliferative stem cell in living tissue (Stringari et al., 2011).
3.2.1.4. Fluorescence correlated spectroscopy (FCS)
In FCS, a laser beam illuminates part of the cell and the intracellular fluorescence is continuously monitored. The latter exhibits fluctuations which decipher intracellular molecular dynamics, such as the concentration and diffusion constant of fluorescent proteins (Bacia et al., 2006). Fluorescent Recovery After Photobleaching (FRAP) is a similar technique, where a location of the cell is continuously illuminated until bleached; subsequently, the dynamics of fluorescence recovery is monitored; namely, the diffusion in the observation volume of fresh, fluorescent molecules (Reits and Neefjes, 2001). Similar to FCS, FRAP provides information about the diffusion and binding kinetics of fluorescent proteins.
3.2.2. Contrast agents
Contrary to the aforementioned label-free techniques, in fluorescence, chromophores need to be implemented that absorb light at a specific wavelength and re-emit at a different one. Such molecules or probes that are crucial in exploring the physiology or metabolic state of single cells will be discussed in this section, including fluorescent proteins, enzymes and biosensors.
3.2.2.1. Fluorescent proteins (FP)
Since the advent of the green FP (GFP) cloned from the jellyfish Aequorea victoria (Chalfie et al., 1994), FPs have arguably become the workhorse contrast agent in modern bioimaging applications (Giepmans et al., 2006). These genetically encoded chromophores exhibit now a wide variety of emission wavelengths (Fig. 9a), as well as enhanced photostability and brightness (Dean and Palmer, 2014). FPs are commonly used as reporters of other non-fluorescent proteins. This is achieved by fusing them to the protein of interest through a short peptide linker, which in turn is realized by cloning the FP sequence in a continuous open reading frame of the gene of interest (Kentner and Sourjik, 2010). FPs have found numerous single cell applications. One example involves the long-term single cell imaging of expression of genes linked to metabolic regulation. These investigations have been pioneering in elucidating metabolic gene regulation under perturbations (Bennett et al., 2008), as well as the nature of stochastic transitions in metabolic networks, such as the ‘all or non’ behavior reported for the lactose (Mettetal et al., 2006), or galactose utilization (Acar et al., 2005). FP fusions can also be used to tag specific intracellular organelles (Kohlwein, 2000); a few recent examples of this type specific to metabolism involve the high-throughput imaging of mitochondrion network-size scaling during proliferation, (Rafelski et al., 2012) and the role of triacylglycerol enzymes in lipid droplet biosynthesis (Wilfling et al., 2013).
Fig. 9. Fluorescence mediated microanalysis.

(a) Chromophore classes found in fluorescent proteins and their respective emission bands (reprinted by permission from Macmillan Publishers Ltd.: Nature Chemical Biology (Dean and Palmer, 2014), Copyright (2014). (b) A phosphorescent oxygen sensor at the bottom of a microwell plate containing two cells (reprinted from Molter et al. (2009), Copyright (2009), with permission from Elsevier). (c) Population heterogeneity in the production of L-valine, revealed by an FP-fused genetically encoded biosensor (reproduced from Mustafi et al. (2014)). (d) Microfluidic high-throughput screening platform of secreted metabolites in microfluidic droplets; reprinted by permission from Macmillan Publishers Ltd.: Nature Biotechnology (Wang et al., 2014), Copyright (2014).
3.2.2.2. Physiological fluorophores
Fluorescent (non-genetically encoded) probes capable of accumulating in specific intracellular organelles belong to this category (Lichtman and Conchello, 2005). There is a wide variety of such probes, each targeting a specific intracellular moiety. One of the earliest examples of this class is the stain of nucleic acids, such as the Hoechst or propidium iodide dyes (Shapiro, 2003; Nicoletti et al., 1991), with the latter being selectively internalized upon apoptosis, thus also functioning as a fitness indicator. Specific organelles may also be targeted, such as the mitochondrion, (Sala-Newby et al., 1999) or the cell membrane (Gaffield and Betz, 2006), the latter also functioning as a vesicle-mediated internalization pathway indicator. Another important class of physiological fluorophores in bioprocessing are lipophilic dyes that selectively partition within lipid droplets (Govender et al., 2012), enabling thus the direct visualization of lipid droplet metabolism and strain selection (Herms et al., 2013).
3.2.2.3. Biosensors
These are a special class of probes that their optical properties are altered depending on variations of the local microenvironment (Okumoto et al., 2012). Calcium sensors (Rudolf et al., 2003) belong to this category, as well as membrane potential (Schallmey et al., 2014) and hydrogen ion sensors (Bassnett et al., 1990). The latter are ideal as metabolic activity indicators, operating on the simple principle that pH homeostasis cannot be maintained at low ATP production (Vanaelst et al., 1993). Such pH sensors were very recently employed to reveal subpopulations of distinct metabolic profile in isogenic cultures (van Heerden et al., 2014). Other types of biosensors also exist, such as membrane potential and FRET ones; the interested reader is re-directed to recent reviews on the topic (Tracy et al., 2010; Schallmey et al., 2014).
Respiration activity is another important metabolic indicator, which can be optically detected, in addition to the previously discussed electrochemical methods (Section 3.1.4). For the optical readout of respiration, specific phosphorescent sensors need to be employed. These, upon collision, transfer non-radiatively their energy to molecular oxygen and their intensity decreases (Lakowicz, 2006). Optical oxygen sensing has been applied both to microfluidic cultures (Ungerboeck et al., 2013), but also at the single cell level trapped in microwells (Dragavon et al., 2008; Molter et al., 2009) (Fig. 9b). Indirect respiration detection is also possible, involving sensors such as the Redox Sensor Green dye (Kalyuzhnaya et al., 2008). Their operation is based on the active electron transport system during respiration, which reduces the sensing moiety and modifies its emission spectrum (Konopka et al., 2011). There are also many types of genetically encoded biosensors capable of detecting a variety of intracellular entities such as hydrogen peroxide (Belousov et al., 2006) and calcium (Whitaker, 2010). These do not need to undergo cell internalization in order to operate, thus substantially simplifying their use. Such sensors have recently found many applications in detecting intracellular concentrations of specific metabolites. In these, the metabolites react with transcriptional activators, initiating the expression of fluorescent proteins. Such recent biosensor examples involve the dynamic monitoring of amino acid production in the industrially relevant strain Corynebacterium glutamicum (Fig. 9c) (Mustafi et al., 2014; Schendzielorz et al., 2014).
3.2.2.4. Enzyme activity
Biosensors also exist for assaying enzyme activity (Reymond et al., 2009). Specific to single cell analysis, non-fluorescent and cell-permeable substrates can be employed, which are then enzymatically converted into a fluorescent one. Two very basic examples are Calcein-AM (Bratosin et al., 2005) and Alamar Blue (resazurin) (O’Brien et al., 2000) that become fluorescent or lose their emission respectively upon enzymatic reaction. Fluorescent substrates adhered on the cell membranes have also been reported; these have been useful in selecting protease variants by FACS: desired variants cleaved the fluorescent unit, thus exhibiting no fluorescence and enabling FACS sorting (Olsen et al., 2000).
With the advent of microfluidics, it has been recently possible to assay secreted metabolites in intact cells, as well as lyse cells and quantify their intracellular metabolite content. Regarding metabolite secretion, single enzyme studies in pneumatically isolated microfluidic chambers, (Cai et al., 2006) or population screening in microfluidic droplets have been reported (Wang et al., 2014). In the latter report, the use of microfluidic droplets enabled the concentration of the secreted metabolite, with the impressive ability to identify 1 desired variant in a population of 104 cells (Fig. 9d) (Wang et al., 2014). A coupled enzymatic assay was employed based on the indicator Amplex UltraRed, which converts into a fluorescent compound in the presence of horse-radish peroxidase and hydrogen peroxide (H2O2), the latter being the product of oxidase mediated metabolite oxidation (Zhu et al., 2010). In regards to assaying lysed cells, single cells were trapped in a microfluidic chamber, and underwent several washing steps and eventually lysis. Lysate targets were then surface immobilized and quantified by a sandwich ELISA assay (Eyer et al., 2013).
3.3. Mass spectrometry methods (MS)
Specific to metabolomics, much recent technological advancement has enabled operation at the single cell level. These technologies have been reviewed recently in many excellent reports (Wang and Bodovitz, 2010; Rubakhin et al., 2013; Heinemann and Zenobi, 2011), so we will only summarize key recent findings and remaining challenges. In regards to challenges, one is the tremendous variability of metabolites, as well as their rapid turnover rates – even at the single cell level (Zenobi, 2013). As recently reviewed by Heinemann and Zenobi (2011) several strategies have been developed to address this, including chemical separations prior to detection, microfluidic cell handling, and nanophotonic signal enhancement (Walker et al., 2013). The use of complementary detection methods in addition to mass-spectrometry has also gathered considerable excitement. One such example is the selective analysis of either the cytoplasm or of the intracellular compartments by combining nano-electrospray ionization (ESI–MS) with video microscopy (Mizuno et al., 2008) as illustrated in Fig. 10a and b.
Fig. 10. Mass spectrometry.

Sequential clips illustrating the metabolic analysis of single cells using nano-electrospray ionization (ESI–MS); in this instance, video microscopy enables the selective analysis of the cytoplasm (a) or individual granules (b); reprinted from Mizuno et al. (2008); Copyright©2008 John Wiley & Sons, Ltd. (c) Schematic illustrating the NanoSIMS imaging of a single cell: the secondary ion beam rasters over the sample removes material to be analyzed by MS. Quantitative raster NanoSIMS images of the R. palustris bacterium, illustrating the distribution of 12C− (d) and 13C− (e); image (f) illustrates the 13C− enrichment at one pole of the cells (reproduced from Doughty et al. (2014)).
Achieving high-throughput and statistically significant single cell data is another challenge in metabolomics. To address this, one approach developed by the Zenobi group is microarrays for mass spectrometry (MAMS). MAMS contain an array of hydrophilic spots on a hydrophobic surface, thereby isolating one or a few cells in a spatially organized matrix (Urban et al., 2010). This approach enabled the group to characterize metabolic population variability in yeast using MALDI MS (Ibanez et al., 2013). In an alternative approach, to achieve ultra-high throughput, the Nolan and Tarren groups developed the mass cytometer, whereby single cells are stained with isotopically labeled antibodies and subsequently analyzed in an ICP-MS (Bendall et al., 2011). The technique – termed CyTOF – enabled the simultaneous detection of 34 different parameters. CyTOF was primarily used for immunophenotyping of single cells. Given appropriate antibodies, the technique is also ideal for high-throughput single cell metabolomics.
Single cell MS imaging is also possible, by analyzing specific locations of the cell sequentially. The most traditional approach has been the MALDI-MS, which exhibits a spatial resolution of approximately 1 μm (Zimmerman et al., 2011). By using an ion instead of a laser beam, the more recent ‘secondary ion mass spectrometric’ imaging (SIMS) exceeds the spatial resolution limit of MALDI-MS by more than one order of magnitude (Wagner, 2009; Lechene et al., 2007) (Fig. 10c). However, compared to MALDI, SIMS exhibits lower chemical specificity, which can be addressed by supplying the targets with isotopically labeled nutrients. Sampling at different times also enables the turn-over determination of specific macromolecules (Kraft et al., 2006; Doughty et al., 2014) (Fig. 10d–f).
Finally, it is worth noting that single-cell proteomics is also currently pursued with MS; however, little progress has been achieved to this end, primarily due to the small number of proteins in individual cells and the inability to amplify such analytes as commonly done in gene studies and sequencing. LTQ-Orbitrap MS is the most promising strategy to address this; however, extremely efficient sample handling needs to be perfected towards this task (Wang and Bodovitz, 2010).
3.4. Nuclear magnetic resonance methods (NMR)
Single cell metabolomics with NMR is a field at its infancy, exhibiting still insufficient detection limits. However, both the information content that can be extracted with NMR and the fact that it is a non-invasive technique are unique and very attractive features (Rubakhin et al., 2011). NMR of very large cells such as oocytes (Lee et al., 2006) and neurons (Grant et al., 2000) has been possible, albeit at an incomplete metabolome coverage. Recent progress however in designing novel microcoil probes, (Maguire et al., 2007) and the integration of NMR with microfluidics. Both are very promising approaches that have so far enabled further decrease of the observation volume and enhanced the sensitivity down to the nmol regime (Bart et al., 2009).
4. Conclusions
Single cell analyses, such as imaging and sequencing, have been of crucial importance in modern life sciences and particular systems biology. More recently, such analyses were applied to metabolic investigations and engineering, enabling unique observations, such as the discovery of subpopulations with distinct metabolic profile (Wang et al., 2014; van Heerden et al., 2014; Labhsetwar et al., 2013), and the quantification of metabolic variability in populations (Ibanez et al., 2013). The importance of such findings spans not only systems biology, environmental microbiology and the biomedical field, but also industrial applications of synthetic biology, where such phenotypic variations are known to negatively impact productivity (Konopka et al., 2011; Carlquist et al., 2012). Further insight in this domain will clearly lead to better understanding of environmental challenges, as well as identifying novel therapeutic and metabolic engineering approaches.
With this review, our aim is to outline presently available techniques for isolating and probing the bioenergetics and metabolic potential of individual cells. While each individual category (manipulation and probing) are promising itself, the co-integration is likely to enable a deeper insight into the origins and effects of cellular metabolic heterogeneity. This is evident by the recent discoveries enabled by the fusion of droplet microfluidics with advanced fluorescence techniques (Wang et al., 2014), and that of single cell surface patterning with mass spectrometry (Ibanez et al., 2013). Emerging computational and microanalytical techniques will also play a critical role; the latter involving ‘omics’ analysis of microbial cells with enhanced coverage and ‘correlative microscopy’ (Smith, 2012), by fusing MS with superesolution microscopy (Saka et al., 2014) for both analyzing metabolic network function and structure.
Acknowledgments
AEV gratefully acknowledges funding support from the Pacific Northwest National Laboratory (LDRD project ID: PN12005/2406-Linus Pauling) and GS from the DOE, Genomic Sciences program Grant no. DE-SC0008744. We also wish to – in advance – apologize to those investigators and colleagues whose work was not cited herein due to space limitations.
References
- Acar M, Becskei A, van Oudenaarden A. Enhancement of cellular memory by reducing stochastic transitions. Nature. 2005;435 (7039):228–232. doi: 10.1038/nature03524. [DOI] [PubMed] [Google Scholar]
- Agresti JJ, et al. Ultrahigh-throughput screening in drop-based microfluidics for directed evolution. Proc Natl Acad Sci USA. 2010;107 (9):4004–4009. doi: 10.1073/pnas.0910781107. [DOI] [PMC free article] [PubMed] [Google Scholar]
- Aharoni A, et al. High-throughput screening of enzyme libraries: thiolactonases evolved by fluorescence-activated sorting of single cells in emulsion compartments. Chem Biol. 2005;12(12):1281–1289. doi: 10.1016/j.chembiol.2005.09.012. [DOI] [PubMed] [Google Scholar]
- Ahluwalia BS, et al. Optical trapping and propulsion of red blood cells on waveguide surfaces. Opt Express. 2010;18 (20):21053–21061. doi: 10.1364/OE.18.021053. [DOI] [PubMed] [Google Scholar]
- Andersson H, van den Berg A. Microfluidic devices for cellomics: a review. Sens Actuators B – Chem. 2003;92(3):315–325. [Google Scholar]
- Arai F, et al. On chip single-cell separation and immobilization using optical tweezers and thermosensitive hydrogel. Lab on a Chip. 2005;5 (12):1399–1403. doi: 10.1039/b502546j. [DOI] [PubMed] [Google Scholar]
- Asher SA. UV resonance Raman studies of molecular-structure and dynamics: applications in physical and biophysical chemistry. Annu Rev Phys Chem. 1988;39:537–588. doi: 10.1146/annurev.pc.39.100188.002541. [DOI] [PubMed] [Google Scholar]
- Ashkin A. Acceleration and trapping of particles by radiation pressure. Phys Rev Lett. 1970;24(4):156. doi: 10.1103/PhysRevLett.54.1245. [DOI] [PubMed] [Google Scholar]
- Ashkin A, Dziedzic JM. Optical trapping and manipulation of viruses and bacteria. Science. 1987;235 (4795):1517–1520. doi: 10.1126/science.3547653. [DOI] [PubMed] [Google Scholar]
- Ashkin A, et al. Observation of a single beam gradient force optical trap for dielectric particles. Opt Lett. 1986;11(5):288–290. doi: 10.1364/ol.11.000288. [DOI] [PubMed] [Google Scholar]
- Ashok PC, Dholakia K. Optical trapping for analytical biotechnology. Curr Opin Biotechnol. 2012;23(1):16–21. doi: 10.1016/j.copbio.2011.11.011. [DOI] [PubMed] [Google Scholar]
- Avesar J, Arye TB, Levenberg S. Frontier microfluidic techniques for short and long-term single cell analysis. Lab on a Chip. 2014;14:2161–2167. doi: 10.1039/c4lc00013g. [DOI] [PubMed] [Google Scholar]
- Bacia K, Kim SA, Schwille P. Fluorescence cross-correlation spectroscopy in living cells. Nat Methods. 2006;3 (2):83–89. doi: 10.1038/nmeth822. [DOI] [PubMed] [Google Scholar]
- Baker NV. Segregation and sedimentation of red blood cells in ultrasonic standing waves. Nature. 1972;239 (5372):398. doi: 10.1038/239398a0. [DOI] [PubMed] [Google Scholar]
- Balaban NQ, et al. Bacterial persistence as a phenotypic switch. Science. 2004;305 (5690):1622–1625. doi: 10.1126/science.1099390. [DOI] [PubMed] [Google Scholar]
- Balagadde FK, et al. Long-term monitoring of bacteria undergoing programmed population control in a microchemostat. Science. 2005;309 (5731):137–140. doi: 10.1126/science.1109173. [DOI] [PubMed] [Google Scholar]
- Baret JC, et al. Fluorescence-activated droplet sorting (FADS): efficient microfluidic cell sorting based on enzymatic activity. Lab on a Chip. 2009;9 (13):1850–1858. doi: 10.1039/b902504a. [DOI] [PubMed] [Google Scholar]
- Barinov A, et al. Synchrotron-based photoelectron microscopy. Nucl Instrum Methods Phys Res Sect A – Accel Spectrom Detect Assoc Equip. 2009;601(1–2):195–202. [Google Scholar]
- Barnett D, et al. CD4 immunophenotyping in HIV infection. Nat Rev Microbiol. 2008;6(11):S7–S15. doi: 10.1038/nrmicro1998. [DOI] [PMC free article] [PubMed] [Google Scholar]
- Bart J, et al. A microfluidic high-resolution NMR flow probe. J Am Chem Soc. 2009;131(14):5014. doi: 10.1021/ja900389x. [DOI] [PubMed] [Google Scholar]
- Bassnett S, Reinisch L, Beebe DC. Intracellular pH measurement using single excitation – dual emission fluorescence ratios. Am J Physiol. 1990;258(1):C171–C178. doi: 10.1152/ajpcell.1990.258.1.C171. [DOI] [PubMed] [Google Scholar]
- Bazou D, Kuznetsova LA, Coakley WT. Physical environment of 2-D animal cell aggregates formed in a short pathlength ultrasound standing wave trap. Ultrasound Med Biol. 2005;31(3):423–430. doi: 10.1016/j.ultrasmedbio.2004.12.007. [DOI] [PubMed] [Google Scholar]
- Bearinger JP, et al. Chemical tethering of motile bacteria to silicon surfaces. Biotechniques. 2009;46 (3):209. doi: 10.2144/000113073. [DOI] [PMC free article] [PubMed] [Google Scholar]
- Becker W, et al. Fluorescence lifetime imaging by time-correlated single-photon counting. Microsc Res Tech. 2004;63(1):58–66. doi: 10.1002/jemt.10421. [DOI] [PubMed] [Google Scholar]
- Beetz T, Jacobsen C. Soft X-ray radiation-damage studies in PMMA using a cryo-STXM. J Synchrotron Radiat. 2003;10:280–283. doi: 10.1107/s0909049503003261. [DOI] [PubMed] [Google Scholar]
- Bell L, et al. A microfluidic device for the hydrodynamic immobilisation of living fission yeast cells for super-resolution imaging. Sens Actuators B – Chem. 2014;192:36–41. doi: 10.1016/j.snb.2013.10.002. [DOI] [PMC free article] [PubMed] [Google Scholar]
- Belousov VV, et al. Genetically encoded fluorescent indicator for intracellular hydrogen peroxide. Nat Methods. 2006;3 (4):281–286. doi: 10.1038/nmeth866. [DOI] [PubMed] [Google Scholar]
- Bendall SC, et al. Single-cell mass cytometry of differential immune and drug responses across a human hematopoietic continuum. Science. 2011;332 (6030):687–696. doi: 10.1126/science.1198704. [DOI] [PMC free article] [PubMed] [Google Scholar]
- Bennett MR, Hasty J. Microfluidic devices for measuring gene network dynamics in single cells. Nat Rev Genet. 2009;10(9):628–638. doi: 10.1038/nrg2625. [DOI] [PMC free article] [PubMed] [Google Scholar]
- Bennett MR, et al. Metabolic gene regulation in a dynamically changing environment. Nature. 2008;454 (7208):1119–1122. doi: 10.1038/nature07211. [DOI] [PMC free article] [PubMed] [Google Scholar]
- Binder D, et al. Light-responsive control of bacterial gene expression: precise triggering of the lac promoter activity using photocaged IPTG. Integr Biol. 2014;6:755–765. doi: 10.1039/c4ib00027g. http://dx.doi.org/10.1039/C4IB00027G. [DOI] [PubMed] [Google Scholar]
- Blake WJ, et al. Noise in eukaryotic gene expression. Nature. 2003;422 (6932):633–637. doi: 10.1038/nature01546. [DOI] [PubMed] [Google Scholar]
- Borland LM, et al. Chemical analysis of single cells. Annu Rev Anal Chem. 2008;1:191–227. doi: 10.1146/annurev.anchem.1.031207.113100. [DOI] [PubMed] [Google Scholar]
- Bottier C, et al. Dynamic measurement of the height and volume of migrating cells by a novel fluorescence microscopy technique. Lab on a Chip. 2011;11 (22):3855–3863. doi: 10.1039/c1lc20807a. [DOI] [PubMed] [Google Scholar]
- Braschler T, et al. Gentle cell trapping and release on a microfluidic chip by in situ alginate hydrogel formation. Lab on a Chip. 2005;5 (5):553–559. doi: 10.1039/b417604a. [DOI] [PubMed] [Google Scholar]
- Bratosin D, et al. Novel fluorescence assay using calcein-AM for the determination of human erythrocyte viability and aging. Cytometry Part A. 2005;66A (1):78–84. doi: 10.1002/cyto.a.20152. [DOI] [PubMed] [Google Scholar]
- Brauchle E, Schenke-Layland K. Raman spectroscopy in biomedicine – non-invasive in vitro analysis of cells and extracellular matrix components in tissues. Biotechnol J. 2013;8(3):288–297. doi: 10.1002/biot.201200163. [DOI] [PMC free article] [PubMed] [Google Scholar]
- Brehm-Stecher BF, Johnson EA. Single-cell microbiology: tools, technologies, and applications. Microbiol Mol Biol Rev. 2004;68(3):538. doi: 10.1128/MMBR.68.3.538-559.2004. [DOI] [PMC free article] [PubMed] [Google Scholar]
- Brouzes E, et al. Droplet microfluidic technology for single-cell high-throughput screening. Proc Natl Acad Sci USA. 2009;106 (34):14195–14200. doi: 10.1073/pnas.0903542106. [DOI] [PMC free article] [PubMed] [Google Scholar]
- Bryan AK, et al. Continuous and long-term volume measurements with a commercial Coulter counter. PLoS One. 2012;7 (1):1–8. doi: 10.1371/journal.pone.0029866. [DOI] [PMC free article] [PubMed] [Google Scholar]
- Burg TP, et al. Weighing of biomolecules, single cells and single nanoparticles in fluid. Nature. 2007;446 (7139):1066–1069. doi: 10.1038/nature05741. [DOI] [PubMed] [Google Scholar]
- Cai L, Friedman N, Xie XS. Stochastic protein expression in individual cells at the single molecule level. Nature. 2006;440 (7082):358–362. doi: 10.1038/nature04599. [DOI] [PubMed] [Google Scholar]
- Camden JP, et al. Controlled plasmonic nanostructures for surface-enhanced spectroscopy and sensing. Acc Chem Res. 2008;41(12):1653–1661. doi: 10.1021/ar800041s. [DOI] [PubMed] [Google Scholar]
- Carlquist M, et al. Physiological heterogeneities in microbial populations and implications for physical stress tolerance. Microb Cell Fact. 2012;11:1–13. doi: 10.1186/1475-2859-11-94. [DOI] [PMC free article] [PubMed] [Google Scholar]
- Carlson RH, et al. Self-sorting of white blood cells in a lattice. Phys Rev Lett. 1997;79(11):2149–2152. [Google Scholar]
- Chalfie M, et al. Green fluorescent protein as a marker for gene expression. Science. 1994;263 (5148):802–805. doi: 10.1126/science.8303295. [DOI] [PubMed] [Google Scholar]
- Chan KLA, Kazarian SG. New opportunities in micro- and macro-attenuated total reflection infrared spectroscopic imaging: spatial resolution and sampling versatility. Appl Spectrosc. 2003;57(4):381–389. doi: 10.1366/00037020360625907. [DOI] [PubMed] [Google Scholar]
- Charnley M, et al. Integration column: microwell arrays for mammalian cell culture. Integr Biol. 2009;1(11–12):625–634. doi: 10.1039/b918172p. [DOI] [PubMed] [Google Scholar]
- Chen D, Huang S-s, Li Y-Q. Real-time detection of kinetic germination and heterogeneity of single Bacillus spores by laser tweezers Raman spectroscopy. Anal Chem. 2006;78(19):6936–6941. doi: 10.1021/ac061090e. [DOI] [PubMed] [Google Scholar]
- Cheng JX, Xie XS. Coherent anti-Stokes Raman scattering microscopy: instrumentation, theory, and applications. J Phys Chem B. 2004;108 (3):827–840. [Google Scholar]
- Chiou PY, Ohta AT, Wu MC. Massively parallel manipulation of single cells and microparticles using optical images. Nature. 2005;436 (7049):370–372. doi: 10.1038/nature03831. [DOI] [PubMed] [Google Scholar]
- Chumnanpuen P, et al. Lipid biosynthesis monitored at the single-cell level in Saccharomyces cerevisiae. Biotechnol J. 2012;7(5):594–601. doi: 10.1002/biot.201000386. [DOI] [PubMed] [Google Scholar]
- Connell JL, et al. Probing prokaryotic social behaviors with bacterial “Lobster Traps”. Mbio. 2010;1:4. doi: 10.1128/mBio.00202-10. [DOI] [PMC free article] [PubMed] [Google Scholar]
- Cookson S, et al. Monitoring dynamics of single-cell gene expression over multiple cell cycles. Mol Syst Biol. 2005;1:1–6. doi: 10.1038/msb4100032. [DOI] [PMC free article] [PubMed] [Google Scholar]
- Corbin EA, et al. Micro-patterning of mammalian cells on suspended MEMS resonant sensors for long-term growth measurements. Lab on a Chip. 2014;14 (8):1401–1404. doi: 10.1039/c3lc51217g. [DOI] [PMC free article] [PubMed] [Google Scholar]
- Cosson S, Lutolf MP. Hydrogel microfluidics for the patterning of pluripotent stem cells. Sci Rep. 2014;4:1–6. doi: 10.1038/srep04462. [DOI] [PMC free article] [PubMed] [Google Scholar]
- Cotte Y, et al. Marker-free phase nanoscopy. Nat Photon. 2013;7(2):113–117. [Google Scholar]
- Coulter WH. High speed automatic blood cell counter and cell size analyzer. Proc Natl Electron Conf. 1956;12:1034–1040. [Google Scholar]
- Croslandtaylor PJ. A device for counting small particles suspended in a fluid through a tube. Nature. 1953;171 (4340):37–38. doi: 10.1038/171037b0. [DOI] [PubMed] [Google Scholar]
- Cui X, et al. Lensless high-resolution on-chip optofluidic microscopes for Caenorhabditis elegans and cell imaging. Proc Natl Acad Sci USA. 2008;105 (31):10670–10675. doi: 10.1073/pnas.0804612105. [DOI] [PMC free article] [PubMed] [Google Scholar]
- de Mello AJ, Beard N. Dealing with ‘real’ samples: sample pre-treatment in microfluidic systems. Lab on a Chip. 2003;3 (1):11N–19N. doi: 10.1039/b301019h. [DOI] [PubMed] [Google Scholar]
- Dean KM, Palmer AE. Advances in fluorescence labeling strategies for dynamic cellular imaging. Nat Chem Biol. 2014;10:512–523. doi: 10.1038/nchembio.1556. [DOI] [PMC free article] [PubMed] [Google Scholar]
- Denervaud N, et al. A chemostat array enables the spatio-temporal analysis of the yeast proteome. Proc Natl Acad Sci USA. 2013;110 (39):15842–15847. doi: 10.1073/pnas.1308265110. [DOI] [PMC free article] [PubMed] [Google Scholar]
- Deniset-Besseau A, et al. Monitoring triacylglycerols accumulation by atomic force microscopy based infrared spectroscopy in Streptomyces species for biodiesel applications. J Phys Chem Lett. 2014;5(4):654–658. doi: 10.1021/jz402393a. [DOI] [PubMed] [Google Scholar]
- Denk W, Strickler JH, Webb WW. 2-Photon laser scanning fluorescence microscopy. Science. 1990;248 (4951):73–76. doi: 10.1126/science.2321027. [DOI] [PubMed] [Google Scholar]
- Deutsch M, et al. A novel miniature cell retainer for correlative high-content analysis of individual untethered non-adherent cells. Lab on a Chip. 2006;6 (8):995–1000. doi: 10.1039/b603961h. [DOI] [PubMed] [Google Scholar]
- Di Carlo D, Wu LY, Lee LP. Dynamic single cell culture array. Lab on a Chip. 2006;6 (11):1445–1449. doi: 10.1039/b605937f. [DOI] [PubMed] [Google Scholar]
- Didar TF, Tabrizian M. Adhesion based detection, sorting and enrichment of cells in microfluidic Lab-on-Chip devices. Lab on a Chip. 2010;10 (22):3043–3053. doi: 10.1039/c0lc00130a. [DOI] [PubMed] [Google Scholar]
- Digman MA, et al. The phasor approach to fluorescence lifetime imaging analysis. Biophys J. 2008;94(2):L14–L16. doi: 10.1529/biophysj.107.120154. [DOI] [PMC free article] [PubMed] [Google Scholar]
- Ding X, et al. On-chip manipulation of single microparticles, cells, and organisms using surface acoustic waves. Proc Natl Acad Sci USA. 2012;109 (28):11105–11109. doi: 10.1073/pnas.1209288109. [DOI] [PMC free article] [PubMed] [Google Scholar]
- Doudkine A, et al. Nuclear texture measurements in image cytometry. Pathologica. 1995;87 (3):286–299. [PubMed] [Google Scholar]
- Doughty DM, et al. Probing the subcellular localization of hopanoid lipids in bacteria using NanoSIMS. PLoS One. 2014;9 (1):1–8. doi: 10.1371/journal.pone.0084455. [DOI] [PMC free article] [PubMed] [Google Scholar]
- Douglas ES, et al. DNA-barcode directed capture and electrochemical metabolic analysis of single mammalian cells on a microelectrode array. Lab on a Chip. 2009;9 (14):2010–2015. doi: 10.1039/b821690h. [DOI] [PMC free article] [PubMed] [Google Scholar]
- Dragavon J, et al. A cellular isolation system for real-time single-cell oxygen consumption monitoring. J R Soc Interface. 2008;5:S151–S159. doi: 10.1098/rsif.2008.0106.focus. [DOI] [PMC free article] [PubMed] [Google Scholar]
- Dusny C, et al. Isolated microbial single cells and resulting micropopulations grow faster in controlled environments. Appl Environ Microbiol. 2012;78(19):7132–7136. doi: 10.1128/AEM.01624-12. [DOI] [PMC free article] [PubMed] [Google Scholar]
- Edd JF, et al. Controlled encapsulation of single-cells into monodisperse picolitre drops. Lab on a Chip. 2008;8 (8):1262–1264. doi: 10.1039/b805456h. [DOI] [PMC free article] [PubMed] [Google Scholar]
- Eriksson E, et al. Optical manipulation and microfluidics for studies of single cell dynamics. J Opt A – Pure Appl Opt. 2007;9(8):S113–S121. [Google Scholar]
- Eun Y-J, et al. Encapsulating bacteria in agarose microparticles using microfluidics for high-throughput cell analysis and isolation. ACS Chem Biol. 2011;6(3):260–266. doi: 10.1021/cb100336p. [DOI] [PMC free article] [PubMed] [Google Scholar]
- Evander M, et al. Noninvasive acoustic cell trapping in a microfluidic perfusion system for online bioassays. Anal Chem. 2007;79(7):2984–2991. doi: 10.1021/ac061576v. [DOI] [PubMed] [Google Scholar]
- Eyer K, et al. A microchamber array for single cell isolation and analysis of intracellular biomolecules. Lab on a Chip. 2012;12 (4):765–772. doi: 10.1039/c2lc20876h. [DOI] [PubMed] [Google Scholar]
- Eyer K, et al. Implementing enzyme-linked immunosorbent assays on a microfluidic chip to quantify intracellular molecules in single cells. Anal Chem. 2013;85(6):3280–3287. doi: 10.1021/ac303628j. [DOI] [PubMed] [Google Scholar]
- Falconnet D, et al. High-throughput tracking of single yeast cells in a microfluidic imaging matrix. Lab on a Chip. 2011;11 (3):466–473. doi: 10.1039/c0lc00228c. [DOI] [PMC free article] [PubMed] [Google Scholar]
- Fan HC, et al. Whole-genome molecular haplotyping of single cells. Nat Biotechnol. 2011;29(1):51. doi: 10.1038/nbt.1739. [DOI] [PMC free article] [PubMed] [Google Scholar]
- Freudiger CW, et al. Label-free biomedical imaging with high sensitivity by stimulated Raman scattering microscopy. Science. 2008;322 (5909):1857–1861. doi: 10.1126/science.1165758. [DOI] [PMC free article] [PubMed] [Google Scholar]
- Friend J, Yeo LY. Microscale acoustofluidics: microfluidics driven via acoustics and ultrasonics. Rev Mod Phys. 2011;83(2):647–704. [Google Scholar]
- Fu AY, et al. A microfabricated fluorescence-activated cell sorter. Nat Biotechnol. 1999;17(11):1109–1111. doi: 10.1038/15095. [DOI] [PubMed] [Google Scholar]
- Fu D, et al. Quantitative chemical imaging with multiplex stimulated Raman scattering microscopy. J Am Chem Soc. 2012;134(8):3623–3626. doi: 10.1021/ja210081h. [DOI] [PMC free article] [PubMed] [Google Scholar]
- Fu D, et al. Imaging the intracellular distribution of tyrosine kinase inhibitors in living cells with quantitative hyperspectral stimulated Raman scattering. Nat Chem. 2014;6:614–622. doi: 10.1038/nchem.1961. [DOI] [PMC free article] [PubMed] [Google Scholar]
- Gach PC, et al. Isolation and manipulation of living adherent cells by micromolded magnetic rafts. Biomicrofluidics. 2011;5(3) doi: 10.1063/1.3608133. [DOI] [PMC free article] [PubMed] [Google Scholar]
- Gaffield MA, Betz WJ. Imaging synaptic vesicle exocytosis and endocytosis with FM dyes. Nat Protoc. 2006;1(6):2916–2921. doi: 10.1038/nprot.2006.476. [DOI] [PubMed] [Google Scholar]
- Galler K, et al. Making a big thing of a small cell – recent advances in single cell analysis. Analyst. 2014;139 (6):1237–1273. doi: 10.1039/c3an01939j. [DOI] [PubMed] [Google Scholar]
- Garstecki P, et al. Formation of droplets and bubbles in a microfluidic T-junction – scaling and mechanism of break-up. Lab on a Chip. 2006;6 (3):437–446. doi: 10.1039/b510841a. [DOI] [PubMed] [Google Scholar]
- Gawad S, et al. Dielectric spectroscopy in a micromachined flow cytometer: theoretical and practical considerations. Lab on a Chip. 2004;4 (3):241–251. doi: 10.1039/b313761a. [DOI] [PubMed] [Google Scholar]
- Giepmans BNG, et al. Review – the fluorescent toolbox for assessing protein location and function. Science. 2006;312 (5771):217–224. doi: 10.1126/science.1124618. [DOI] [PubMed] [Google Scholar]
- Gisselson LA, Graneli E, Pallon J. Variation in cellular nutrient status within a population of Dinophysis norvegica (Dinophyceae) growing in situ: single-cell elemental analysis by use of a nuclear microprobe. Limnol Oceanogr. 2001;46(5):1237–1242. [Google Scholar]
- Gobaa S, et al. Artificial niche microarrays for probing single stem cell fate in high throughput. Nat Methods. 2011;8 (11):949–955. doi: 10.1038/nmeth.1732. [DOI] [PubMed] [Google Scholar]
- Godin M, et al. Using buoyant mass to measure the growth of single cells. Nat Methods. 2010;7 (5):387–390. doi: 10.1038/nmeth.1452. [DOI] [PMC free article] [PubMed] [Google Scholar]
- Goff KL, Quaroni L, Wilson KE. Measurement of metabolite formation in single living cells of Chlamydomonas reinhardtii using synchrotron Fourier-Transform Infrared spectromicroscopy. Analyst. 2009;134 (11):2216–2219. doi: 10.1039/b915810c. [DOI] [PubMed] [Google Scholar]
- Govender T, et al. BODIPY staining, an alternative to the Nile Red fluorescence method for the evaluation of intracellular lipids in microalgae. Bioresour Technol. 2012;114:507–511. doi: 10.1016/j.biortech.2012.03.024. [DOI] [PubMed] [Google Scholar]
- Grant SC, et al. NMR spectroscopy of single neurons. Magn Reson Med. 2000;44(1):19–22. doi: 10.1002/1522-2594(200007)44:1<19::aid-mrm4>3.0.co;2-f. [DOI] [PubMed] [Google Scholar]
- Gratton E, et al. Fluorescence lifetime imaging for the two-photon microscope: time-domain and frequency-domain methods. J Biomed Opt. 2003;8(3):381–390. doi: 10.1117/1.1586704. [DOI] [PubMed] [Google Scholar]
- Groisman A, et al. A microfluidic chemostat for experiments with bacterial and yeast cells. Nat Methods. 2005;2 (9):685–689. doi: 10.1038/nmeth784. [DOI] [PubMed] [Google Scholar]
- Gruenberger A, et al. A disposable picolitre bioreactor for cultivation and investigation of industrially relevant bacteria on the single cell level. Lab on a Chip. 2012;12 (11):2060–2068. doi: 10.1039/c2lc40156h. [DOI] [PubMed] [Google Scholar]
- Grünberger A, Wiechert W, Kohlheyer D. Single-cell microfluidics: opportunity for bioprocess development. Curr Opin Biotechnol. 2014;29:15–23. doi: 10.1016/j.copbio.2014.02.008. [DOI] [PubMed] [Google Scholar]
- Guillemot G, et al. Evaluating the adhesion force between Saccharomyces cerevisiae yeast cells and polystyrene from shear-flow induced detachment experiments. Chem Eng Res Des. 2007;85(A6):800–807. [Google Scholar]
- Guo MT, et al. Droplet microfluidics for high-throughput biological assays. Lab on a Chip. 2012;12 (12):2146–2155. doi: 10.1039/c2lc21147e. [DOI] [PubMed] [Google Scholar]
- Gustafsson MGL. Nonlinear structured-illumination microscopy: wide-field fluorescence imaging with theoretically unlimited resolution. Proc Natl Acad Sci USA. 2005;102 (37):13081–13086. doi: 10.1073/pnas.0406877102. [DOI] [PMC free article] [PubMed] [Google Scholar]
- Hafi N, et al. Fluorescence nanoscopy by polarization modulation and polarization angle narrowing. Nat Methods. 2014;11 (5):579–584. doi: 10.1038/nmeth.2919. [DOI] [PubMed] [Google Scholar]
- He B, Tan L, Regnier F. Microfabricated filters for microfluidic analytical systems. Anal Chem. 1999;71(7):1464–1468. doi: 10.1021/ac981010+. [DOI] [PubMed] [Google Scholar]
- He MY, et al. Selective encapsulation of single cells and subcellular organelles into picoliter- and femtoliter-volume droplets. Anal Chem. 2005;77(6):1539–1544. doi: 10.1021/ac0480850. [DOI] [PubMed] [Google Scholar]
- Heinemann M, Zenobi R. Single cell metabolomics. Curr Opin Biotechnol. 2011;22(1):26–31. doi: 10.1016/j.copbio.2010.09.008. [DOI] [PubMed] [Google Scholar]
- Hellerer T, et al. Monitoring of lipid storage in Caenorhabditis elegans using coherent anti-Stokes Raman scattering (CARS) microscopy. Proc Natl Acad Sci USA. 2007;104 (37):14658–14663. doi: 10.1073/pnas.0703594104. [DOI] [PMC free article] [PubMed] [Google Scholar]
- Helmstetter CE. Description of a baby machine for Saccharomyces-cervisiae. New Biol. 1991;3(11):1089–1096. [PubMed] [Google Scholar]
- Helmstetter CE, et al. Improved bacterial baby machine – applications to Escherichia-coli K12. J Bacteriol. 1992;174(11):3445–3449. doi: 10.1128/jb.174.11.3445-3449.1992. [DOI] [PMC free article] [PubMed] [Google Scholar]
- Heo J, et al. A microfluidic bioreactor based on hydrogel-entrapped E. coli: cell viability, lysis, and intracellular enzyme reactions. Anal Chem. 2003;75(1):22–26. doi: 10.1021/ac0259717. [DOI] [PubMed] [Google Scholar]
- Herms A, et al. Cell-to-cell heterogeneity in lipid droplets suggests a mechanism to reduce lipotoxicity. Curr Biol. 2013;23(15):1489–1496. doi: 10.1016/j.cub.2013.06.032. [DOI] [PMC free article] [PubMed] [Google Scholar]
- Hildebrand EM. Infectivity of the fire-blight organism. Phytopathology. 1937;27:850–852. [Google Scholar]
- Hildebrand EM. Techniques for the isolation of single microorganisms II. Bot Rev. 1950;16(4):181–207. [Google Scholar]
- Hitchcock AP, et al. Soft X-ray spectromicroscopy of biological and synthetic polymer systems. J Electron Spectrosc Relat Phenom. 2005;144:259–269. [Google Scholar]
- Holman H-YN, et al. Real-time chemical imaging of bacterial activity in biofilms using open-channel microfluidics and synchrotron FTIR spectromicroscopy. Anal Chem. 2009;81(20):8564–8570. doi: 10.1021/ac9015424. [DOI] [PubMed] [Google Scholar]
- Hong J, Edel JB, deMello AJ. Micro- and nanofluidic systems for high-throughput biological screening. Drug Discov Today. 2009;14 (3–4):134–146. doi: 10.1016/j.drudis.2008.10.001. [DOI] [PubMed] [Google Scholar]
- Hong S, Pan Q, Lee LP. Single-cell level co-culture platform for intercellular communication. Integr Biol. 2012;4(4):374–380. doi: 10.1039/c2ib00166g. [DOI] [PubMed] [Google Scholar]
- Hua SZ, Pennell T. A microfluidic chip for real-time studies of the volume of single cells. Lab on a Chip. 2009;9 (2):251–256. doi: 10.1039/b806003g. [DOI] [PMC free article] [PubMed] [Google Scholar]
- Huang B, Bates M, Zhuang X. Super-resolution fluorescence microscopy. Annu Rev Biochem. 2009;78:993–1016. doi: 10.1146/annurev.biochem.77.061906.092014. [DOI] [PMC free article] [PubMed] [Google Scholar]
- Huang KW, et al. Microfluidic integrated optoelectronic tweezers for single-cell preparation and analysis. Lab on a Chip. 2013;13 (18):3721–3727. doi: 10.1039/c3lc50607j. [DOI] [PubMed] [Google Scholar]
- Huang NT, et al. Recent advancements in optofluidics-based single-cell analysis: optical on-chip cellular manipulation, treatment, and property detection. Lab on a Chip. 2014;14 (7):1230–1245. doi: 10.1039/c3lc51211h. [DOI] [PubMed] [Google Scholar]
- Hubbell JA. Biomaterials in tissue engineering. Bio-Technology. 1995;13 (6):565–576. doi: 10.1038/nbt0695-565. [DOI] [PubMed] [Google Scholar]
- Huberts DHEW, et al. Construction and use of a microfluidic dissection platform for long-term imaging of cellular processes in budding yeast. Nat Protoc. 2013;8(6):1019–1027. doi: 10.1038/nprot.2013.060. [DOI] [PubMed] [Google Scholar]
- Huebner A, et al. Quantitative detection of protein expression in single cells using droplet microfluidics. Chem Commun. 2007;12:1218–1220. doi: 10.1039/b618570c. [DOI] [PubMed] [Google Scholar]
- Hughes MP. Strategies for dielectrophoretic separation in laboratory-on-a-chip systems. Electrophoresis. 2002;23 (16):2569–2582. doi: 10.1002/1522-2683(200208)23:16<2569::AID-ELPS2569>3.0.CO;2-M. [DOI] [PubMed] [Google Scholar]
- Huh D, et al. Microfluidics for flow cytometric analysis of cells and particles. Physiol Meas. 2005;26(3):R73–R98. doi: 10.1088/0967-3334/26/3/R02. [DOI] [PubMed] [Google Scholar]
- Hunt NC, Grover LM. Cell encapsulation using biopolymer gels for regenerative medicine. Biotechnol Lett. 2010;32(6):733–742. doi: 10.1007/s10529-010-0221-0. [DOI] [PubMed] [Google Scholar]
- Hunt TP, Issadore D, Westervelt RM. Integrated circuit/microfluidic chip to programmably trap and move cells and droplets with dielectrophoresis. Lab on a Chip. 2008;8 (1):81–87. doi: 10.1039/b710928h. [DOI] [PubMed] [Google Scholar]
- Ibanez AJ, et al. Mass spectrometry-based metabolomics of single yeast cells. Proc National Acad Sci USA. 2013;110 (22):8790–8794. doi: 10.1073/pnas.1209302110. [DOI] [PMC free article] [PubMed] [Google Scholar]
- Ino K, et al. Cell culture arrays using magnetic force-based cell patterning for dynamic single cell analysis. Lab on a Chip. 2008;8 (1):134–142. doi: 10.1039/b712330b. [DOI] [PubMed] [Google Scholar]
- Jang K, et al. Surface modification by 2-methacryloyloxyethyl phosphorylcholine coupled to a photolabile linker for cell micropatterning. Biomaterials. 2009;30 (7):1413–1420. doi: 10.1016/j.biomaterials.2008.11.013. [DOI] [PubMed] [Google Scholar]
- Jang K, et al. Single-cell attachment and culture method using a photo-chemical reaction in a closed microfluidic system. Biomicrofluidics. 2010;4 (3):1–8. doi: 10.1063/1.3494287. [DOI] [PMC free article] [PubMed] [Google Scholar]
- Jeorrett AH, et al. Optoelectronic tweezers system for single cell manipulation and fluorescence imaging of live immune cells. Opt Express. 2014;22 (2):1372–1380. doi: 10.1364/OE.22.001372. [DOI] [PubMed] [Google Scholar]
- Jiang XY, et al. Electrochemical desorption of self-assembled monolayers noninvasively releases patterned cells from geometrical confinements. J Am Chem Soc. 2003;125(9):2366–2367. doi: 10.1021/ja029485c. [DOI] [PubMed] [Google Scholar]
- Kalisky T, Quake SR. Single-cell genomics. Nat Methods. 2011;8 (4):311–314. doi: 10.1038/nmeth0411-311. [DOI] [PubMed] [Google Scholar]
- Kalyuzhnaya MG, Lidstrom ME, Chistoserdova L. Real-time detection of actively metabolizing microbes by redox sensing as applied to methylotroph populations in Lake Washington. ISME J. 2008;2(7):696–706. doi: 10.1038/ismej.2008.32. [DOI] [PubMed] [Google Scholar]
- Kamei KI, et al. Microfluidic image cytometry for quantitative single-cell profiling of human pluripotent stem cells in chemically defined conditions. Lab on a Chip. 2010;10 (9):1113–1119. doi: 10.1039/b922884e. [DOI] [PMC free article] [PubMed] [Google Scholar]
- Kang A, et al. Cell encapsulation via microtechnologies. Biomaterials. 2014;35 (9):2651–2663. doi: 10.1016/j.biomaterials.2013.12.073. [DOI] [PubMed] [Google Scholar]
- Karimi A, Yazdi S, Ardekani AM. Hydrodynamic mechanisms of cell and particle trapping in microfluidics. Biomicrofluidics. 2013;7 (2):1–23. doi: 10.1063/1.4799787. [DOI] [PMC free article] [PubMed] [Google Scholar]
- Kaufmann BB, et al. Heritable stochastic switching revealed by single-cell genealogy. PLoS Biol. 2007;5(9):1973–1980. doi: 10.1371/journal.pbio.0050239. [DOI] [PMC free article] [PubMed] [Google Scholar]
- Kaya T, et al. Monitoring the cellular activity of a cultured single cell by scanning electrochemical microscopy (SECM). A comparison with fluorescence viability monitoring. Biosens Bioelectron. 2003;18(11):1379–1383. doi: 10.1016/s0956-5663(03)00083-6. [DOI] [PubMed] [Google Scholar]
- Kazarian SG, Chan KLA. ATR–FTIR spectroscopic imaging: recent advances and applications to biological systems. Analyst. 2013;138 (7):1940–1951. doi: 10.1039/c3an36865c. [DOI] [PubMed] [Google Scholar]
- Keller PJ, et al. Fast, high-contrast imaging of animal development with scanned light sheet-based structured-illumination microscopy. Nat Methods. 2010;7 (8):637–642. doi: 10.1038/nmeth.1476. [DOI] [PMC free article] [PubMed] [Google Scholar]
- Kentner D, Sourjik V. Use of fluorescence microscopy to study intracellular signaling in bacteria. In: Gottesman S, Harwood CS, editors. Annual Review of Microbiology. Vol. 64. 2010. pp. 373–390. [DOI] [PubMed] [Google Scholar]
- Khademhosseini A, et al. Molded polyethylene glycol microstructures for capturing cells within microfluidic channels. Lab on a Chip. 2004;4 (5):425–430. doi: 10.1039/b404842c. [DOI] [PubMed] [Google Scholar]
- Khorshidi MA, et al. Automated analysis of dynamic behavior of single cells in picoliter droplets. Lab on a Chip. 2014;14 (5):931–937. doi: 10.1039/c3lc51136g. [DOI] [PubMed] [Google Scholar]
- Khoshmanesh K, et al. Dielectrophoretic platforms for bio-microfluidic systems. Biosens Bioelectron. 2011;26(5):1800–1814. doi: 10.1016/j.bios.2010.09.022. [DOI] [PubMed] [Google Scholar]
- Kim D, et al. Electroanalytical eavesdropping on single cell communication. Anal Chem. 2011;83(19):7242–7249. doi: 10.1021/ac200666c. [DOI] [PMC free article] [PubMed] [Google Scholar]
- Kim H, Lee S, Kim J. Hydrodynamic trap-and-release of single particles using dual-function elastomeric valves: design, fabrication, and characterization. Microfluid Nanofluid. 2012;13(5):835–844. [Google Scholar]
- Kim MC, et al. Programmed trapping of individual bacteria using micrometre-size sieves. Lab on a Chip. 2011;11 (6):1089–1095. doi: 10.1039/c0lc00362j. [DOI] [PubMed] [Google Scholar]
- Kim MJ, et al. High-content screening of drug-induced cardiotoxicity using quantitative single cell imaging cytometry on microfluidic device. Lab on a Chip. 2011;11 (1):104–114. doi: 10.1039/c0lc00110d. [DOI] [PubMed] [Google Scholar]
- Kintses B, et al. Microfluidic droplets: new integrated workflows for biological experiments. Curr Opin Chem Biol. 2010;14(5):548–555. doi: 10.1016/j.cbpa.2010.08.013. [DOI] [PubMed] [Google Scholar]
- Kobel SA, et al. Automated analysis of single stem cells in microfluidic traps. Lab on a Chip. 2012;12 (16):2843–2849. doi: 10.1039/c2lc40317j. [DOI] [PubMed] [Google Scholar]
- Koester S, et al. Drop-based microfluidic devices for encapsulation of single cells. Lab on a Chip. 2008;8 (7):1110–1115. doi: 10.1039/b802941e. [DOI] [PubMed] [Google Scholar]
- Kohlwein SD. The beauty of the yeast: live cell microscopy at the limits of optical resolution. Microsc Res Tech. 2000;51(6):511–529. doi: 10.1002/1097-0029(20001215)51:6<511::AID-JEMT3>3.0.CO;2-Y. [DOI] [PubMed] [Google Scholar]
- Koide M, et al. An electrochemical device with microwells for determining the photosynthetic activity of a single Cyanobacterium. Sens Actuators B –Chem. 2011;153(2):474–478. [Google Scholar]
- Koide M, et al. Microfluidic devices for electrochemical measurement of photosynthetic activity of Cyanobacteria microcystis cells. Anal Sci. 2012;28(1):69–72. doi: 10.2116/analsci.28.69. [DOI] [PubMed] [Google Scholar]
- Konopka MC, et al. Single cell methods for methane oxidation analysis. Methods Enzymol. 2011;495:149–166. doi: 10.1016/B978-0-12-386905-0.00010-3. [DOI] [PubMed] [Google Scholar]
- Kovac JR, Voldman J. Intuitive, image-based cell sorting using optofluidic cell sorting. Anal Chem. 2007;79(24):9321–9330. doi: 10.1021/ac071366y. [DOI] [PMC free article] [PubMed] [Google Scholar]
- Krafft C, et al. Studies on stress-induced changes at the subcellular level by Raman microspectroscopic mapping. Anal Chem. 2006;78(13):4424–4429. doi: 10.1021/ac060205b. [DOI] [PubMed] [Google Scholar]
- Kraft ML, et al. Phase separation of lipid membranes analyzed with high-resolution secondary ion mass spectrometry. Science. 2006;313 (5795):1948–1951. doi: 10.1126/science.1130279. [DOI] [PubMed] [Google Scholar]
- Kuhn P, et al. A facile protocol for the immobilisation of vesicles, virus particles, bacteria, and yeast cells. Integr Biol. 2012;4(12):1550–1555. doi: 10.1039/c2ib20181j. [DOI] [PubMed] [Google Scholar]
- Kuimova MK, Chan KLA, Kazarian SG. Chemical imaging of live cancer cells in the natural aqueous environment. Appl Spectrosc. 2009;63(2):164–171. doi: 10.1366/000370209787391969. [DOI] [PubMed] [Google Scholar]
- Kamentsk LA, Melamed MR, Derman H. Spectrophotometer – new instrument for ultrarapid cell analysis. Science. 1965;150 (3696):630. doi: 10.1126/science.150.3696.630. [DOI] [PubMed] [Google Scholar]
- Labhsetwar P, et al. Heterogeneity in protein expression induces metabolic variability in a modeled Escherichia coli population. Proc Natl Acad Sci USA. 2013;110 (34):14006–14011. doi: 10.1073/pnas.1222569110. [DOI] [PMC free article] [PubMed] [Google Scholar]
- Lagus TP, Edd JF. A review of the theory, methods and recent applications of high-throughput single-cell droplet microfluidics. J Phys D – Appl Phys. 2013;46(11):1–21. [Google Scholar]
- Lakowicz JR. Principles of Fluorescence Spectroscopy. 3. Springer Science; New York: 2006. [Google Scholar]
- Lakowicz JR, et al. Fluorescence lifetime imaging. Anal Biochem. 1992;202(2):316–330. doi: 10.1016/0003-2697(92)90112-k. [DOI] [PMC free article] [PubMed] [Google Scholar]
- Lama RD, et al. Ultrafast detection and quantification of brain signaling molecules with carbon fiber microelectrodes. Anal Chem. 2012;84(19):8096–8101. doi: 10.1021/ac301670h. [DOI] [PubMed] [Google Scholar]
- Lau AY, Lee LP, Chan JW. An integrated optofluidic platform for Raman-activated cell sorting. Lab on a Chip. 2008;8 (7):1116–1120. doi: 10.1039/b803598a. [DOI] [PubMed] [Google Scholar]
- Lecault V, et al. High-throughput analysis of single hematopoietic stem cell proliferation in microfluidic cell culture arrays. Nat Methods. 2011;8 (7):581–586. doi: 10.1038/nmeth.1614. [DOI] [PubMed] [Google Scholar]
- Lecault V, et al. Microfluidic single cell analysis: from promise to practice. Curr Opin Chem Biol. 2012;16(3–4):381–390. doi: 10.1016/j.cbpa.2012.03.022. [DOI] [PubMed] [Google Scholar]
- Lechene CP, et al. Quantitative imaging of nitrogen fixation by individual bacteria within animal cells. Science. 2007;317 (5844):1563–1566. doi: 10.1126/science.1145557. [DOI] [PubMed] [Google Scholar]
- Lee PJ, et al. A microfluidic system for dynamic yeast cell imaging. Biotechniques. 2008;44 (1):91–95. doi: 10.2144/000112673. [DOI] [PubMed] [Google Scholar]
- Lee SC, et al. Subcellular in vivo H-1MR spectroscopy of Xenopus laevis oocytes. Biophys J. 2006;90(5):1797–1803. doi: 10.1529/biophysj.105.073502. [DOI] [PMC free article] [PubMed] [Google Scholar]
- Lee SS, et al. Whole lifespan microscopic observation of budding yeast aging through a microfluidic dissection platform. Proc Natl Acad Sci USA. 2012;109 (13):4916–4920. doi: 10.1073/pnas.1113505109. [DOI] [PMC free article] [PubMed] [Google Scholar]
- Leung K, et al. A programmable droplet-based microfluidic device applied to multiparameter analysis of single microbes and microbial communities. Proc Natl Acad Sci USA. 2012;109 (20):7665–7670. doi: 10.1073/pnas.1106752109. [DOI] [PMC free article] [PubMed] [Google Scholar]
- Li M, et al. Rapid resonance Raman microspectroscopy to probe carbon dioxide fixation by single cells in microbial communities. ISME J. 2012;6(4):875–885. doi: 10.1038/ismej.2011.150. [DOI] [PMC free article] [PubMed] [Google Scholar]
- Lichtman JW, Conchello JA. Fluorescence microscopy. Nat Methods. 2005;2 (12):910–919. doi: 10.1038/nmeth817. [DOI] [PubMed] [Google Scholar]
- Lieu VH, House TA, Schwartz DT. Hydrodynamic tweezers: impact of design geometry on flow and microparticle trapping. Anal Chem. 2012;84(4):1963–1968. doi: 10.1021/ac203002z. [DOI] [PubMed] [Google Scholar]
- Lincoln B, et al. Reconfigurable microfluidic integration of a dual-beam laser trap with biomedical applications. Biomed Microdevices. 2007;9 (5):703–710. doi: 10.1007/s10544-007-9079-x. [DOI] [PubMed] [Google Scholar]
- Liu K, et al. Cell culture chip using low-shear mass transport. Langmuir. 2008;24 (11):5955–5960. doi: 10.1021/la8003917. [DOI] [PubMed] [Google Scholar]
- Liu T-Y, et al. Functionalized arrays of Raman-enhancing nanoparticles for capture and culture-free analysis of bacteria in human blood. Nature Communications. 2011:2. doi: 10.1038/ncomms1546. [DOI] [PubMed] [Google Scholar]
- Long T, Ford RM. Enhanced transverse migration of bacteria by chemotaxis in a porous T-sensor. Environ Sci Technol. 2009;43(5):1546–1552. doi: 10.1021/es802558j. [DOI] [PubMed] [Google Scholar]
- Long Z, et al. Microfluidic chemostat for measuring single cell dynamics in bacteria. Lab on a Chip. 2013;13 (5):947–954. doi: 10.1039/c2lc41196b. [DOI] [PubMed] [Google Scholar]
- Lutolf MP, et al. Perturbation of single hematopoietic stem cell fates in artificial niches. Integr Biol. 2009;1(1):59–69. doi: 10.1039/b815718a. [DOI] [PMC free article] [PubMed] [Google Scholar]
- Lutz BR, Chen J, Schwartz DT. Hydrodynamic tweezers: 1. Noncontact trapping of single cells using steady streaming microeddies. Anal Chem. 2006;78(15):5429–5435. doi: 10.1021/ac060555y. [DOI] [PubMed] [Google Scholar]
- Maguire Y, et al. Ultra-small-sample molecular structure detection using microslot waveguide nuclear spin resonance. Proc Natl Acad Sci USA. 2007;104 (22):9198–9203. doi: 10.1073/pnas.0703001104. [DOI] [PMC free article] [PubMed] [Google Scholar]
- Manaresi N, et al. A CMOS chip for individual cell manipulation and detection. IEEE J Solid-State Circuits. 2003;38 (12):2297–2305. [Google Scholar]
- Mather W, et al. Streaming instability in growing cell populations. Phys Rev Lett. 2010;104(20):1–4. doi: 10.1103/PhysRevLett.104.208101. [DOI] [PMC free article] [PubMed] [Google Scholar]
- Mazutis L, et al. Single-cell analysis and sorting using droplet-based microfluidics. Nat Protoc. 2013;8(5):870–891. doi: 10.1038/nprot.2013.046. [DOI] [PMC free article] [PubMed] [Google Scholar]
- Mettetal JT, et al. Predicting stochastic gene expression dynamics in single cells. Proc Natl Acad Sci USA. 2006;103 (19):7304–7309. doi: 10.1073/pnas.0509874103. [DOI] [PMC free article] [PubMed] [Google Scholar]
- Mettetal JT, et al. The frequency dependence of osmo-adaptation in Saccharomyces cerevisiae. Science. 2008;319 (5862):482–484. doi: 10.1126/science.1151582. [DOI] [PMC free article] [PubMed] [Google Scholar]
- Mir M, et al. Optical measurement of cycle-dependent cell growth. Proc Natl Acad Sci USA. 2011;108 (32):13124–13129. doi: 10.1073/pnas.1100506108. [DOI] [PMC free article] [PubMed] [Google Scholar]
- Mizuno H, et al. Live single-cell video-mass spectrometry for cellular and subcellular molecular detection and cell classification. J Mass Spectrom. 2008;43(12):1692–1700. doi: 10.1002/jms.1460. [DOI] [PubMed] [Google Scholar]
- Moffitt JR, Lee JB, Cluzel P. The single-cell chemostat: an agarose-based, microfluidic device for high-throughput, single-cell studies of bacteria and bacterial communities. Lab on a Chip. 2012;12 (8):1487–1494. doi: 10.1039/c2lc00009a. [DOI] [PMC free article] [PubMed] [Google Scholar]
- Molter TW, et al. A microwell array device capable of measuring single-cell oxygen consumption rates. Sens Actuators B – Chem. 2009;135(2):678–686. doi: 10.1016/j.snb.2008.10.036. [DOI] [PMC free article] [PubMed] [Google Scholar]
- Moolman MC, et al. Electron beam fabrication of a microfluidic device for studying submicron-scale bacteria. J Nanobiotechnol. 2013;11:1–10. doi: 10.1186/1477-3155-11-12. [DOI] [PMC free article] [PubMed] [Google Scholar]
- Mortimer RK, Johnston JR. Life span of individual yeast cells. Nature. 1959;183 (4677):1751–1752. doi: 10.1038/1831751a0. [DOI] [PubMed] [Google Scholar]
- Mrksich M, Whitesides GM. Patterning self-assembled monolayers using microcontact printing – a new technology for biosensors. Trends Biotechnol. 1995;13(6):228–235. [Google Scholar]
- Mu X, et al. Microfluidics for manipulating cells. Small. 2013;9 (1):9–21. doi: 10.1002/smll.201200996. [DOI] [PubMed] [Google Scholar]
- Mustafi N, et al. Application of a genetically encoded biosensor for live cell imaging of L-valine production in pyruvate dehydrogenase complex-deficient Corynebacterium glutamicum strains. PLoS One. 2014;9 (1):1–11. doi: 10.1371/journal.pone.0085731. [DOI] [PMC free article] [PubMed] [Google Scholar]
- Nakano A. Spinning-disk confocal microscopy – a cutting-edge tool for imaging of membrane traffic. Cell Struct Funct. 2002;27(5):349–355. doi: 10.1247/csf.27.349. [DOI] [PubMed] [Google Scholar]
- Nan XL, Cheng JX, Xie XS. Vibrational imaging of lipid droplets in live fibroblast cells with coherent anti-Stokes Raman scattering microscopy. J Lipid Res. 2003;44(11):2202–2208. doi: 10.1194/jlr.D300022-JLR200. [DOI] [PubMed] [Google Scholar]
- Nasse MJ, et al. Demountable liquid/flow cell for in vivo infrared micro-spectroscopy of biological specimens. Appl Spectrosc. 2009;63(10):1181–1186. doi: 10.1366/000370209789553101. [DOI] [PubMed] [Google Scholar]
- Nebel M, et al. Visualization of oxygen consumption of single living cells by scanning electrochemical microscopy: the influence of the Faradaic tip reaction. Angew Chem-Int Ed. 2013a;52(24):6335–6338. doi: 10.1002/anie.201301098. [DOI] [PubMed] [Google Scholar]
- Nebel M, et al. Microelectrochemical visualization of oxygen consumption of single living cells. Faraday Discuss. 2013b;164:19–32. doi: 10.1039/c3fd00011g. [DOI] [PubMed] [Google Scholar]
- Neuman KC, et al. Characterization of photodamage to Escherichia coli in optical traps. Biophys J. 1999;77(5):2856–2863. doi: 10.1016/S0006-3495(99)77117-1. [DOI] [PMC free article] [PubMed] [Google Scholar]
- Newman JRS, et al. Single-cell proteomic analysis of S. cerevisiae reveals the architecture of biological noise. Nature. 2006;441 (7095):840–846. doi: 10.1038/nature04785. [DOI] [PubMed] [Google Scholar]
- Nicoletti I, et al. A rapid and simple method for measuring thymocyte apoptosis by propidium iodide staining and flow cytometry. J Immunol Methods. 1991;139 (2):271–279. doi: 10.1016/0022-1759(91)90198-o. [DOI] [PubMed] [Google Scholar]
- Nie SM, Emery SR. Probing single molecules and single nanoparticles by surface-enhanced Raman scattering. Science. 1997;275 (5303):1102–1106. doi: 10.1126/science.275.5303.1102. [DOI] [PubMed] [Google Scholar]
- Nilsson J, et al. Review of cell and particle trapping in microfluidic systems. Anal Chim Acta. 2009;649 (2):141–157. doi: 10.1016/j.aca.2009.07.017. [DOI] [PubMed] [Google Scholar]
- Nisisako T, Torii T, Higuchi T. Droplet formation in a microchannel network. Lab on a Chip. 2002;2 (1):24–26. doi: 10.1039/b108740c. [DOI] [PubMed] [Google Scholar]
- Niu X, et al. A microdroplet dilutor for high-throughput screening. Nat Chem. 2011;3(6):437–442. doi: 10.1038/nchem.1046. [DOI] [PubMed] [Google Scholar]
- Nobs JB, Maerkl SJ. Long-term single cell analysis of S. pombe on a microfluidic microchemostat array. PLoS One. 2014;9 (4):1–11. doi: 10.1371/journal.pone.0093466. [DOI] [PMC free article] [PubMed] [Google Scholar]
- Norman TM, et al. Memory and modularity in cell-fate decision making. Nature. 2013;503 (7477):481. doi: 10.1038/nature12804. [DOI] [PMC free article] [PubMed] [Google Scholar]
- Novak R, et al. Single-cell multiplex gene detection and sequencing with microfluidically generated agarose emulsions. Angew Chem-Int Ed. 2011;50(2):390–395. doi: 10.1002/anie.201006089. [DOI] [PMC free article] [PubMed] [Google Scholar]
- Ntziachristos V. Fluorescence molecular imaging. Annu Rev Biomed Eng. 2006;8:1–33. doi: 10.1146/annurev.bioeng.8.061505.095831. [DOI] [PubMed] [Google Scholar]
- Ochsner M, et al. Micro-well arrays for 3D shape control and high resolution analysis of single cells. Lab on a Chip. 2007;7 (8):1074–1077. doi: 10.1039/b704449f. [DOI] [PubMed] [Google Scholar]
- Okada M, et al. Label-free Raman observation of cytochrome c dynamics during apoptosis. Proc Natl Acad Sci USA. 2012;109 (1):28–32. doi: 10.1073/pnas.1107524108. [DOI] [PMC free article] [PubMed] [Google Scholar]
- Okumoto S, Jones A, Frommer WB. Quantitative imaging with fluorescent biosensors. Annu Rev Plant Biol. 2012;63:663–706. doi: 10.1146/annurev-arplant-042110-103745. [DOI] [PubMed] [Google Scholar]
- Olsen MJ, et al. Function-based isolation of novel enzymes from a large library. Nat Biotechnol. 2000;18(10):1071–1074. doi: 10.1038/80267. [DOI] [PubMed] [Google Scholar]
- Otto K, Hermansson M. Inactivation of ompX causes increased interactions of type 1 fimbriated Escherichia coli with abiotic surfaces. J Bacteriol. 2004;186(1):226–234. doi: 10.1128/JB.186.1.226-234.2004. [DOI] [PMC free article] [PubMed] [Google Scholar]
- Ozbudak EM, et al. Regulation of noise in the expression of a single gene. Nat Genet. 2002;31(1):69–73. doi: 10.1038/ng869. [DOI] [PubMed] [Google Scholar]
- O’Brien J, et al. Investigation of the Alamar Blue (resazurin) fluorescent dye for the assessment of mammalian cell cytotoxicity. Eur J Biochem. 2000;267(17):5421–5426. doi: 10.1046/j.1432-1327.2000.01606.x. [DOI] [PubMed] [Google Scholar]
- Pan J, et al. Quantitative tracking of the growth of individual algal cells in microdroplet compartments. Integr Biol. 2011;3(10):1043–1051. doi: 10.1039/c1ib00033k. [DOI] [PubMed] [Google Scholar]
- Parce JW, et al. Detection of cell-affecting agents with a silicon biosensor. Science. 1989;246 (4927):243–247. doi: 10.1126/science.2799384. [DOI] [PubMed] [Google Scholar]
- Park K, et al. Measurement of adherent cell mass and growth. Proc Natl Acad Sci USA. 2010;107 (48):20691–20696. doi: 10.1073/pnas.1011365107. [DOI] [PMC free article] [PubMed] [Google Scholar]
- Parkinson DY, et al. Quantitative 3-D imaging of eukaryotic cells using soft X-ray tomography. J Struct Biol. 2008;162(3):380–386. doi: 10.1016/j.jsb.2008.02.003. [DOI] [PMC free article] [PubMed] [Google Scholar]
- Peng L, et al. Intracellular ethanol accumulation in yeast cells during aerobic fermentation: a Raman spectroscopic exploration. Lett Appl Microbiol. 2010;51(6):632–638. doi: 10.1111/j.1472-765X.2010.02941.x. [DOI] [PubMed] [Google Scholar]
- Perkins TT, Smith DE, Chu S. Single polymer dynamics in an elongational flow. Science. 1997;276 (5321):2016–2021. doi: 10.1126/science.276.5321.2016. [DOI] [PubMed] [Google Scholar]
- Petit T, et al. Selective trapping and manipulation of microscale objects using mobile microvortices. Nano Lett. 2012;12(1):156–160. doi: 10.1021/nl2032487. [DOI] [PubMed] [Google Scholar]
- Petrov GI, et al. Comparison of coherent and spontaneous Raman micro-spectroscopies for noninvasive detection of single bacterial endospores. Proc Natl Acad Sci USA. 2007;104 (19):7776–7779. doi: 10.1073/pnas.0702107104. [DOI] [PMC free article] [PubMed] [Google Scholar]
- Pezacki JP, et al. Chemical contrast for imaging living systems: molecular vibrations drive CARS microscopy. Nat Chem Biol. 2011;7(3):137–145. doi: 10.1038/nchembio.525. [DOI] [PMC free article] [PubMed] [Google Scholar]
- Popescu G, et al. New technologies for measuring single cell mass. Lab on a Chip. 2014;14 (4):646–652. doi: 10.1039/c3lc51033f. [DOI] [PubMed] [Google Scholar]
- Pozarowski P, Holden E, Darzynkiewicz Z. Laser scanning cytometry: principles and applications. Methods Mol Biol. 2006;319:165–192. doi: 10.1007/978-1-59259-993-6_8. [DOI] [PMC free article] [PubMed] [Google Scholar]
- Pozarowski P, Holden E, Darzynkiewicz Z. Laser scanning cytometry: principles and applications-an update. Methods Mol Biol. 2013;931:187–212. doi: 10.1007/978-1-62703-056-4_11. [DOI] [PMC free article] [PubMed] [Google Scholar]
- Probst C, et al. Microfluidic growth chambers with optical tweezers for full spatial single-cell control and analysis of evolving microbes. J Microbiol Methods. 2013a;95 (3):470–476. doi: 10.1016/j.mimet.2013.09.002. [DOI] [PubMed] [Google Scholar]
- Probst C, et al. Polydimethylsiloxane (PDMS) sub-micron traps for single-cell analysis of bacteria. Micromachines. 2013b;4 (4):357–369. [Google Scholar]
- Puppels GJ, et al. Studying single living cells and chromosomes by confocal Raman microspectroscopy. Nature. 1990;347 (6290):301–303. doi: 10.1038/347301a0. [DOI] [PubMed] [Google Scholar]
- Puppels GJ, et al. Laser irradiation and Raman spectroscopy of single living cells and chromosomes – sample degradation occurs with 514.5 nm but not 660 nm laser light. Exp Cell Res. 1991;195(2):361–367. doi: 10.1016/0014-4827(91)90385-8. [DOI] [PubMed] [Google Scholar]
- Quake SR, Scherer A. From micro- to nanofabrication with soft materials. Science. 2000;290 (5496):1536–1540. doi: 10.1126/science.290.5496.1536. [DOI] [PubMed] [Google Scholar]
- Quaroni L, Zlateva T. Infrared spectromicroscopy of biochemistry in functional single cells. Analyst. 2011;136 (16):3219–3232. doi: 10.1039/c1an15060j. [DOI] [PubMed] [Google Scholar]
- Radulovic M, et al. The emergence of lipid droplets in yeast: current status and experimental approaches. Curr Genet. 2013;59(4):231–242. doi: 10.1007/s00294-013-0407-9. [DOI] [PMC free article] [PubMed] [Google Scholar]
- Rafelski SM, et al. Mitochondrial network size scaling in budding yeast. Science. 2012;338 (6108):822–824. doi: 10.1126/science.1225720. [DOI] [PMC free article] [PubMed] [Google Scholar]
- Reits EAJ, Neefjes JJ. From fixed to FRAP: measuring protein mobility and activity in living cells. Nat Cell Biol. 2001;3(6):E145–E147. doi: 10.1038/35078615. [DOI] [PubMed] [Google Scholar]
- Rettig JR, Folch A. Large-scale single-cell trapping and imaging using microwell arrays. Anal Chem. 2005;77(17):5628–5634. doi: 10.1021/ac0505977. [DOI] [PubMed] [Google Scholar]
- Reymond J-L, Fluxa VS, Maillard N. Enzyme assays. Chem Commun. 2009;(1):34–46. doi: 10.1039/b813732c. [DOI] [PubMed] [Google Scholar]
- Riordon J, Mirzaei M, Godin M. Microfluidic cell volume sensor with tunable sensitivity. Lab on a Chip. 2012;12 (17):3016–3019. doi: 10.1039/c2lc40357a. [DOI] [PubMed] [Google Scholar]
- Robert L, et al. Pre-dispositions and epigenetic inheritance in the Escherichia coli lactose operon bistable switch. Mol Syst Biol. 2010;6:1–12. doi: 10.1038/msb.2010.12. [DOI] [PMC free article] [PubMed] [Google Scholar]
- Romeo M, et al. Infrared microspectroscopy of individual human cervical cancer (HeLa) cells. Biopolymers. 2004;74 (1–2):168–171. doi: 10.1002/bip.20065. [DOI] [PMC free article] [PubMed] [Google Scholar]
- Rosch P, et al. Raman spectroscopic identification of single yeast cells. J Raman Spectrosc. 2005;36(5):377–379. [Google Scholar]
- Rosenfeld N, et al. Gene regulation at the single-cell level. Science. 2005;307 (5717):1962–1965. doi: 10.1126/science.1106914. [DOI] [PubMed] [Google Scholar]
- Rowat AC, et al. Tracking lineages of single cells in lines using a microfluidic device. Proc Natl Acad Sci USA. 2009;106 (43):18149–18154. doi: 10.1073/pnas.0903163106. [DOI] [PMC free article] [PubMed] [Google Scholar]
- Rubakhin SS, et al. Profiling metabolites and peptides in single cells. Nat Methods. 2011;8 (4):S20–S29. doi: 10.1038/nmeth.1549. [DOI] [PMC free article] [PubMed] [Google Scholar]
- Rubakhin SS, Lanni EJ, Sweedler JV. Progress toward single cell metabolomics. Curr Opin Biotechnol. 2013;24(1):95–104. doi: 10.1016/j.copbio.2012.10.021. [DOI] [PMC free article] [PubMed] [Google Scholar]
- Rudolf R, et al. Looking forward to seeing calcium. Nat Rev Mol Cell Biol. 2003;4(7):579–586. doi: 10.1038/nrm1153. [DOI] [PubMed] [Google Scholar]
- Rust MJ, Bates M, Zhuang X. Sub-diffraction-limit imaging by stochastic optical reconstruction microscopy (STORM) Nat Methods. 2006;3 (10):793–795. doi: 10.1038/nmeth929. [DOI] [PMC free article] [PubMed] [Google Scholar]
- Ryley J, Pereira-Smith OM. Microfluidics device for single cell gene expression analysis in Saccharomyces cerevisiae. Yeast. 2006;23 (14–15):1065–1073. doi: 10.1002/yea.1412. [DOI] [PubMed] [Google Scholar]
- Saka SK, et al. Correlated optical and isotopic nanoscopy. Nat Commun. 2014;5:1–8. doi: 10.1038/ncomms4664. [DOI] [PMC free article] [PubMed] [Google Scholar]
- Sakdinawat A, Attwood D. Nanoscale X-ray imaging. Nat Photon. 2010;4(12):840–848. [Google Scholar]
- Sala-Newby GB, et al. Bioluminescent and chemiluminescent indicators for molecular signalling and function in living cells. In: Mason WT, editor. Fluorescent and Luminescent Probes for Biological Activity. 2. Elsevier; London: 1999. [Google Scholar]
- Sasuga Y, et al. Single-cell chemical lysis method for analyses of intracellular molecules using an array of picoliter-scale microwells. Anal Chem. 2008;80(23):9141–9149. doi: 10.1021/ac8016423. [DOI] [PubMed] [Google Scholar]
- Schallmey M, et al. Looking for the pick of the bunch: high-throughput screening of producing microorganisms with biosensors. Curr Opin Biotechnol. 2014;26:148–154. doi: 10.1016/j.copbio.2014.01.005. [DOI] [PubMed] [Google Scholar]
- Schendzielorz G, et al. Taking control over control: use of product sensing in single cells to remove flux control at key enzymes in biosynthesis pathways. ACS Synth Biol. 2014;3(1):21–29. doi: 10.1021/sb400059y. [DOI] [PubMed] [Google Scholar]
- Schmid A, et al. Chemical and biological single cell analysis. Curr Opin Biotechnol. 2010;21(1):12–20. doi: 10.1016/j.copbio.2010.01.007. [DOI] [PubMed] [Google Scholar]
- Schmid T, et al. Nanoscale chemical imaging using tip-enhanced Raman spectroscopy: a critical review. Angew Chem-Int Ed. 2013;52(23):5940–5954. doi: 10.1002/anie.201203849. [DOI] [PubMed] [Google Scholar]
- Schmitz CHJ, et al. Dropspots: a picoliter array in a microfluidic device. Lab on a Chip. 2009;9 (1):44–49. doi: 10.1039/b809670h. [DOI] [PubMed] [Google Scholar]
- Schnelle T, et al. 3-dimensional electric-field traps for manipulation of cells – calculation and experimental verification. Biochim Biophys Acta. 1993;1157 (2):127–140. doi: 10.1016/0304-4165(93)90056-e. [DOI] [PubMed] [Google Scholar]
- Schrum DP, et al. Microchip flow cytometry using electrokinetic focusing. Anal Chem. 1999;71(19):4173–4177. doi: 10.1021/ac990372u. [DOI] [PubMed] [Google Scholar]
- Schuster KC, et al. Multidimensional information on the chemical composition of single bacterial cells by confocal Raman microspectroscopy. Anal Chem. 2000;72(22):5529–5534. doi: 10.1021/ac000718x. [DOI] [PubMed] [Google Scholar]
- Seger U, et al. Temperature measurements in microfluidic systems: heat dissipation of negative dielectrophoresis barriers. Electrophoresis. 2005;26 (11):2239–2246. doi: 10.1002/elps.200410358. [DOI] [PubMed] [Google Scholar]
- Shaker M, et al. An impedance-based flow microcytometer for single cell morphology discrimination. Lab on a Chip. 2014;14:2548–2555. doi: 10.1039/c4lc00221k. http://dx.doi.org/10.1039/c4lc00221k. [DOI] [PubMed] [Google Scholar]
- Shapiro HM. Practical Flow Cytometry. John Wiley & Sons Inc; Hoboken, New Jersey: 2003. [Google Scholar]
- Shroff H, et al. Live-cell photoactivated localization microscopy of nanoscale adhesion dynamics. Nat Methods. 2008;5 (5):417–423. doi: 10.1038/nmeth.1202. [DOI] [PMC free article] [PubMed] [Google Scholar]
- Siegal-Gaskins D, Crosson S. Tightly regulated and heritable division control in single bacterial cells. Biophys J. 2008;95(4):2063–2072. doi: 10.1529/biophysj.108.128785. [DOI] [PMC free article] [PubMed] [Google Scholar]
- Singhvi R, et al. Engineering cell shape and function. Science. 1994;264 (5159):696–698. doi: 10.1126/science.8171320. [DOI] [PubMed] [Google Scholar]
- Smith C. Two microscopes are better than one. Nature. 2012;492 (7428):293–297. doi: 10.1038/492293a. [DOI] [PubMed] [Google Scholar]
- Sohn LL, et al. Capacitance cytometry: measuring biological cells one by one. Proc Natl Acad Sci USA. 2000;97 (20):10687–10690. doi: 10.1073/pnas.200361297. [DOI] [PMC free article] [PubMed] [Google Scholar]
- Song H, Ismagilov RF. Millisecond kinetics on a microfluidic chip using nanoliters of reagents. J Am Chem Soc. 2003;125(47):14613–14619. doi: 10.1021/ja0354566. [DOI] [PMC free article] [PubMed] [Google Scholar]
- Song H, Chen DL, Ismagilov RF. Reactions in droplets in microflulidic channels. Angew Chem-Int Ed. 2006;45(44):7336–7356. doi: 10.1002/anie.200601554. [DOI] [PMC free article] [PubMed] [Google Scholar]
- Song WZ, et al. Refractive index measurement of single living cells using on-chip Fabry–Perot cavity. Appl Phys Lett. 2006;89(20):1–3. [Google Scholar]
- Stender AS, et al. Single cell optical imaging and spectroscopy. Chem Rev. 2013;113(4):2469–2527. doi: 10.1021/cr300336e. [DOI] [PMC free article] [PubMed] [Google Scholar]
- Stojkovic G, Znidarsic-Plazl P. Immobilization of yeast cells within micro-channels of different materials. Acta Chim Slov. 2010;57(1):144–149. [PubMed] [Google Scholar]
- Streets AM, et al. Microfluidic single-cell whole-transcriptome sequencing. Proc Natl Acad Sci USA. 2014;111 (19):7048–7053. doi: 10.1073/pnas.1402030111. [DOI] [PMC free article] [PubMed] [Google Scholar]
- Stringari C, et al. Phasor approach to fluorescence lifetime microscopy distinguishes different metabolic states of germ cells in a live tissue. Proc Natl Acad Sci USA. 2011;108 (33):13582–13587. doi: 10.1073/pnas.1108161108. [DOI] [PMC free article] [PubMed] [Google Scholar]
- Strohmeier R, Bereiterhahn J. Hydrostatic pressure in epidermal cells is dependent on Ca-mediated contractions. J Cell Sci. 1987;88:631–640. doi: 10.1242/jcs.88.5.631. [DOI] [PubMed] [Google Scholar]
- Su TW, Xue L, Ozcan A. High-throughput lensfree 3D tracking of human sperms reveals rare statistics of helical trajectories. Proc Natl Acad Sci USA. 2012;109 (40):16018–16022. doi: 10.1073/pnas.1212506109. [DOI] [PMC free article] [PubMed] [Google Scholar]
- Sun J, et al. Technique of surface modification of a cell-adhesion-resistant hydrogel by a cell-adhesion-available inorganic microarray. Biomacromolecules. 2008;9 (10):2569–2572. doi: 10.1021/bm800477s. [DOI] [PubMed] [Google Scholar]
- Sun T, Kovac J, Voldman J. Image-based single-cell sorting via dual-photopolymerized microwell arrays. Anal Chem. 2014;86(2):977–981. doi: 10.1021/ac403777g. [DOI] [PubMed] [Google Scholar]
- Tamura M, et al. Optical cell separation from three-dimensional environment in photodegradable hydrogels for pure culture techniques. Sci Rep. 2014;4:1–6. doi: 10.1038/srep04793. [DOI] [PMC free article] [PubMed] [Google Scholar]
- Tan WH, Takeuchi S. A trap-and-release integrated microfluidic system for dynamic microarray applications. Proc Natl Acad Sci USA. 2007;104 (4):1146–1151. doi: 10.1073/pnas.0606625104. [DOI] [PMC free article] [PubMed] [Google Scholar]
- Taniguchi Y, et al. Quantifying E. coli proteome and transcriptome with single-molecule sensitivity in single cells. Science. 2010;329 (5991):533–538. doi: 10.1126/science.1188308. [DOI] [PMC free article] [PubMed] [Google Scholar]
- Tanyeri M, Johnson-Chavarria EM, Schroeder CM. Hydrodynamic trap for single particles and cells. Appl Phys Lett. 2010;96(22):1–3. doi: 10.1063/1.3431664. [DOI] [PMC free article] [PubMed] [Google Scholar]
- Tanyeri M, et al. A microfluidic-based hydrodynamic trap: design and implementation. Lab on a Chip. 2011;11 (10):1786–1794. doi: 10.1039/c0lc00709a. [DOI] [PubMed] [Google Scholar]
- Taylor LD. High Content Screening. In: Taylor LD, Haskins JR, Giuliano KA, editors. Methods in Molecular Biology. Humana Press Inc; Totowa, New Jersey: 2007. p. 07512. [Google Scholar]
- Teh SY, et al. Droplet microfluidics. Lab on a Chip. 2008;8 (2):198–220. doi: 10.1039/b715524g. [DOI] [PubMed] [Google Scholar]
- Thomas RS, Morgan H, Green NG. Negative DEP traps for single cell immobilisation. Lab on a Chip. 2009;9 (11):1534–1540. doi: 10.1039/b819267g. [DOI] [PubMed] [Google Scholar]
- Thorsen T, et al. Dynamic pattern formation in a vesicle-generating microfluidic device. Phys Rev Lett. 2001;86(18):4163–4166. doi: 10.1103/PhysRevLett.86.4163. [DOI] [PubMed] [Google Scholar]
- Tice JD, et al. Formation of droplets and mixing in multiphase microfluidics at low values of the Reynolds and the capillary numbers. Langmuir. 2003;19 (22):9127–9133. [Google Scholar]
- Tracy BP, Gaida SM, Papoutsakis ET. Flow cytometry for bacteria: enabling metabolic engineering, synthetic biology and the elucidation of complex phenotypes. Curr Opin Biotechnol. 2010;21(1):85–99. doi: 10.1016/j.copbio.2010.02.006. [DOI] [PubMed] [Google Scholar]
- Trouillon R, et al. Chemical analysis of single cells. Anal Chem. 2013;85(2):522–542. doi: 10.1021/ac303290s. [DOI] [PubMed] [Google Scholar]
- Tuson HH, Weibel DB. Bacteria–surface interactions. Soft Matter. 2013;9 (17):4368–4380. doi: 10.1039/C3SM27705D. [DOI] [PMC free article] [PubMed] [Google Scholar]
- Twining BS, et al. Quantifying trace elements in individual aquatic protist cells with a synchrotron X-ray fluorescence microprobe. Anal Chem. 2003;75(15):3806–3816. doi: 10.1021/ac034227z. [DOI] [PubMed] [Google Scholar]
- Ullman G, et al. High-throughput gene expression analysis at the level of single proteins using a microfluidic turbidostat and automated cell tracking. Philos Trans R Soc B – Biol Sci. 2013;368(1611):1–8. doi: 10.1098/rstb.2012.0025. [DOI] [PMC free article] [PubMed] [Google Scholar]
- Unger MA, et al. Monolithic microfabricated valves and pumps by multilayer soft lithography. Science. 2000;288 (5463):113–116. doi: 10.1126/science.288.5463.113. [DOI] [PubMed] [Google Scholar]
- Ungerboeck B, et al. Microfluidic oxygen imaging using integrated optical sensor layers and a color camera. Lab on a Chip. 2013;13 (8):1593–1601. doi: 10.1039/c3lc41315b. [DOI] [PubMed] [Google Scholar]
- Urban PL, et al. High-density micro-arrays for mass spectrometry. Lab on a Chip. 2010;10 (23):3206–3209. doi: 10.1039/c0lc00211a. [DOI] [PubMed] [Google Scholar]
- van Heerden JH, et al. Lost in transition: start-up of glycolysis yields subpopulations of nongrowing cells. Science. 2014;343 (6174):987. doi: 10.1126/science.1245114. [DOI] [PubMed] [Google Scholar]
- Vanaelst L, et al. Molecular cloning of a gene involved in glucose sensing in the yeast Saccharomyces cerevisiae. Mol Microbiol. 1993;8(5):927–943. doi: 10.1111/j.1365-2958.1993.tb01638.x. [DOI] [PubMed] [Google Scholar]
- Vasdekis AE. Single microbe trap and release in sub-microfluidics. RSC Adv. 2013;3(18):6343–6346. [Google Scholar]
- Vasdekis AE, et al. Precision intracellular delivery based on optofluidic polymersome rupture. ACS Nano. 2012;6 (9):7850–7857. doi: 10.1021/nn302122h. [DOI] [PubMed] [Google Scholar]
- Vasdekis AE, et al. Solvent immersion imprint lithography. Lab on a Chip. 2014;14 (12):2072–2080. doi: 10.1039/c4lc00226a. [DOI] [PubMed] [Google Scholar]
- Verveer PJ, et al. High-resolution three-dimensional imaging of large specimens with light sheet-based microscopy. Nat Methods. 2007;4 (4):311–313. doi: 10.1038/nmeth1017. [DOI] [PubMed] [Google Scholar]
- Vitol EA, et al. Nanoprobes for intracellular and single cell surface-enhanced Raman spectroscopy (SERS) J Raman Spectrosc. 2012;43(7):817–827. [Google Scholar]
- Voldman J. Electrical forces for microscale cell manipulation. Annu Rev Biomed Eng. 2006;8:425–454. doi: 10.1146/annurev.bioeng.8.061505.095739. [DOI] [PubMed] [Google Scholar]
- Wagner M. Single-cell ecophysiology of microbes as revealed by Raman microspectroscopy or secondary ion mass spectrometry imaging. Annu Rev Microbiol. 2009;63:411–429. doi: 10.1146/annurev.micro.091208.073233. [DOI] [PubMed] [Google Scholar]
- Walker BN, et al. Metabolic differences in microbial cell populations revealed by nanophotonic ionization. Angew Chem-Int Ed. 2013;52(13):3650–3653. doi: 10.1002/anie.201207348. [DOI] [PubMed] [Google Scholar]
- Wang BL, et al. Microfluidic high-throughput culturing of single cells for selection based on extracellular metabolite production or consumption. Nat Biotechnol. 2014;32(5):473–478. doi: 10.1038/nbt.2857. [DOI] [PMC free article] [PubMed] [Google Scholar]
- Wang D, Bodovitz S. Single cell analysis: the new frontier in ‘omics’. Trends Biotechnol. 2010;28(6):281–920. doi: 10.1016/j.tibtech.2010.03.002. [DOI] [PMC free article] [PubMed] [Google Scholar]
- Wang P, et al. Robust growth of Escherichia coli. Curr Biol. 2010;20(12):1099–1103. doi: 10.1016/j.cub.2010.04.045. [DOI] [PMC free article] [PubMed] [Google Scholar]
- Wang Z, et al. Spatial light interference microscopy (SLIM) Opt Express. 2011;19 (2):1016–1026. doi: 10.1364/OE.19.001016. [DOI] [PMC free article] [PubMed] [Google Scholar]
- Ward JH, Bashir R, Peppas NA. Micropatterning of biomedical polymer surfaces by novel UV polymerization techniques. J Biomed Mate Res. 2001;56(3):351–360. doi: 10.1002/1097-4636(20010905)56:3<351::aid-jbm1103>3.0.co;2-a. [DOI] [PubMed] [Google Scholar]
- Warrick JW, et al. High-content adhesion assay to address limited cell samples. Integr Biol. 2013;5(4):720–727. doi: 10.1039/c3ib20224k. [DOI] [PMC free article] [PubMed] [Google Scholar]
- Webb DJ, Brown CM. Epi-fluorescence microscopy. Methods Mol Biol. 2013;931:29–59. doi: 10.1007/978-1-62703-056-4_2. [DOI] [PMC free article] [PubMed] [Google Scholar]
- Weibel DB, DiLuzio WR, Whitesides GM. Microfabrication meets microbiology. Nat Rev Microbiol. 2007;5(3):209–218. doi: 10.1038/nrmicro1616. [DOI] [PubMed] [Google Scholar]
- Weinstein JA, et al. High-throughput sequencing of the zebrafish antibody repertoire. Science. 2009;324 (5928):807–810. doi: 10.1126/science.1170020. [DOI] [PMC free article] [PubMed] [Google Scholar]
- Weng Y, et al. Mass sensors with mechanical traps for weighing single cells in different fluids. Lab on a Chip. 2011;11 (24):4174–4180. doi: 10.1039/c1lc20736a. [DOI] [PubMed] [Google Scholar]
- Werner M, et al. Microfluidic array cytometer based on refractive optical tweezers for parallel trapping, imaging and sorting of individual cells. Lab on a Chip. 2011;11 (14):2432–2439. doi: 10.1039/c1lc20181f. [DOI] [PubMed] [Google Scholar]
- Wheeler AR, et al. Microfluidic device for single-cell analysis. Anal Chem. 2003;75(14):3581–3586. doi: 10.1021/ac0340758. [DOI] [PubMed] [Google Scholar]
- Whelan DR, et al. Monitoring the reversible B to A-like transition of DNA in eukaryotic cells using Fourier transform infrared spectroscopy. Nucleic Acids Res. 2011;39(13):5439–5448. doi: 10.1093/nar/gkr175. [DOI] [PMC free article] [PubMed] [Google Scholar]
- Whitaker M. Genetically encoded probes for measurement of intracellular calcium. In: Whitaker M, editor. Calcium in Living Cells. 2010. pp. 153–182. [DOI] [PMC free article] [PubMed] [Google Scholar]
- White JG, Amos WB, Fordham M. An evaluation of confocal versus conventional imaging of biological structures by fluorescence light microscopy. J Cell Biol. 1987;105(1):41–48. doi: 10.1083/jcb.105.1.41. [DOI] [PMC free article] [PubMed] [Google Scholar]
- Whitesides GM, et al. Soft lithography in biology and biochemistry. Annu Rev Biomed Eng. 2001;3:335–373. doi: 10.1146/annurev.bioeng.3.1.335. [DOI] [PubMed] [Google Scholar]
- Wilfling F, et al. Triacylglycerol synthesis enzymes mediate lipid droplet growth by relocalizing from the ER to lipid droplets. Dev Cell. 2013;24 (4):384–399. doi: 10.1016/j.devcel.2013.01.013. [DOI] [PMC free article] [PubMed] [Google Scholar]
- Willig KI, et al. STED microscopy reveals that synaptotagmin remains clustered after synaptic vesicle exocytosis. Nature. 2006;440 (7086):935–939. doi: 10.1038/nature04592. [DOI] [PubMed] [Google Scholar]
- Winkleman A, et al. A magnetic trap for living cells suspended in a paramagnetic buffer. Appl Phys Lett. 2004;85(12):2411–2413. [Google Scholar]
- Wolff A, et al. Integrating advanced functionality in a microfabricated high-throughput fluorescent-activated cell sorter. Lab on a Chip. 2003;3 (1):22–27. doi: 10.1039/b209333b. [DOI] [PubMed] [Google Scholar]
- Wood DK, et al. Single cell trapping and DNA damage analysis using microwell arrays. Proc Natl Acad Sci USA. 2010;107 (22):10008–10013. doi: 10.1073/pnas.1004056107. [DOI] [PMC free article] [PubMed] [Google Scholar]
- Wu H, et al. In vivo lipidomics using single-cell Raman spectroscopy. Proc Natl Acad Sci USA. 2011;108 (9):3809–3814. doi: 10.1073/pnas.1009043108. [DOI] [PMC free article] [PubMed] [Google Scholar]
- Xia YN, Whitesides GM. Soft lithography. Annu Rev Mater Sci. 1998;28:153–184. [Google Scholar]
- Xie CG, et al. Study of dynamical process of heat denaturation in optically trapped single microorganisms by near-infrared Raman spectroscopy. J Appl Phys. 2003;94(9):6138–6142. [Google Scholar]
- Xie CG, Chen D, Li YQ. Raman sorting and identification of single living micro-organisms with optical tweezers. Opt Lett. 2005;30(14):1800–1802. doi: 10.1364/ol.30.001800. [DOI] [PubMed] [Google Scholar]
- Yakovlev VV. Advanced instrumentation for non-linear Raman microscopy. J Raman Spectrosc. 2003;34(12):957–964. [Google Scholar]
- Yang AHJ, et al. Optical manipulation of nanoparticles and biomolecules in sub-wavelength slot waveguides. Nature. 2009;457 (7225):71–75. doi: 10.1038/nature07593. [DOI] [PubMed] [Google Scholar]
- Ye Z, Sitti M. Dynamic trapping and two-dimensional transport of swimming microorganisms using a rotating magnetic microrobot. Lab on a Chip. 2014;14 (13):2177–2182. doi: 10.1039/c4lc00004h. [DOI] [PubMed] [Google Scholar]
- Young JW, et al. Measuring single-cell gene expression dynamics in bacteria using fluorescence time-lapse microscopy. Nat Protoc. 2012;7(1):80–88. doi: 10.1038/nprot.2011.432. [DOI] [PMC free article] [PubMed] [Google Scholar]
- Yuan H, et al. Plasmonic nanoprobes for intracellular sensing and imaging. Anal Bioanal Chem. 2013;405(19):6165–6180. doi: 10.1007/s00216-013-6975-1. [DOI] [PubMed] [Google Scholar]
- Yun W, et al. X-ray imaging and microspectroscopy of plants and fungi. J Synchrotron Radiat. 1998;5:1390–1395. doi: 10.1107/S0909049598007225. [DOI] [PubMed] [Google Scholar]
- Zelle MR. A simple single-cell technique for genetic studies of bacteria. J Bacteriol. 1951;61(3):345–349. doi: 10.1128/jb.61.3.345-349.1951. [DOI] [PMC free article] [PubMed] [Google Scholar]
- Zeng Y, et al. High-performance single cell genetic analysis using micro-fluidic emulsion generator arrays. Anal Chem. 2010;82(8):3183–3190. doi: 10.1021/ac902683t. [DOI] [PMC free article] [PubMed] [Google Scholar]
- Zenobi R. Single-cell metabolomics: analytical and biological perspectives. Science. 2013;342 (6163):1201. doi: 10.1126/science.1243259. [DOI] [PubMed] [Google Scholar]
- Zhang C, et al. Effects of pore-scale heterogeneity and transverse mixing on bacterial growth in porous media. Environ Sci Technol. 2010;44(8):3085–3092. doi: 10.1021/es903396h. [DOI] [PubMed] [Google Scholar]
- Zheng Y, et al. Recent advances in microfluidic techniques for single-cell biophysical characterization. Lab on a Chip. 2013;13 (13):2464–2483. doi: 10.1039/c3lc50355k. [DOI] [PubMed] [Google Scholar]
- Zhu A, Romero R, Petty HR. Amplex UltraRed enhances the sensitivity of fluorimetric pyruvate detection. Anal Biochem. 2010;403(1–2):123–125. doi: 10.1016/j.ab.2010.04.008. [DOI] [PMC free article] [PubMed] [Google Scholar]
- Zhu Z, et al. Microfluidic single-cell cultivation chip with controllable immobilization and selective release of yeast cells. Lab on a Chip. 2012;12 (5):906–915. doi: 10.1039/c2lc20911j. [DOI] [PubMed] [Google Scholar]
- Zimmerman TA, Rubakhin SS, Sweedler JV. MALDI mass spectrometry imaging of neuronal cell cultures. J Am Soc Mass Spectrom. 2011;22(5):828–836. doi: 10.1007/s13361-011-0111-2. [DOI] [PMC free article] [PubMed] [Google Scholar]
- Zurgil N, et al. Donut-shaped chambers for analysis of biochemical processes at the cellular and subcellular levels. Lab on a Chip. 2014;14:2226–2239. doi: 10.1039/c3lc51426a. http://dx.doi.org/10.1039/C3LC51426A. [DOI] [PubMed] [Google Scholar]