

Abstract
Pre-transplant donor biopsy (PTDB)-based marginal-donor allocation systems to single or dual renal transplantation could increase the use of organs with Kidney Donor Profile Index (KDPI) in the highest range (e.g. >80 or >90), whose discard rate approximates 50% in the US. To test this hypothesis, we retrospectively calculated the KDPI and analyzed the outcomes of 442 marginal kidney transplants (340 single transplants: 278 with a PTDB Remuzzi score <4 [median KDPI:87; interquartile range(IQR):78-94] and 62 with a score =4 [median KDPI:87; IQR:76-93]; 102 dual transplants [median KDPI: 93; IQR:86-96]) and 248 single standard transplant controls [median KDPI:36; IQR:18-51]. PTDB-based allocation of marginal grafts led to a limited discard rate of 15% for kidneys with KDPI of 80-90 and of 37% for kidneys with a KDPI of 91-100. Although 1-year eGFRs were significantly lower in recipients of marginal kidneys (-9.3, -17.9, and -18.8ml/min, for dual transplants, single kidneys with PTDB score <4, and =4, respectively; P<0.001), graft survival (median follow-up 3.3 years) was similar between marginal and standard kidney transplants (hazard ratio: 1.20 [95% confidence interval: 0.80 to 1.79; P=0.38]). In conclusion, PTDB-based allocation allows the safe transplantation of kidneys with KDPI in the highest range that may otherwise be discarded.
Introduction
The increasing number of patients on the waiting lists for kidney transplantation has not been paralleled by a similar growth in the number of available donors (1). More worrisome is the fact that over 20% of available kidneys are from donors who are older than 65 years, or have diabetes or renal impairment, and are therefore frequently not considered suitable for donation, due to the increased risk of early failure of their organs (2-4).
In the US, despite the implementation of the expanded criteria donor (ECD) program over 10 years ago, the percentage of kidneys recovered but not transplanted remains over 40%. Major determinants of discard rates are biopsy findings on wedge biopsy (percent glomerulosclerosis) and parameters of machine pump perfusion (5). The United Network of Organ Sharing (UNOS) Kidney Transplantation Committee has recently approved a new allocation policy, that will be implemented by the end of 2014 (6), which is based on the kidney donor risk index (KDRI), that represents the relative risk of post-transplant graft failure from a particular deceased donor compared to the average donor (7). The KDPI is an additional numerical score, which results from ranking KDRI from the 1st to the 100th percentile, with reference to a given Organ Procurement and Transplantation Network (OPTN) donor cohort. Amongst organs retrieved between 2002 and 2012, 36% and 63% of kidneys with KDPI 80-90 and >90 were discarded, respectively (4).
Starting with the rationale that poor long-term outcome of marginal grafts is the consequence of an imbalance between the number of viable nephrons supplied, and the metabolic demand of the recipient (8), a standardized assessment of pre-transplant donor biopsies (PTDB) has been proposed to estimate nephron mass. This estimate allows discrimination between kidneys that would provide outcomes similar to standard organs and those that should be discarded (9). Histological evaluation can also identify kidneys with suboptimal nephron mass that should not be transplanted alone, but may be suitable if used in dual transplantation.
Although the histological criteria to allocate grafts to single or dual transplantation or to discard them are still not uniform (10-17) (18), there is evidence suggesting that this strategy might help in recovering marginal kidneys which would be otherwise discarded, without affecting patient outcomes (11, 12, 19, 20).
The aim of the present study was to test the hypothesis that a standardized PTDB assessment-based allocation approach allows identification of kidneys with KDPI in the highest range that are suitable for single or dual transplantation. To this end, we examined the KDPI distribution and outcomes of 442 marginal kidneys allocated to single or dual transplantation exclusively on the basis of a standardized assessment of PTDB. We also included in our analyses 248 control recipients of single standard kidney transplants.
Materials and Methods
Study population
Recipients of marginal kidney transplants
We included all patients who received a single or dual kidney transplant between 2001 and 2009 from deceased donors after a standardized assessment of PTDB for the purpose of organ allocation at the Organ Procurement Organization of the Emilia-Romagna Region, Italy. The Organ Procurement Organization serves the kidney transplant centers of Parma, Bologna, and Modena. Indication for PTDB included donor age ≥65 years, renal dysfunction (estimated Creatinine Clearance <60mL/min), or proteinuria >1g/day. Donors evaluated by standardized assessment of PTDB will be referred to as marginal donors.
Recipients of dual transplants
Not all candidate recipients of a single kidney transplant were deemed suitable to receive dual transplantation and, due to the increased surgical risk, they had to sign an ad hoc informed consent at the time of wait-listing. Recipients of dual transplants were usually 55 years or older, had not received prior transplants, had acceptable aortoiliac vessels and adequate dimensions of the abdominal cavity allowing placement of two renal grafts. Patients regarded at increased perioperative risk because of coronary heart disease were usually not deemed suitable for receiving a dual transplantation. Dual kidneys were placed in the iliac fossa unilaterally or bilaterally at the discretion of the surgeon.
Standardized assessment of PTDB and kidney allocation
Kidneys were used for single or dual transplant, or were discarded, exclusively on the basis of PTDB results, regardless of the donor's clinical characteristics (9). Small, punch-biopsies, preferentially taken before aortic clamping, were sent to the centralized pathology laboratory at the Malpighi Hospital, Bologna, and read within 3 to 4 hours upon arrival by well-trained on-call pathologists. Permanent formalin-fixed sections were stained with hematoxylin and eosin, periodic acid-Schiff, Masson's trichrome and periodic acid-methenamine Silver. Each kidney structure (vessels, glomeruli, tubules, and connective tissue) was scored from 0 (no changes) to 3 (marked changes) according to Remuzzi et al.(9). The scores of each structure were summed up yielding a final score ranging from 0 to 12 per kidney. Kidneys with final score <4 were allocated as single transplants, and those with score 4 to 6 were allocated as dual transplant. When the sum of the left and right kidney score was above 12, kidneys were discarded. Since February 2005, because of changes in allocation policy, kidneys with score 4 were systematically used as single transplants. As a result, the proportion of PTDB-based allocation to single transplant with score=4 increased from 9.2 to 19.7%. Nonetheless, the proportion of dual transplants also increased (from 11.3 to 17.4%).
Recipients of Standard kidney transplants
As controls, we included all consecutive kidney transplant patients who received, between 2001 and 2013, a single deceased-donor kidney transplant at the Transplant Center of Parma, who had not undergone standardized assessment of PTDB and did not fulfill the clinical criteria used to define the Extended Criteria Donor (ECD) Program in the United States(21). These donors will be referred to as standard donors.
Allocation system
Allocation of every suitable kidney (single or dual) was based on a dedicated software algorithm which prioritized the level of HLA matching, donor-recipient age matching (highest score if ≤10yrs, worse if ≥20yrs), and time on the waiting list (22).
Data collection
In October 2007, an ad hoc database was established to investigate strategies to improve the allocation of marginal donors (Emilia-Romagna Program Region-University [P.R.U.] 2007–2009 “expansion strategies for the donor pool in solid organ transplantation”). Donors' clinical and histopathological data were extracted from the Organ Procurement Organization database, and recipients' data were extracted from the clinical charts of the three transplant Centers (Bologna, Modena, and Parma). Data collection was accomplished in two stages: retrospectively for transplants performed in the period February 2001-November 2006, and prospectively, on a reduced version of the same database, for the transplants performed during the period between January 2007 and December 2009. Hence, the follow-up period never exceeded five years. Data on standard controls were retrospectively collected in 2013 at the Parma Transplant Center and included all consecutive transplants performed form 2001 to 2013. They were extracted from the clinical charts, and from the database implemented at the same Center for routine clinical care.
We computed the KDPI using the open source calculator available at: http://optn.transplant.hrsa.gov/resources/allocationcalculators.asp?index=81 (23) that is based on the 2010 Organ Procurement and Transplantation Network (OPTN) deceased donor cohort. The KDPI is the percentile rank (from the 1st the 100th) of the KDRI with reference to a given OPTN deceased donor cohort. The KDRI represents the relative risk of post-transplant graft failure from a particular deceased donor compared to the donor in the 50th percentile of risk, with the recipient characteristics being set to the population average values (17). The KDRI scoring system was based on 10 deceased-donor variables (age, weight, height, creatinine, ethnicity, hypertension, diabetes, cause of death, HCV-positive donor and donation after cardiovascular death), with no donor having either of latter two characteristics (7).
Glomerular filtration rate was estimated according to the 4-variable MDRD formula (24). Albuminuria was defined as > 300mg/g urinary creatinine or equivalent definition. Systolic and diastolic blood pressures refer to office blood pressure measurements taken during routine visits. Delayed graft function (DGF) was defined as the need for dialysis during the first week after transplantation. We documented all cases of acute clinical rejection, defined by deterioration in graft function, proteinuria, or impaired function and histopathological changes, according to the consensus rules of the international Banff classification criteria (25).
Statistical Analysis
All analyses were performed using the statistical package Stata Statistical Software package, Release 12.0. (StataCorp, CollegeStation, TX). A two-tailed P value less than 0.05 was regarded as statistically significant unless otherwise stated.
We tested for any difference across the four categories using Kruskal-Wallis equality-of-populations rank test for continuous variables, and Fisher's exact test for categorical variables. Pairwise comparisons (Mann–Whitney test, or Fisher's exact test) were performed whenever P<0.05. To allow for multiple testing, only pairwise comparisons with P<0.01 were reported as statistically significant.
We used the Kaplan–Meier method to estimate the crude probability of uncensored and death-censored graft survival and the log-rank test to test the equality of survivor functions. We used Cox regression models to examine the multivariable-adjusted relationship between transplant category, KDPI, and graft failure.
With regard to the analysis of longitudinal (i.e. repeated measures) variables such as eGFR, systolic and diastolic blood pressure, we used repeated-measures linear mixed models using restricted maximum likelihood to account for the presence of unbalanced data (26)(27). We used random coefficient regression models to estimate changes over time in the presence of unbalanced data (26). The prevalence of albuminuria (coded as an indicator variable 1 if yes, 0 if otherwise) was examined by multiple logistic regression using generalized estimating equations with robust standard errors to account for repeated measurements in each patient (28). Multivariable-adjusted regression models included the following recipient characteristics: recipient age and gender, cold ischemia time, dialysis vintage, body weight, height, HLA mismatch level (29), re-transplant, induction treatment (indicator variates for basiliximab and Thymoglobulins), and type of calcineurin inhibitor (indicator variates for cyclosporine instead of tacrolimus). Predicted survival, eGFR, and proteinuria and their confidence intervals were calculated from predictions of the previously fit model at fixed values of the covariates.
A more detailed description of the statistical analysis is provided in the Supplementary Methods.
Results
Characteristics of discarded donor kidneys
Between November 2001 and December 2012, out of a total of 1,479 potential kidney donor offers in the Organ Procurement Organization of the three transplant centers, 182 (12.3%) were discarded. Only 37 of them (20.3%) were discarded because of a high histological score (1.8% of total donor offers). The discard rate was 14.9% (95%CI: 9.1 to 23.5), and 36.8% (95%CI: 30.3 to 43.9), among donors with KDPI 80-90, and KDPI 91-100, respectively. The median KDPI in the kidneys discarded of unfavorable PTDB findings was 95 (interquartile range 87-97), similar to the KDPI of the kidneys discarded for clinical reasons (median 94 [IQR 80-98], P=0.89). Estimated creatinine clearance and eGFR were also similar between kidneys discarded after PTDB vs the others (mean [SD] of eCrCl: 63.9 [21.1] vs 66.5 [29.5], P=0.96; mean [SD] of eGFR 71.2 [22.2] vs 75.6 [29.2], P=0.41).
Characteristics of the kidney transplant population
Donor characteristics
The study population included 248 kidney transplants from standard criteria donors (“STANDARD transplant”), and 442 kidney transplants from marginal donors evaluated by a standardized assessment of PTDB: 102 dual transplants (“DUAL transplant”), 278 single transplants with score<4 (“SINGLE Sc<4 transplant”), and 62 single transplants with score=4 (“SINGLE Sc=4 transplant”). Compared with donors of STANDARD transplants, marginal donors died significantly more often of cerebrovascular disease (P<0.01 for all pairwise comparisons), were significantly older, more often diabetic, hypertensive, and had worse renal function (Table 1). Not all marginal donors fulfilled the definition of ECD (Table 1). Cold ischemia time was slightly shorter in STANDARD transplants compared with the other three categories. DUAL transplants, SINGLE Sc<4 transplants, and SINGLE Sc=4 transplants had similar donor characteristics, with the exception of DUAL transplant donors being older compared with the other two categories (Table 1). The histological score distribution is reported in Figure 1. KDPI distribution in each group is reported in Figure 2, and in Table 1. STANDARD transplants had a uniform distribution across all KDPI values up to the value of 73, above which no STANDARD transplant occurred (Figure 2). About 75% of STANDARD transplants had KDPI below 50. Conversely, 66% of DUAL transplants, and about 40% of SINGLE Sc<4, and SINGLE Sc=4, had a KDPI between 91 and 100 (Table 1). The median KDPI (interquartile range) was 36 (18-51), 93 (86-96), 87 (76-93), and 87 (78-94) in STANDARD, DUAL, SINGLE Sc<4, and SINGLE Sc=4, respectively.
Table 1.
Donor characteristics.
| STANDARD (no PTDB) | Marginal | |||||
|---|---|---|---|---|---|---|
|
|
||||||
| All | DUAL | SINGLE Sc<4 | SINGLE Sc=4 | P value | ||
| N | 690 | 248 | 102 | 278 | 62 | |
| Age -yrs | 56.1(16.7) | 39.3(13.0) | 68.7(8.4) | 64.0(10.6) | 65.8(9.6) | <0.001a,b,c,d |
| Male gender -% | 65.7 | 61.3 | 70.6 | 67.6 | 71.0 | 0.23 |
| Diabetes-% | 8.1 | 1.2 | 10.8 | 12.9 | 11.3 | <0.001a,b,c |
| Hypertension-% | 39.7 | 9.3 | 53.9 | 55.8 | 62.9 | <0.001a,b,c |
| eCrCl –mL/min | 89.1(35.4) | 112.4(4.4) | 71.9(21.4) | 78.0(25.1) | 73.9(21.4) | <0.001a,b,c |
| eCrCL 30-59-% | 16.6 | 3.2 | 28.3 | 22.8 | 22.9 | <0.001a,b,c |
| eCrCL<30-% | 0.4 | 1.2 | 0.0 | 0.0 | 0.0 | 0.27 |
| eGFR -mL/min | 95.4(35.7) | 107.0(40.3) | 87.4(26.6) | 89.9(33.0) | 85.1(25.8) | <0.001a,b,c |
| eGFR 30-59-% | 10.4 | 3.2 | 14.0 | 13.8 | 16.4 | <0.001a,b,c |
| eGFR<30-% | 1.0 | 1.6 | 0.0 | 1.1 | 0.0 | 0.71 |
| CV Death-% | 63.5 | 43.6 | 79.2 | 73.7 | 61.3 | <0.001a,b |
| Weight- Kg | 74.0(13.4) | 73.0(15.1) | 73.7(13.3) | 74.7(12.5) | 76.3(11.3) | 0.28 |
| Height -cm | 169.2(9.0) | 171.0(10.1) | 167.7(8.0) | 168.4(8.3) | 168.9(8.5) | 0.002a,b |
| BMI - Kg/m2 | 25.8(4.1) | 24.9(4.5) | 26.2(4.0) | 26.3(3.8) | 26.8(3.5) | <0.001a,b,c |
| Obesity-% | 9.0 | 7.7 | 9.0 | 11.1 | 6.6 | 0.52 |
| CIT – hours | 16.4(5.5) | 14.8(6.4) | 17.8(4.1) | 17.2(5.0) | 17.9(5.0) | <0.001a,b,c |
| ECD donor-% | 52.2 | 0.0 | 85.0 | 78.0 | 88.5 | <0.001a,b,c |
| KDRI | 1.32(0.44) | 0.86(0.18) | 1.70(0.31) | 1.53(0.32) | 1.57(0.34) | <0.001a,b,c,d |
| KDPI | 66.6(29.6) | 35.0(19.2) | 89.3(9.9) | 82.6(15.1) | 83.9(15.2) | <0.001a,b,c,d |
| KDPI 80-90-% | 16.5 | 0.0 | 18.6 | 25.7 | 32.8 | <0.001a,b,c |
| KDPI 91-100-% | 29.7 | 0.0 | 66.0 | 41.8 | 39.3 | <0.001a,b,c,d,e |
Continuous data are reported as mean (standard deviation), categorical data as percentages.
Superscript letters indicate P<0.01 for pairwise comparisons as follows:
Standard vs Dual
Standard vs Single Sc<4
Standard vs Single Sc=4
Dual vs Single Sc<4
Dual vs Single Sc=4
Single Sc<4 vs Single Sc=4
PTDB, pre-transplant donor biopsy; STANDARD, Standard Criteria Donor kidney transplant; DUAL, Dual kidney transplant; SINGLE Sc. <4, Single kidney transplant with PTDB yielding a score<4; SINGLE Sc. =4, Single kidney transplant with PTDB yielding a score=4; eCrCl, estimated creatinine clearance (Cockroft-Gault); eGFR, estimated glomerular filtration rate (MDRD formula); CV Death, cerebrovascular death; BMI, body mass index, CIT, cold ischemia time; ECD, extended criteria donor; KDRI, kidney donor risk index (see text); KDPI, kidney donor risk index (see text).
Figure 1. Histological score distribution in the different types of kidney transplants.
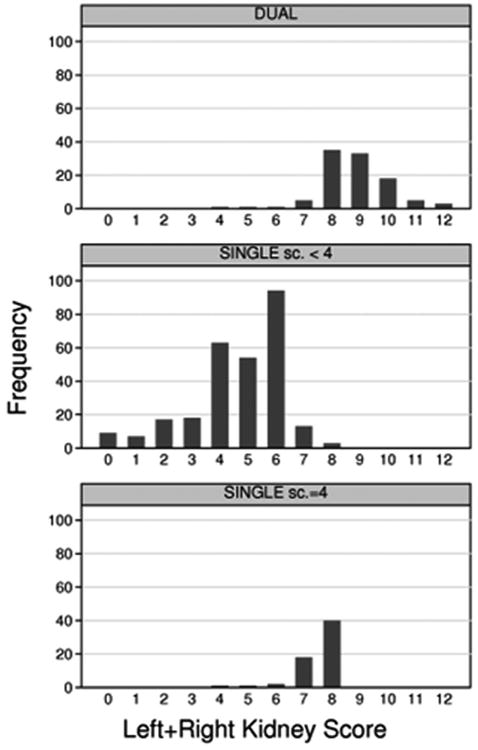
Histological score distribution of both kidneys in dual, SINGLE Sc<4 transplants and SINGLE Sc=4 transplants are shown in the upper, medium, and lower panel, respectively. There were 8/102 DUAL transplants (7.8%) from donors with a total score<8: they were usually donors with severe ultrasound abnormalities (e.g. huge and multiple cysts) casting doubts on the real amount of viable renal parenchyma; there were also 13/278 SINGLE Sc<4 transplants (4.7%) and 18/62 SINGLE Sc=4 transplants (29.0%) from donors receiving a total score of 7: they were instances in which one kidney was scored=4 and the other kidney=3 and both kidneys were allocated as single transplants (the numbers 13 and 18 do not match since not all kidneys were eventually transplanted because of technical problems or exchanges with other Organ Procurement Organizations); there were 3/278 SINGLE Sc<4 transplants (1.1%) from donor receiving a total score>7: they were cases in which the contralateral kidney had been discarded; finally, there were 4/62 SINGLE Sc=4 (6.5%) transplants from donor receiving a total score<7: they were instances in which the contralateral kidney received a score<=2.
STANDARD, Standard Criteria Donor kidney transplant; DUAL, Dual kidney transplant; SINGLE Sc. <4, Single kidney transplant with pre-transplant donor biopsy score<4; SINGLE Sc. =4, Single kidney transplant with pre-transplant donor biopsy score=4.
Figure 2. KDPI distribution in the different type of kidney transplants.

STANDARD transplants showed a uniform distribution across all KDPI values up to the value of 73, above which no STANDARD transplant occurred. The marginal kidneys had a left-skewed distribution, with the most KDPI values ranging between 85 and 100.
KDPI, Kidney Donor Profile Index; STANDARD, Standard Criteria Donor kidney transplant; DUAL, Dual kidney transplant; SINGLE Sc. <4, Single kidney transplant with pre-transplant donor biopsy score<4; SINGLE Sc. =4, Single kidney transplant with pre-transplant donor biopsy score=4.
Recipient characteristics
Compared with STANDARD transplants, recipients of marginal transplants (DUAL, SINGLE Sc<4, SINGLE Sc=4) were older (Table 2). Recipients of STANDARD transplants were also better HLA-matched than those of DUAL transplants, but the re-transplants were more frequent in STANDARD than in DUAL transplantation. DUAL transplant recipients had the shortest waiting time on dialysis.
Table 2.
Recipient characteristics.
| STANDARD (no PTDB) | Marginal | |||||
|---|---|---|---|---|---|---|
|
|
||||||
| All | DUAL | SINGLE Sc<4 | SINGLE Sc=4 | P value | ||
| N | 690 | 248 | 102 | 278 | 62 | |
| Age -yrs | 52.9(12.1) | 42.7(11.0) | 61.7(4.8) | 57.5(9.4) | 57.9(8.6) | <0.001a,b,c,d |
| Male gender-% | 65.7 | 61.3 | 70.6 | 67.6 | 71.0 | 0.23 |
| Hypertension-% | 74.6 | 66.1 | 83.2 | 79.1 | 69.3 | 0.001a,b |
| Diabetes-% | 5.9 | 6.0 | 1.0 | 6.5 | 8.1 | 0.091 |
| Obesity-% | 4.3 | 4.8 | 1.0 | 5.5 | 1.6 | 0.18 |
| BMI - Kg/m2 | 24.2(3.2) | 23.7(3.4) | 24.8(2.7) | 24.6(3.2) | 23.8(3.1) | 0.002a,b |
| Retransplant-% | 8.4 | 13.7 | 1.0 | 7.2 | 4.8 | <0.001a |
| Dialytic age | 4.5(3.4) | 4.8(3.8) | 3.6(2.6) | 4.6(3.4) | 4.6(2.8) | 0.017a,d |
| >4yrs | 39.9 | 44.3 | 29.4 | 39.0 | 45.1 | 0.054 |
| HCV status-% | 9.0 | 10.9 | 5.9 | 9.4 | 8.1 | 0.55 |
| CMV status | ||||||
| D+R+-% | 76.1 | 70.5 | 78.6 | 77.4 | 74.6 | 0.44 |
| D+R--% | 9.5 | 6.8 | 12.7 | 10.4 | 12.9 | 0.20 |
| D-R+-% | 6.4 | 6.4 | 4.9 | 6.8 | 6.4 | 0.95 |
| D-R--% | 3.8 | 2.5 | 3.1 | 4.5 | 3.6 | 0.83 |
| PRA>20%-% | 18.3 | 21.7 | 17.2 | 19.1 | 11.3 | 0.33 |
| HLA mm level | 2.8(0.7) | 2.8(0.7) | 3.0(0.8) | 2.8(0.7) | 2.9(0.6) | 0.02a |
| HLA mm level=4-% | 17.6 | 12.9 | 30.4 | 17.3 | 16.1 | 0.002a,d |
| Primarydisease | ||||||
| Hypertension-% | 11.9 | 7.7 | 18.6 | 12.6 | 8.1 | 0.02a |
| Diabetes-% | 2.9 | 2.8 | 0.0 | 1.8 | 3.2 | 0.28 |
| ADPKD-% | 15.9 | 12.9 | 12.7 | 19.1 | 17.7 | 0.19 |
| Glomerulonephritis -% | 30.9 | 32.3 | 39.2 | 27.8 | 29.0 | 0.19 |
| Others-% | 39.3 | 44.3 | 29.4 | 38.6 | 41.9 | 0.069 |
| Thymoglobulins-% | 16.9 | 20.2 | 22.5 | 13.4 | 9.7 | 0.029 |
| basiliximab-% | 74.0 | 71.8 | 66.7 | 76.9 | 82.3 | 0.078 |
| tacrolimus-% | 48.4 | 60.9 | 47.5 | 37.5 | 47.5 | <0.001b |
| cyclosporine-% | 51.1 | 39.1 | 52.5 | 61.0 | 51.1 | <0.001b |
| MPA-% | 70.5 | 68.5 | 75.2 | 68.8 | 70.5 | 0.64 |
| mTOR-i-% | 20.3 | 23.0 | 21.8 | 19.5 | 20.8 | 0.63 |
| steroid withdrawal-% | 7.5 | 3.6 | 7.8 | 10.1 | 9.8 | 0.021b |
Continuous data are reported as mean (standard deviation), categorical data as percentages.
Superscript letters indicate P<0.01 for pairwise comparisons as follows:
Standard vs Dual
Standard vs Single Sc<4
Standard vs Single Sc=4
Dual vs Single Sc<4
Dual vs Single Sc=4
Single Sc<4 vs Single Sc=4
PTDB, pre-transplant donor biopsy; ; STANDARD, Standard Criteria Donor kidney transplant; DUAL, Dual kidney transplant; SINGLE Sc. <4, Single kidney transplant with PTDB yielding a score<4; SINGLE Sc. =4, Single kidney transplant with PTDB yielding a score=4; BMI, body mass index; D, Donor and R, recipient positive (+), or negative(-) CMV serostatus; PRA, panel reactive antibody; HLA mm level [see ref.36]; ADPKD, Adult dominant polycystic kidney disease; MPA, mycophenolate acid (-mofetil or enteric coated sodium); mTOR-I, mTOR inhibitors (sirolimus or everolimus).
Graft survival
After a median follow-up of 3.3 years (interquartile range: 2.0-5.0 years), 47 patients died with a functioning graft, and 69 returned to dialysis.
Uncensored graft survival was similar between STANDARD and pooled marginal transplants (hazard ratio: 1.20 [95% confidence interval: 0.80 to 1.79; P=0.38]). However, compared to STANDARD transplants, uncensored graft survival was similar in DUAL transplants (P=0.98), whereas it was lower in SINGLE Sc<4 (P=0.013), and SINGLE Sc=4 (P<0.001) (Figure 3A). SINGLE Sc=4 had also inferior uncensored graft survival compared to SINGLE Sc<4 (P=0.033).
Figure 3. Graft survival in the four categories of kidney transplant.
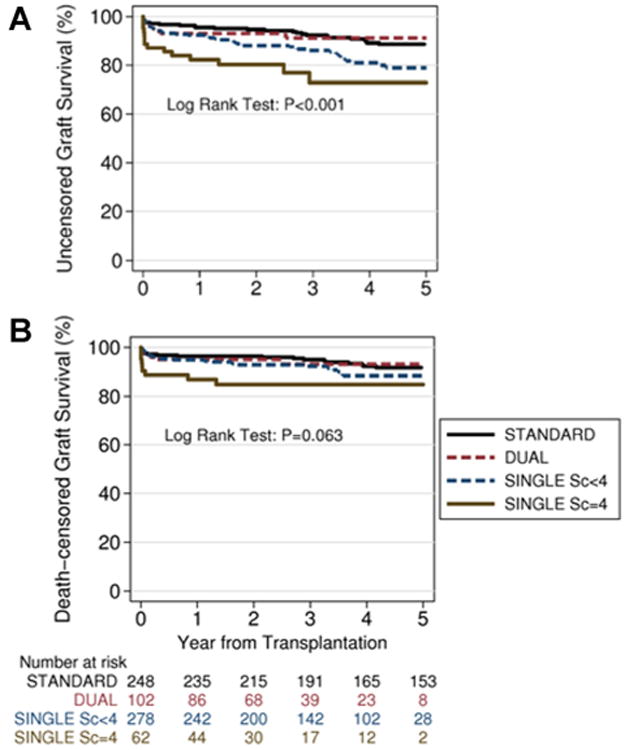
Panel A, uncensored graft survival. The Log rank test reported on the plot refers to the test for any difference between the four types of transplants. Compared to STANDARD transplants, uncensored crude graft survival was similar in DUAL transplants (P=0.98), whereas it was lower in SINGLE Sc<4 (P=0.013), and SINGLE Sc=4 (P<0.001). SINGLE Sc=4 had also inferior uncensored graft survival compared to SINGLE Sc<4 (P=0.033). Panel B, death censored graft survival.
STANDARD, Standard Criteria Donor kidney transplant; DUAL, Dual kidney transplant; SINGLE Sc. <4, Single kidney transplant with pre-transplant donor biopsy score<4; SINGLE Sc. =4, Single kidney transplant with pre-transplant donor biopsy score=4.
In the analyses stratified by type of transplant, for every 10-point increase in KDPI, the hazard ratio of graft failure was 1.12 (95%CI: 0.97 to 1.26; P=0.053). The relationship between KDPI and graft failure did not significantly change according to the type of transplant (P=0.61, for interaction between KDPI and type of transplant). Even after adjustment for KDPI, SINGLE Sc=4 remained the category with the lowest graft survival (Hazard Ratio= 2.08 [P=0.086], HR=3.63 [P=0.003], HR=1.93 [P=0.028], vs. STANDARD, DUAL, and SINGLE Sc<4, respectively). Results were similar after additional adjusting for recipient characteristics (data not shown). Covariate-adjusted predicted 1-, and 3-year survival for a hypothetical donor with KDPI=98 was 95.2% (95%CI: 90.3 to 97.7) and 91.7% (95%CI: 83.7 to 95.9) in DUAL, 91.2% (95%CI: 87.1 to 94.1) and 85.0% (95%CI: 79.0 to 89.4) in SINGLE Sc<4, and 83.6% (95%CI: 72.9 to 90.4) and 72.9% (95%CI: 57.5 to 83.4) in SINGLE Sc=4, respectively.
These results were roughly mirrored by the death-censored analysis. SINGLE Sc=4 transplants had lower death-censored graft survival compared to STANDARD transplant (P=0.008) and also, at a borderline significance level, compared to DUAL transplants (P=0.053) and SINGLE Sc<4 (P=0.083) (Figure 3B). Indeed, even after adjustment for KDPI, SINGLE Sc=4 remained the category with the lowest death-censored graft survival (HR= 1.86 [P=0.26], HR=2.85 [P=0.048], HR=2.05 [P=0.067], vs STANDARD, DUAL, and SINGLE Sc<4, respectively). Similar findings were obtained after additional adjustment for recipient characteristics (not shown).
Renal graft function
Figure 4 shows crude average estimated GFR (eGFR) at each time point in grafts surviving beyond 3 months post-transplantation. To allow for unbalanced data, we used mixed models for repeated measurements and reported the results in Table 3, which shows the estimate of 1-yr eGFR and the average eGFR slope (i.e. yearly linear decline in eGFR levels) in each group. Because the slope did not differ between groups (P=0.22) in either the crude or the adjusted analyses, the between-group difference in eGFR can be regarded as constant at each time point of follow-up.
Figure 4. eGFR changes over follow-up period.

Crude marginal means (dots) and standard deviation (bars) of the eGFR in the four groups amongst grafts surviving beyond month 3 post-transplantation.
eGFR, estimated glomerular filtration rate; STANDARD, Standard Criteria Donor kidney transplant; DUAL, Dual kidney transplant; SINGLE Sc. <4, Single kidney transplant with pre-transplant donor biopsy score<4; SINGLE Sc. =4, Single kidney transplant with pre-transplant donor biopsy score=4.
Table 3.
Estimated 1-yr eGFR and eGFR slope in each group.
| STANDARD | DUAL | SINGLE Sc<4 | SINGLE Sc=4 | P value | |
|---|---|---|---|---|---|
| 1-yr eGFR mL/min | 60.9 | 51.1 | 43.6 | 43.8 | P<0.001a,b,c,d,e,f |
| (95% CI) | (59.7 to 63.1) | (48.1 to 54.9) | (41.5 to 45.7) | (39.2 to 48.4) | |
| eGFR slope | -0.06 | -0.01 | +0.04 | +0.13 | P=0.22 |
| mL/min/yr | (-0.11 to -0.02) | (-0.11 to +0.09) | (-0.03 to +0.10) | (-0.01 to +0.26) | |
| (95% CI) | P=0.008 | P=0.81 | P=0.29 | P=0.063 | |
| P value |
P values in the rightmost column refers to the test of any difference between groups in average 1-yr eGFR and eGFR slope, respectively.
Superscript letters indicate P<0.01 for pairwise comparisons as follows:
Standard vs Dual
Standard vs Single Sc<4
Standard vs Single Sc=4
Dual vs Single Sc<4
Dual vs Single Sc=4
Single Sc<4 vs Single Sc=4
STANDARD, Standard Criteria Donor kidney transplant; DUAL, Dual kidney transplant; SINGLE Sc. <4, Single kidney transplant with PTDB yielding a score<4; SINGLE Sc. =4, Single kidney transplant with PTDB yielding a score=4; eGFR, estimated glomerular filtration rate; slope, yearly change of eGFR; 95% CI denotes 95 percent confidence interval.
Compared to STANDARD transplants, unadjusted 1-yr eGFR was -9.3mL/min (95% CI: -13.6 to -5.0; P<0.001), -17.9mL/min (95% CI: -21.0 to -14.7; P<0.001), and -18.8 mL/min (95% CI: -24.2 to -13.4; P<0.001) lower in DUAL, in SINGLE Sc<4, and in SINGLE Sc=4 transplants, respectively (DUAL compared to SINGLE Sc<4 and SINGLE Sc=4 transplants: P<0.001 and P=0.002, respectively; SINGLE Sc<4 vs SINGLE Sc=4: P=0.74).
The relationship between KDPI and eGFR differed according to the type of transplant. Indeed, there was a significant association between KDPI and 1-yr eGFR in STANDARD (P<0.001), DUAL (P<0.001), and SINGLE transplants Sc<4 (P<0.001), but no association in SINGLE Sc=4 transplants (P=0.55) (Figure 5 and Table 4). For every 10-point increase in KDPI, 1-yr eGFR decreased approximately -4mL/min in STANDARD transplant (P<0.001), -6mL/min in DUAL transplants (P<0.001), and -3mL/min in SINGLE Sc<4 transplants (P<0.001) (Figure 5 and Table 4). Because there were virtually no STANDARD transplants with KDPI>70 (Figure 2), the relationship between KDPI and 1-yr eGFR for KDPI values above 70 in STANDARD transplants must be regarded as artificial extrapolation. Table 4 reports actual KDPI (median and interquartile range) in the study population to allow for a better appraisal of the extent that these findings be translated into meaningful differences in real life conditions.
Figure 5. Predicted relationship between KDPI and 1-yr eGFR in each category.
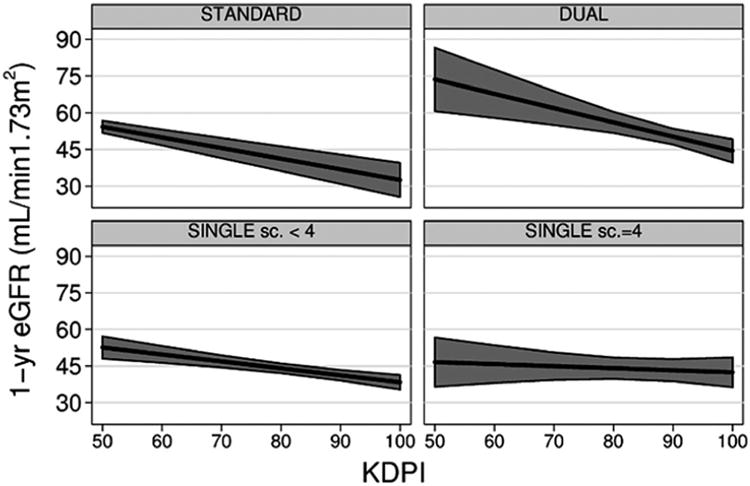
The relationship between KDPI and 1-yr eGFR was significant in STANDARD (P<0.001), DUAL (P<0.001), and SINGLE Sc<4 (P<0.001) transplants, but it was not significant in SINGLE Sc=4 transplants (P=0.55). Because there were virtually no STANDARD transplants with KDPI>70 (see Figure 2), the relationship between KDPI and 1-yr eGFR for KDPI values above 70 in STANDARD transplants must be regarded as an artificial extrapolation.
1-yr eGFR, estimated glomerular filtration rate at one year post-transplant; STANDARD, Standard Criteria Donor kidney transplant; DUAL, Dual kidney transplant; SINGLE Sc. <4, Single kidney transplant with pre-transplant donor biopsy score<4; SINGLE Sc. =4, Single kidney transplant with pre-transplant donor biopsy score=4.
Table 4.
Relation between KDPI and 1-yr eGFR in each group.
| STANDARD | DUAL | SINGLE Sc<4 | SINGLE Sc=4 | P value | |
|---|---|---|---|---|---|
| KDPI median | 36 | 93 | 87 | 87 | |
| [IQR] | [18-51] | [86-96] | [76-93] | [78-94] | |
| Crude Difference in 1-yr eGFR per 10 point increase in KDPI | -4.3 | -5.8 | -2.8 | -0.8 | P=0.027b,c,d,e |
| mL/min/yr | (-5.4 to -3.3) | (-9.0 to -2.6) | (-4.1 to -1.6) | (-3.5 to +1.9) | |
| (95% CI) | P<0.001 | P<0.001 | P<0.001 | P=0.55 | |
| P value | |||||
| Adjusted Difference in 1-yr eGFR per 10 point increase in KDPI | -3.9 | -6.4 | -2.6 | -0.6 | P=0.016c,d,e |
| mL/min/yr | (-5.1 to -2.7) | (-9.5 to -3.2) | (-4.0 to -1.3) | (-3.3 to +2.0) | |
| (95% CI) | P<0.001 | P<0.001 | P<0.001 | P=0.64 | |
| P value |
P value in the rightmost column refers to the test of any difference between groups in the relation between KDPI and 1-yr eGFR.
Superscript letters indicate P<0.10 for pairwise comparisons in crude analysis, and P<0.05 in adjusted analysis as follows:
Standard vs Dual
Standard vs Single Sc<4
Standard vs Single Sc=4
Dual vs Single Sc<4
Dual vs Single Sc=4
Single Sc<4 vs Single Sc=4
KDPI, Kidney Donor Profile Index (see text); STANDARD, Standard Criteria Donor kidney transplant; DUAL, Dual kidney transplant; SINGLE Sc. <4, Single kidney transplant with PTDB yielding a score<4; SINGLE Sc. =4, Single kidney transplant with PTDB yielding a score=4; eGFR, estimated glomerular filtration rate; IQR denotes interquartile range, 95% CI denotes 95 percent confidence interval.
Covariate-adjusted predicted 1-yr eGFR for a hypothetical donor with KDPI=98 was 45.1mL/min (95%CI: 40.8.6 to 49.3) in DUAL, 39.4mL/min (95%CI: 36.6 to 42.2) in SINGLE Sc<4, and 42.6mL/min (95%CI: 37.0 to 48.2) in SINGLE Sc=4, respectively.
Delayed graft function, acute rejection, proteinuria and hypertension
STANDARD transplants had the lowest incidence of delayed graft function, whereas the incidence of acute rejection was similar across the groups (Table 5).
Table 5.
Incidence of delayed graft function and acute rejection in each group.
| STANDARD | DUAL | SINGLE Sc<4 | SINGLE Sc=4 | P value | |
|---|---|---|---|---|---|
| Delayed Graft Function | 25.4 | 38.0 | 37.2 | 31.7 | P=0.020b |
| Acute Rejection | 15.1 | 10.8 | 15.5 | 9.7 | P=0.51 |
Numbers refer to percentages.
P values in the rightmost column refer to the test of any difference between groups Superscript letters indicate P<0.01 for pairwise comparisons as follows:
Standard vs Dual
Standard vs Single Sc<4
Standard vs Single Sc=4
Dual vs Single Sc<4
Dual vs Single Sc=4
Single Sc<4 vs Single Sc=4.
STANDARD, Standard Criteria Donor kidney transplant; DUAL, Dual kidney transplant; SINGLE Sc. <4, Single kidney transplant with PTDB yielding a score<4; SINGLE Sc. =4, Single kidney transplant with PTDB yielding a score=4
After 1 year of follow-up, the estimated prevalence of proteinuria, adjusted for KDPI and recipient risk factors, was 15.5% (95%CI: 9.8 to 21.3), 19.8% (95%CI: 12.8 to 26.7%), 28.8% (95%CI: 23.0 to 34.7%), and 42.1% (95%CI: 30.0 to 54.3) in STANDARD, DUAL, in SINGLE Sc<4, and in SINGLE Sc=4 transplants, respectively. Apart from the comparison between STANDARD and DUAL transplants, all the prevalence estimates differed statistically from each other (P<0.05 for the pairwise comparisons). Covariate-adjusted predicted 1-year prevalence of proteinuria for a hypothetical donor with KDPI=98 was 26.0% (95%CI: 17.8 to 34.3) in DUAL, 37.5% (95%CI: 30.9 to 44.2) in SINGLE Sc<4, and 52.9% (95%CI: 40.0 to 65.8) in SINGLE Sc=4 transplants, respectively.
Average systolic and diastolic blood pressure (at 1-yr follow-up: 134±15.3 and 80.1±7.7mmHg, respectively), did not differ between groups. However, adjusted analyses showed a significant association between KDPI and blood pressure: for a 10-point KDPI increase, systolic blood pressure was +1.0mmHg higher (95%CI: +0.3 to 1.6; P=0.003), and diastolic blood pressure was +0.5mmHg higher (95%CI: +0.2 to +0.8; P=0.002).
Discussion
We newly demonstrate that allocating marginal kidneys with KDPI in the highest range, to single or dual transplantation on the basis of the findings of a standardized and highly reproducible (30) PTDB assessment is associated with excellent outcomes and minimal discard rates.
By using the KDPI score, our report allows comparison of the present findings with those of future studies. In particular, our results compare favorably with those of a recent analysis of the OPTN/UNOS Registry (4), showing that discard rates for kidneys with KDPI between 80–90% and 90–100% are 36.3% and 62.5%, respectively, compared to only 14.9% and 36.8% in the present study. Thus, a PTDB-based allocation system of marginal kidneys halves the relative discard rate and allows a >25% absolute increase in the rate of recovery of kidneys with KDPI >80. Even taking into account that approximately 20% of these organs are transplanted in couple, we estimate that a PTDB-based strategy increases the number of kidney transplants from donors with a KDPI of 80-100 by above 20%, which corresponds to an overall increase in transplantation of approximately 4% considering the entire donor pool.
Our study confirms and expands previous evidence that histological criteria for allocation of marginal kidneys to single transplantation can be widened to include grafts with a score of 4 (31-33). Since those grafts represented almost 20% of the kidneys that underwent pre-transplant biopsy evaluation in our cohort, our results could have major implications in further expanding the pool of available donors. SINGLE Sc=4 transplants, however, showed inferior graft survival than the other categories of marginal kidneys and increased rates of proteinuria, raising a note of caution in allocating these kidneys to recipients with longer life expectancies
One may speculate that the implementation of a KDPI-based allocation algorithm might further increase discard rates of kidneys from marginal deceased donors, as some centers may not accept donors with extremely high KDPI values. As such, our findings suggest that a biopsy report supporting the suitability of the graft despite the high KDPI value (even for KDPI close to 100) could be important in reassuring transplant centers about the organ quality.
We acknowledge that a standardized PTDB assessment is logistically demanding, and the challenges of having kidney biopsies processed, properly stained, and examined on short notice (e.g. within 3-4 hrs) by an on-call, centralized pathology service (34) are significant. However, in consideration of its substantial impact in terms of kidney recovery, this option should be seriously considered.
A potential way to shorten the time of biopsy processing and partially ease the wider implementation of PTDB is the use of frozen sections to assess the organ quality, but studies assessing whether this approach is as informative as the standardized evaluation of formalin-fixed stained sections are lacking.
To the best of our knowledge, we included the largest retrospective series of marginal kidney transplants evaluated by standardized PTDB ever published. Our findings could be affected by the different factors involved in the allocation algorithm in each country. Nonetheless, our results are more generalizable than those of most previous studies, because we based our analyses on KDPI, allowing us to compare donor quality across different cohorts, and the Remuzzi score, which has been consistently associated with graft outcomes [18]. However, prospective studies are needed to confirm our findings on the effect of PTDB on discard rates, and outcomes. Moreover, our work shares the same bias of every other previous study, i.e. that recipients of dual kidney transplants had no aorto-iliac and coronary artery disease and were in better general condition than recipients of single transplants, which could explain their excellent outcomes. Although we, unlike most of the previous studies, adjusted the analyses for recipients characteristics, we cannot exclude that our findings were affected by residual confounding.
In conclusion, our study provides evidence that standardized PTDB assessment allows recovering kidneys with poor KDPI values, without compromising graft outcomes. These findings are important in the context of attempting to reduce the high discard rates of marginal kidneys in the US.
Supplementary Material
Acknowledgments
We thank Elisa Luzi for helping us with data extraction, and the transplant nurses Cristina Vallisa and Katia Mercati for their support and commitment in the follow-up of the patients. We are greatly indebted to Peter Heeger and Piero Ruggenenti for their helpful suggestions.
This work was supported by Research Program Region-University [P.R.U.] 2007–2009 “expansion strategies for the donor pool in solid organ transplantation”, Emilia Romagna Region, grant no. 1411 to U.M.
Abbreviations
- DUAL
Dual kidney transplant
- ECD
Extended Criteria Donor
- eGFR
estimated Glomerular Filtration Rate
- KDPI
Kidney Donor Profile Index
- KDRI
Kidney Donor Risk Index
- OPTN
Organ Procurement and Transplantation Network
- PTDB
Pre-Transplant Donor Biopsy
- SINGLE Sc. <4
Single kidney transplant with PTDB yielding a score<4
- SINGLE Sc. =4
Single kidney transplant with PTDB yielding a score=4
- STANDARD
Standard Criteria Donor kidney transplant
- UNOS
United Network Organ Sharing
Footnotes
Disclosure: The authors of this manuscript have no conflicts of interest to disclose as described by the American Journal of Transplantation.
Supporting Information: Additional Supporting Information may be found in the online version of this article.
References
- 1.Trends in transplantation: unadjusted rates, wait list, & total & functioning transplants, Figure 7.1 (Volume 2) [Accessed on 2014, February 13]; available at: http://www.usrds.org/adr.aspx.
- 2.Matas AJ, Smith JM, Skeans MA, Thompson B, Gustafson SK, Schnitzler MA, et al. OPTN/SRTR 2012 Annual Data Report: kidney. Am J Transplant. 2014;14(Suppl 1):11–44. doi: 10.1111/ajt.12579. [DOI] [PubMed] [Google Scholar]
- 3.Chavalitdhamrong D, Gill J, Takemoto S, Madhira BR, Cho YW, Shah T, et al. Patient and graft outcomes from deceased kidney donors age 70 years and older: an analysis of the Organ Procurement Transplant Network/United Network of Organ Sharing database. Transplantation. 2008;85:1573–9. doi: 10.1097/TP.0b013e31817059a1. [DOI] [PubMed] [Google Scholar]
- 4.Tanriover B, Mohan S, Cohen DJ, Radhakrishnan J, Nickolas TL, Stone PW, et al. Kidneys at higher risk of discard: expanding the role of dual kidney transplantation. Am J Transplant. 2014;14:404–15. doi: 10.1111/ajt.12553. [DOI] [PMC free article] [PubMed] [Google Scholar]
- 5.Sung RS, Christensen LL, Leichtman AB, Greenstein SM, Distant DA, Wynn JJ, et al. Determinants of discard of expanded criteria donor kidneys: impact of biopsy and machine perfusion. Am J Transplant. 2008;8:783–92. doi: 10.1111/j.1600-6143.2008.02157.x. [DOI] [PubMed] [Google Scholar]
- 6.Tso PL. Access to renal transplantation for the elderly in the face of new allocation policy: a review of contemporary perspectives on “older” issues. Transplantation reviews. 2014;28:6–14. doi: 10.1016/j.trre.2013.10.002. [DOI] [PubMed] [Google Scholar]
- 7.Rao PS, Schaubel DE, Guidinger MK, Andreoni KA, Wolfe RA, Merion RM, et al. A comprehensive risk quantification score for deceased donor kidneys: the kidney donor risk index. Transplantation. 2009;88:231–6. doi: 10.1097/TP.0b013e3181ac620b. [DOI] [PubMed] [Google Scholar]
- 8.Cravedi P, Ruggenenti P, Remuzzi G. Old donors for kidney transplantation: how old? Gerontology. 2011;57:513–20. doi: 10.1159/000320720. [DOI] [PubMed] [Google Scholar]
- 9.Remuzzi G, Grinyo J, Ruggenenti P, Beatini M, Cole EH, Milford EL, et al. Early experience with dual kidney transplantation in adults using expanded donor criteria. Double Kidney Transplant Group (DKG) J Am Soc Nephrol. 1999;10:2591–8. doi: 10.1681/ASN.V10122591. [DOI] [PubMed] [Google Scholar]
- 10.Shapiro R, Halloran PF, Delmonico FL, Bromberg JS. The ‘two, one, zero’ decision: what to do with suboptimal deceased donor kidneys. Am J Transplant. 2010;10:1959–60. doi: 10.1111/j.1600-6143.2010.03204.x. [DOI] [PubMed] [Google Scholar]
- 11.Gill J, Cho YW, Danovitch GM, Wilkinson A, Lipshutz G, Pham PT, et al. Outcomes of dual adult kidney transplants in the United States: an analysis of the OPTN/UNOS database. Transplantation. 2008;85:62–8. doi: 10.1097/01.tp.0000296855.44445.af. [DOI] [PubMed] [Google Scholar]
- 12.ERBP Guideline on the Management and Evaluation of the Kidney Donor and Recipient. Nephrol Dial Transplant. 2013;28(Suppl 2):ii1–71. doi: 10.1093/ndt/gft218. [DOI] [PubMed] [Google Scholar]
- 13.Navarro MD, Lopez-Andreu M, Rodriguez-Benot A, Ortega-Salas R, Morales ML, Lopez-Rubio F, et al. Significance of preimplantation analysis of kidney biopsies from expanded criteria donors in long-term outcome. Transplantation. 2011;91:432–9. doi: 10.1097/TP.0b013e318204bdd7. [DOI] [PubMed] [Google Scholar]
- 14.Andres A, Morales JM, Herrero JC, Praga M, Morales E, Hernandez E, et al. Double versus single renal allografts from aged donors. Transplantation. 2000;69:2060–6. doi: 10.1097/00007890-200005270-00015. [DOI] [PubMed] [Google Scholar]
- 15.De Serres SA, Caumartin Y, Noel R, Lachance JG, Cote I, Naud A, et al. Dual-kidney transplants as an alternative for very marginal donors: long-term follow-up in 63 patients. Transplantation. 2010;90:1125–30. doi: 10.1097/TP.0b013e3181f8f2b8. [DOI] [PubMed] [Google Scholar]
- 16.Palmes D, Wolters HH, Brockmann J, Senninger N, Spiegel HU, Dietl KH. Strategies for compensating for the declining numbers of cadaver donor kidney transplants. Nephrol Dial Transplant. 2004;19:952–62. doi: 10.1093/ndt/gfh043. [DOI] [PubMed] [Google Scholar]
- 17.Snanoudj R, Rabant M, Timsit MO, Karras A, Savoye E, Tricot L, et al. Donor-estimated GFR as an appropriate criterion for allocation of ECD kidneys into single or dual kidney transplantation. Am J Transplant. 2009;9:2542–51. doi: 10.1111/j.1600-6143.2009.02797.x. [DOI] [PubMed] [Google Scholar]
- 18.Maggiore U, Cravedi P. The marginal donor. Current Opin Organ Transplant. 2014 doi: 10.1097/MOT.0000000000000081. Published ahead-of-print. [DOI] [PMC free article] [PubMed] [Google Scholar]
- 19.Bunnapradist S, Gritsch HA, Peng A, Jordan SC, Cho YW. Dual kidneys from marginal adult donors as a source for cadaveric renal transplantation in the United States. J Am Soc Nephrol. 2003;14:1031–6. doi: 10.1097/01.asn.0000054494.85680.1c. [DOI] [PubMed] [Google Scholar]
- 20.Tan JC, Alfrey EJ, Dafoe DC, Millan MT, Scandling JD. Dual-kidney transplantation with organs from expanded criteria donors: a long-term follow-up. Transplantation. 2004;78:692–6. doi: 10.1097/01.tp.0000130452.01521.b1. [DOI] [PubMed] [Google Scholar]
- 21.Ojo AO. Expanded criteria donors: process and outcomes. Semin Dial. 2005;18:463–8. doi: 10.1111/j.1525-139X.2005.00090.x. [DOI] [PubMed] [Google Scholar]
- 22.Available at: http://www.saluter.it/trapianti/normativa-regionale. Accessed on 2014, February 13
- 23.Available at: http://optn.transplant.hrsa.gov/resources/allocationcalculators.asp?index=81. Accessed on 2014, February 13
- 24.Levey AS, Bosch JP, Lewis JB, Greene T, Rogers N, Roth D. A more accurate method to estimate glomerular filtration rate from serum creatinine: a new prediction equation. Modification of Diet in Renal Disease Study Group. Ann Intern Med. 1999;130:461–70. doi: 10.7326/0003-4819-130-6-199903160-00002. [DOI] [PubMed] [Google Scholar]
- 25.Solez K, Colvin RB, Racusen LC, Sis B, Halloran PF, Birk PE, et al. Banff '05 Meeting Report: differential diagnosis of chronic allograft injury and elimination of chronic allograft nephropathy (‘CAN’) Am J Transplant. 2007;7:518–26. doi: 10.1111/j.1600-6143.2006.01688.x. [DOI] [PubMed] [Google Scholar]
- 26.Laird NM, Ware JH. Random-effects models for longitudinal data. Biometrics. 1982;38:963–74. [PubMed] [Google Scholar]
- 27.Stata longitudinal data/panel data reference manual release 12. College Station, TX: Stata Press; 2011. [Google Scholar]
- 28.Diggle PJ, Liang KY, Zeger SL. Marginal models, generalized estimating equation approach. In: Atkinson AC, Copas JB, Pierce DA, Schervish MJ, Titterington DM, editors. Analysis of longitudinal data. Oxford: Oxford Science Publications; 1994. pp. 146–168. [Google Scholar]
- 29.Libri I, Gnappi E, Zanelli P, Reina M, Giuliodori S, Vaglio A, et al. Trends in immune cell function assay and donor-specific HLA antibodies in kidney transplantation: A 3-year prospective study. Am J Transplant. 2013;13:3215–22. doi: 10.1111/ajt.12503. [DOI] [PubMed] [Google Scholar]
- 30.Antonieta Azancot M, Moreso F, Salcedo M, Cantarell C, Perello M, Torres IB, et al. The reproducibility and predictive value on outcome of renal biopsies from expanded criteria donors. Kidney Int. 2013 doi: 10.1038/ki.2013.461. [DOI] [PubMed] [Google Scholar]
- 31.Losappio V, Stallone G, Infante B, Schena A, Rossini M, Maiorano A, et al. A Single-Center Cohort Study to Define the Role of Pretransplant Biopsy Score in the Long-term Outcome of Kidney Transplantation. Transplantation. 2014;97:934–9. doi: 10.1097/01.TP.0000438208.50089.29. [DOI] [PubMed] [Google Scholar]
- 32.Fernandez-Lorente L, Riera L, Bestard O, Carrera M, Goma M, Porta N, et al. Long-term results of biopsy-guided selection and allocation of kidneys from older donors in older recipients. Am J Transplant. 2012;12:2781–8. doi: 10.1111/j.1600-6143.2012.04153.x. [DOI] [PubMed] [Google Scholar]
- 33.Carta P, Zanazzi M, Caroti L, Buti E, Mjeshtri A, Di Maria L, et al. Impact of the pre-transplant histological score on 3-year graft outcomes of kidneys from marginal donors: a single-centre study. Nephrol Dial Transplant. 2013;28:2637–44. doi: 10.1093/ndt/gft292. [DOI] [PubMed] [Google Scholar]
- 34.Azancot MA, Moreso F, Salcedo M, Cantarell C, Perello M, Torres IB, et al. The reproducibility and predictive value on outcome of renal biopsies from expanded criteria donors. Kidney Int. 2014;85:1161–8. doi: 10.1038/ki.2013.461. [DOI] [PubMed] [Google Scholar]
Associated Data
This section collects any data citations, data availability statements, or supplementary materials included in this article.