



Abstract
OBJECTIVE
Magnetic stimulation (MS) is a potential treatment for neuropsychiatric disorders. This study investigates whether MS-regulated neuronal activity can translate to specific changes in neuronal arborization and thus regulate synaptic activity and function.
APPROACH
To test our hypotheses, we examined the effects of MS on neurite growth of Neuroscreen-1 (NS-1) cells over pulse frequencies of 1, 5 and 10 Hz at field intensities controlled by machine output (MO). Cells were treated with either 30% or 40% MO and received either maximal or minimal MS-induced current-density. Due to the nature of circular MS coils, the center region of the gridded coverslip (zone 1) received minimal (~5%) electromagnetic current density while the remaining area (zone 2) received maximal (~95%) current density. Plated NS-1 cells were exposed to MS twice per day for 3 days and then evaluated for length and number of neurites and expression of brain-derived neurotrophic factor (BDNF).
MAIN RESULTS
We show that MS dramatically affects the growth of the longest neurites (axon-like) but does not significantly affect the growth of shorter neurites (dendrite-like). Also, MS-induced changes in the longest neurite growth were most evident in zone 1, but not in zone 2. MS effects were intensity-dependent and were most evident in the bolstering of the longest neurite outgrowth, mainly seen in the 10 Hz MS group. Furthermore, we found that MS-increased BDNF expression and secretion was also frequency-dependent. Taken together, our results show that MS exerts distinct effects when different frequencies and intensities are applied to the neuritic compartments (longest neurite versus shorter dendrite(s)) of NS-1 cells.
SIGNIFICANCE
These findings support the concept that MS increases BDNF expression and signaling, which sculpts longest neurite arborization and connectivity by which neuronal activity is regulated. Understanding the mechanisms underlying MS is crucial for efficiently incorporating its use into potential therapeutic strategies.
Keywords: magnetic stimulation, neurite outgrowth, Neuroscreen-1 (NS-1) cells
1. Introduction
Repetitive transcranial magnetic stimulation (rTMS) is a nonsurgical method of brain stimulation with minimal side effects that can be used to modulate neuronal activity (Ma et al., 2013). Increasing or decreasing cortical activity depends primarily on the stimulation frequency and intensity applied. High-frequency (>1 Hz) stimulation generally results in facilitation, while low-frequency (<=1 Hz) rTMS generally induces a reduction in synaptic efficiency, which in turn raises or lowers cortical excitability, respectively (Houdayer et al., 2008). rTMS has been shown to have significant therapeutic potential for various neurological and psychiatric disorders since its commercial advent in 1985 (Barker et al., 1985). The mechanisms by which rTMS modifies cortical activity have yet to be established in detail, but are considered to be related to synaptic plasticity (Thickbroom et al., 2006). It has also been proposed that rTMS produces changes in plasticity akin to long-term depression (LTD) or potentiation (LTP) (Hoogendam et al., 2010; Huerta and Volpe, 2009; Thickbroom, 2007). While the mechanisms by which rTMS produces these effects have not been fully elucidated, there is evidence indicating that the expression of brain-derived neurotrophic factor (BDNF) might be a downstream target of rTMS or magnetic stimulation (MS) (Gersner et al., 2011; Ma et al., 2013).
MS functions by pulsing currents through a coil of wires, which in turn generates an orthogonal magnetic field that induces an electric field in conductive materials. In a case such as neurons, this can ultimately trigger action potentials and the release of neurotransmitters (Huerta and Volpe, 2009). An important but unknown issue is how neuronal activity translates to specific changes in the growth of neurites due to its influence over synaptic structure and function. Pulsed magnetic fields (PMF) have been used to stimulate the growth of neurons and neurites both in vivo and in vitro (Macias et al., 2000). Through computational analysis of PMF stimulation, it is known that stimulation of neurons by MS occurs mainly through depolarization of the soma, followed by action potential initiation in the initial segment of the axon (Pashut et al., 2011).
Neuronal cell morphology, including neurite outgrowth and total neurite volume, is modulated by a variety of conditions including functional maturation and differentiation of neurons as well as trophic factors, synaptogenesis and electrical activity (Fields and Nelson, 1992; Thoenen, 1991; Van Ooyen et al., 1995). Moreover, ample evidence supports an important role for BDNF in the survival, development, differentiation, and regeneration of neurons (Huang and Reichardt, 2001) as well as in synaptic transmission and plasticity (Bramham and Messaoudi, 2005; Gersner et al., 2011; Waterhouse and Xu, 2009). rTMS affecting BDNF levels has been suggested based on clinical and animal studies, though the results have been highly variable (Ma et al., 2013; Ogiue-Ikeda et al., 2003). Furthermore, limited reports exist on the relationship between stimulus intensity and neurite arborization. The influence of MS in vitro on cultured neurons provides an ideal model to investigate its effects on neuritogenesis.
Our study investigates the effects of three MS parameters when applied to cultured Neuroscreen-1 (NS-1) cells: (1) pulse frequencies at 1, 5 and 10 Hz; (2) machine output (MO) at 30% and 40%; and (3) maximal- versus minimal- induced current density (A/mm2). MS effects were measured by changes in neurite length or number of MS-stimulated NS-1 cells. Significant effects were only seen in the groups treated with 10 Hz MS, showing an increase in both neurite lengths and number per cell; 1 Hz treatment, on the other hand, produced a minor decrease in neurite length. Neurite data was further explored to distinguish the longest neurite (presumably the axon) and shorter dendrites of every single NS-1 cells. MS was found to have a negligible influence over shorter dendrite outgrowth. Longest neurite lengths, however, were heavily influenced by higher frequency MS treatments, significantly elongating longest neurites with 10 Hz treatment and 5 Hz MS to a lesser extent. In both cases, results were augmented by increases in MO (from 30% to 40%). All cases of longest neurite elongation were dramatically weaker in zone 2 (Z2) (near maximal-induced current density) than in zone 1 (Z1) (minimal-induced current density). In concurrence with previous findings, this study supports several theories explaining the mechanisms for the effects of MS.
2. Materials and Methods
2.1. Cell Cultures
NS-1 cells (ThermoFisher Scientific, Waltham, MA), subclones of rat pheochromocytoma (PC12), are known for their ideal sensitivity to neuron growth factor (NGF) and arborization of both dendrites and axons (Yeyeodu et al., 2010) and were chosen to investigate the effects of MS on neuronal morphology. NS-1 cells were subcultured twice a week in a flask of complete medium mixture of RPMI 1640 with 10% horse serum, 5% fetal bovine serum (FBS), 2 mM glutamine, 100 μg/ml penicillin/streptomycin (Life technologies, Grand Island, NY) and 5 ng/ml neurotrophic growth factor (NGF; R&D Systems, Minneapolis, MN) at 37°C in a 5% CO2 and humidified incubator. 200 μl of type I collagen solution (10 μg/ml, Sigma-Aldrich, St. Louis, MO) were coated on circular glass coverslips (18mm diameter; Fisher Scientific, Vernon Hills, IL) in the center of 35 × 10mm culture dishes (Becton Dickinson, San Jose, CA). NS-1 cells were then seeded at 5 × 10⁴ densities in 2 ml of complete medium and allowed to attach overnight to the glass coverslips. The next day, prior to MS, the complete medium was exchanged to the medium containing RPMI 1640 with 2% FBS, 2 mM glutamine, 100 μg/ml penicillin/streptomycin and 2 ng/ml NGF for three days of MS treatment. In some experiments, NS-1 cells were grown on gridded coverslips (MatTek, Ashland, MA) composed of 520 alphanumeric squares. Each square measured 600×600 microns with 20-micron separations between adjacent squares. Z1 was defined by the 12×16 central squares, amounting ~55% of the grid space, which fully encompassed the approximated MS dead zone elaborated in 2.3 COMSOL Methodology. Cells seen in the remaining bordering squares were classified as Z2. Z1 was further segmented into inner and outer zones (Z1i, Z1o respectively) in order to measure the radial changes in induced electric currents from the coil center on neurite outgrowth. Cells associated with Z1i were measured from the central 6×6 inner squares, leaving Z1o cells with the remaining Z1 squares (figure 5(A)).
Figure 5.

MS intensity differentially increased longest neurite growth. The following results were derived from three representative experiments measuring neurite length and number in zones 1 and 2 of gridded coverslips after MS (30% MO) to either 1, 5, or 10 Hz. (A) Schematic of the gridded coverslip divided into Z1 and Z2, where NS-1 cells received minimal (Z1) and maximal (Z2) MS-induced current densities. Z1 was further segmented into Z1 inner (Z1i) and Z1 outer (Z1o) in order to test for effects from detailed changes in induced current density. Z1 and Z2 regions were established to distinguish cells either in or out of rdz and their respective electric field distributions in our experimental model. If we consider 100% induced current density as maximal MS efficiency, Z1i was subject to <~5% efficiency, Z1o between ~10–30%, and Z2 primarily ~95% efficiency. Zonal differential data between Z1 and Z2 are illustrated via shorter dendrite (B) and longest neurite (C) lengths and percentage of longest neurites within specified greater lengths range groups (E). Similarly, Z1i and Z1o differential neurite lengths are compared in (D). Bars show mean ± SEM values. * p<0.05, ** p <0.01, *** p<0.005 vs. sham MS group; # p<0.05, ### p<0.005 vs. 1 Hz MS group; Ω p<0.05 vs. 5 Hz MS group; ♮ p<0.05, ♮♮♮p<0.005 vs. 10 Hz MS group; Two-way ANOVA with Bonferroni post-hoc tests.
2.2. MS and experimental groups
MS was delivered with a MC-125 circular coil (inner/out diameter: 28 mm/114 mm; MagVenture, Atlanta, GA) connected to a Cadwell Magneto-Electric Stimulator machine (MES-10; Kennewick, WA). All MS was administered using biphasic waveforms. Dishes of cultured NS-1 cells were randomly divided into control, sham MS-treated (sham), and MS (1, 5 or 10 Hz at 30% or 40% MO) groups (3 dishes/experiment/group, 3~5 experiments/group). Control NS-1 cells remained in the incubator for 4 days. Sham NS-1 cells were handled in the same manner as the MS groups, excluding the MS treatment. MS groups were stimulated for 3 days after plating (days 2–4). Each culture dish with the coverslip inside was placed directly above and aligned with the MS coil center. Stimulation from the circular MS coil resulted in a radius-dependent electromagnetic effect on coverslips as illustrated in figures 1(A) and 1(B). Field strengths estimated via COMSOL Multiphysics® were calculated at the culture level. MS was performed twice daily, once in the early morning and again in the late afternoon. Each MS session included two 1-min MS cycles, divided by a 5-min intercycle rest. For all treatment groups, MS cycles consisted of 2-sec MS trains followed by 2-sec intertrain intervals. In other words, MS cycles were composed of 15 MS trains. Intervals were necessary to reduce stress and heat on the cells (figures 1(C) and (D)). Cells from all groups were harvested at the same time on day 4 after plating for immunocytochemistry.
Figure 1.
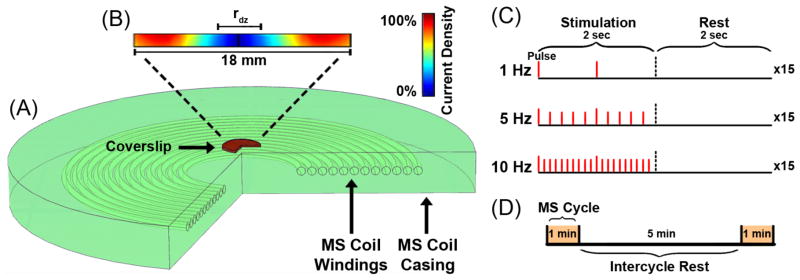
MS-induced current density on coverslips containing cultured NS-1 cells and the MS protocol. (A) A 3-D model of the experimental setup was constructed using COMSOL Multiphysics® CAD software, including the geometries and relative positions of both the MS coil and coverslip during stimulations, defined by the electric current per unit area of a cross section. (B) The color bar represents the induced current density (A/mm2) distribution in the coverslip, where maximum and minimum measurements are colored red and blue, respectively. (C) For all MS frequency groups, MS cycles consisted of fifteen 2-sec stimulation trains followed by 2-sec intertrain intervals for a MS cycle of 1-min total. The pulse distribution per group is illustrated by each red line in the stimulation time frame. (D) MS treatment consisted of two MS cycles, as illustrated in (C), separated by a 5-min intercycle interval.
2.3. COMSOL Methodology
The physics behind MS are explained by the principle concepts of electromagnetism. Current generated through a MS coil produces orthogonal magnetic fields, which can be aimed at conductive materials to induce electrical currents, such as depolarizing neurons. In other words, targeted NS-1 cells are stimulated via electromagnetic induction, which forces coherent motion of intracellular free charges. Many field characteristics of MS are determined by the MS coil winding geometry; thus, the induced electric fields are most concentrated beneath the MS coil windings. The coverslip containing neurons was stimulated directly above the radial center of the coil. With the aid of computer-aided design software, COMSOL Multiphysics®, we simulated our experimental setup to estimate values for our dead zone (dz) area and induced electric current densities. The majority of calculations were direct applications of Maxwell-Faraday’s equations. Specifically, the vector potential A(r, t) was used to model the electric field: (1) A(r, t) = μ0NI(t)/4 π ∫ dl/|r − r0|. Where μ0 is the permeability of free space, N is the number of turns in the MS coil windings, I(t) is the time-dependent coil current, dl is a vector oriented according to the direction of each current element, and |r – r0| is the distance from each point (r) to the current element (r0). The curl of magnetic (B) fields generated by steady currents are equal to zero, which in turn relates the magnetic field and vector potential as: (2) B = ∇ × A. The induced dead zone radius (rdz) was calculated to be ~5 mm, and the maximal induced current density at ~35 mA as illustrated in figure 1. As a result, the induced electric field distribution on the coverslip can be categorized in two zones: a Z1 region centered on the axis of the MS coil windings receiving minimal induced current density (~5%), and a Z2 region, the remaining periphery of the coverslip, exposed to near maximal induced current density (~95%) (figure 5(A)). As mentioned in 2.1 Cell Cultures, Z1 was further broken down into Z1i and Z1o. Via COMSOL Multiphysics® simulation, we expected induced current density in Z1i to effectively be zero (<~5%). Likewise, Z1o induced current density measures between ~10–30%. The grids and zones allowed us to create a system for every coverslip where we could distinguish and measure an essentially full-dose treatment in Z2 and compare data to a fractional-dose treatment in Z1. This experimental setup made it possible to differentially measure NS-1 cells and their growing neuritic arbors in current-isolation zones.
2.4. Immunocytochemistry
Upon completion of MS, NS-1 cells were fixed in 4% paraformaldehyde and processed for immunocytochemistry. After blocking in phosphate-buffered saline (PBS) supplemented with 2% Bovine Serum Albumin (BSA) and 0.1% Triton X-100, NS-1 cells were stained with HCS CellMask Red (0.5 μg/ml, Invitrogen, Eugene, OR) (Yeyeodu et al., 2010) followed by a DAPI-containing mounting medium. Images were captured with the QCapture Pro software and neurite lengths and number were measured using ImageJ.
2.5. Morphological analysis
The number and length of neurites per NS-1 cell were used as indications of branching and neurite outgrowth. In each experiment, at least 5 randomly selected fields per zone in each dish, with 3 dishes per experiment and 3~5 experiments per group, were taken. The following parameters were then analyzed: the neurites (longest neurite and shorter dendrites of individual NS-1 cell) of cultured NS-1 cells were identified from phase-contrast imaging of the selected fields at 20x magnification. Cells either touching or with neurites overlapping one another were explicitly omitted from analysis due to the potential growth factors that may have masked the direct effects of MS. Images were then processed in image processing software, ImageJ, where neurites were manually traced with a Wacom tablet to measure length and branch number. Average lengths of the neuritic arbour were then obtained by dividing the total length of neurites by the number of neurons measured. The longest neurites were distinguished from shorter dendrites via longest neurite length values per NS-1 cell. Approximately 120 cells per experiment in each group were analyzed.
2.6. BDNF ELISA
After MS, NS-1 cells were homogenized in lysis buffer 100mM PIPES (pH 7), 500mM NaCl, 0.2% Triton X-100, 0.1% NaN3, 2% BSA, 2mM EDTA·Na2·2H2O (Szapacs et al., 2004) containing complete protease inhibitor cocktail (Roche, South San Francisco, CA). Sample protein content was measured (BioRad Protein Assay: BioRad Laboratories, Hercules, CA) and volumes were adjusted to normalize for protein content. Aliquots were then processed for BDNF ELISA using the BDNF Emax Immunoassay System (Promega, Madison, WI) as described by the manufacturer. To measure total BDNF, cell lysates were acid-treated and then neutralized before proceeding with ELISA. To measure mature BDNF (mBDNF), the ELISA protocol was performed without acid treatment. The BDNF levels were determined relative to a standard curve constructed from measures of the kit-supplied BDNF protein standards (0–500 pg BDNF protein) that were assayed simultaneously with experimental samples. Data are presented as means±SEM pg BDNF/μg of sample protein content.
2.7. Statistical analysis
All values are reported as mean ± SEM and all tests were repeated more than three times in each group. Statistical significance was assessed by analysis of variance (Two-way ANOVA) followed by Bonferroni post-hoc tests between groups using the Statistical Analysis software GraphPad Prism 5.0 (GraphPad, La Jolla, CA). P< 0.05 is considered as significant: * p<0.05, ** p <0.01, *** p<0.005 vs. sham MS group; # p<0.05, ## p <0.01, ### p<0.005 vs. 1 Hz MS group; Ω p<0.05, ΩΩ p <0.01, ΩΩΩ p<0.005 vs. 5 Hz MS group; ♮p<0.05, ♮♮ p <0.01, ♮♮♮p<0.005 vs. 10 Hz MS group.
3. Results
3.1. Induced current density of circular MS coils
The coverslips were positioned directly above and centered on the MC-125 circular MS coil (figure 1(A)) for stimulation. Due to the geometry of the circular, pancake-winding MS coil (13 turns), the induced electric field was maximal directly below the coil windings but minimal below the center of the coil within rdz. The rdz in our experiment was ~5 mm, illustrated using computer-aided design software, COMSOL Multiphysics®, and referencing studies with similar experimental parameters (Ruohonen, 2003; Salinas et al., 2007; Zheng et al., 2005). The COMSOL simulation also allowed us to model our experimental setup and the electromagnetic induction and to map the distribution of induced current density in the coverslip as portrayed in figure 1(B). The maximum induced current density was estimated to be ~35 mA (100%) and the minimum was ~0 mA (0%).
3.2. Frequency-dependent effects of MS on neurite outgrowth
In the present study, we determined if the frequency of MS exerts effects on the morphological differentiation of NS-1 cells. NS-1 cells were visualized with red fluorescent HCS CellMask dye and blue fluorescent DAPI dyes in order to stain DNA in the nucleus. The morphology of NS-1 cells was investigated using both inverted phase contrast microscopy and fluorescent microscopy.
NS-1 cells exhibited a population of large, well-spread neuron-like cells with extensive neurites, allowing for visualization and quantitation of the number and length of neurites. We used low-density NS-1 cells that allowed us to monitor the effects of MS on individual NS-1 cells and to precisely identify the number and length of neurites. It has been known that twenty-four hours after hippocampal neurons plating, one of the neurites starts to elongate to become axon, the longest neurite eventually (Dotti et al., 1988). However, it is not readily discernible for the outgrowth of distinct axons and dendrites when NS-1 cells are cultured in low density and limited concentration of NGF. In fact, after a few hours in culture, NS-1 cells developed lamellipodia which gradually formed into neurites. Our control and sham NS-1 cells showed similar morphology, including large somata and neurites with distinct axon-like (the longest neurite) and dendrite-like (shorter neurites) features, which were similar across numbers and lengths, confirming there was no effect of environmental changes due to the experimental procedures needed to conduct MS (data not shown). Neurites of NS-1 cells were measured in cultures harvested 3 days after the onset of MS. Figure 2(A) represents the averages of neurite lengths allowing for examination of MS frequency effects on neurite lengths against the sham group. NS-1 cells exposed to MS at 30% MO expressed significant changes in neurite lengths in comparison to sham only at 10 Hz MS. 1 Hz MS-treated neurites produced a ~12% decrease in length, 5 Hz MS produced a ~7.5% increase in neurite length, and 10 Hz MS produced a significant (~22.5%) increase in neurite length. In all MS-treated groups, neurites increased in length over time, 3 and 4 days after onset of MS (data not shown). Neurite counts per cell are shown in figure 2(B), where MS-treated groups had varied degrees of positive influence over neurite counts per cell in comparison to the sham group. 1 Hz and 5 Hz MS treatments produced non-significant increases in neurite counts, while 10 Hz MS treatment resulted in an additional neurite per cell as compared to the sham group. In summary, relative to the sham group, the 10 Hz MS group contained significantly increased numbers of neurites per cell and longer neurites on average. 10 Hz MS treatment also showed significantly more and longer neurites than the 1 Hz MS group. These effects were replicated across 5 experiments, each with internal replications of treatment groups.
Figure 2.
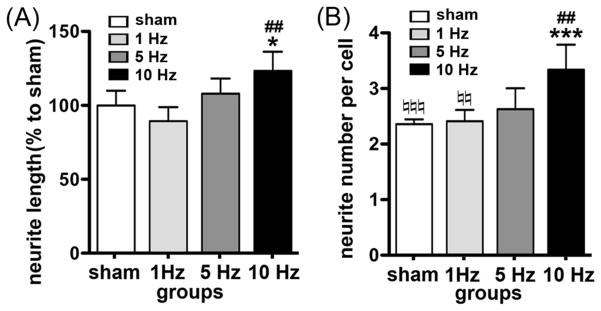
Neurite length and number were regulated by MS. NS-1 cells were cultured onto a collagen-coated coverslip. MS (1, 5 or 10 Hz) at 30% MO was applied starting from the second day, twice per day, for the next 3 days. The NS-1 cells were then fixed and stained for HCS CellMask Red. (A) NS-1 cells extended longer neurites, as compared to the sham group, after 3 days of treatment with 10 Hz MS, but not 1 Hz or 5 Hz MS. (B) The average number of neurites per NS-1 cell was significantly increased by 10 Hz MS. Bars show mean ± SEM values. * p<0.05, *** p<0.005 vs. sham MS group; ## p <0.01 vs. 1 Hz MS group; ♮♮p <0.01, ♮♮♮p<0.005 vs. 10 Hz MS group; Two-way ANOVA with Bonferroni post-hoc tests.
The effect of MS intensity was evaluated for both 30% and 40% MO for all frequency treatment groups. Figure 3 represents images of NS-1 cells treated with MS at 1 Hz (figures 3(A) and (D)), 5 Hz (figures 3(B) and (E)) or 10 Hz (figures 3(C) and (F)) under MO of 30% (figures 3(A) and (B) and (C)) or 40% (figures 3(D) and (E) and (F)). MS affects longest neurite arborization, producing an in vitro neural network, especially in the 10 Hz MS group (figures 3(C) and (F)). As shown, MS applied at 5 Hz (and significantly more at 10 Hz) increased the length of neurites as compared to the sham group (figure 3(G)). The two intensities elicited comparable effects in neurite outgrowth relative to the sham groups, but with exaggerated effects at 40% MO. Compared to the sham groups, 5 Hz MS increased neurite lengths by ~12% (30% MO) and ~18% (40% MO), whereas 10 Hz MS produced a ~30% increase (30% MO) and ~60% increase (40% MO). On the other hand, 1 Hz MS decreased neurite lengths by ~8% (30% MO) and had negligible effects on neurite length at 40% MO (figure 3(H)). In neurite counts per cell, MS intensity produced negligible additional effects on the increasing neurite counts at 1 and 5 Hz MS treatments. The 10 Hz MS groups, however, which produced statistically significant increases in neurite counts per cell, were negatively impacted by the increase in MO, going from an approximate 45% (30% MO) increase in neurite counts down to ~20% (40% MO) (figure 3(I)). MS therefore is capable of either promoting or inhibiting neurite outgrowth depending on the frequency and intensity administered.
Figure 3.

Neurite growth was regulated by both MS frequency and intensity. Representative images show that neurite lengths and counts per NS-1 cell were regulated by MS, as compared to the sham MS group (G). NS-1 cells treated with 1 Hz MS (A, D) expressed shorter neurites, whereas 5 Hz MS (B, E) had negligible effects. 10 Hz MS (C, F), however, consistently expressed longer neurites and higher counts per cell. The graphs illustrate average neurite lengths (H) and neurite counts (I) for NS-1 cells treated with sham MS (sham) and all MS treatment groups (1, 5, or 10 Hz) at 30% MO or 40% MO. Bars showed mean ± SEM values. * p<0.05, ** p <0.01, *** p<0.005 vs. sham MS group; # p<0.05, ## p <0.01 vs. 1 Hz MS group; Ω p<0.05 vs. 5 Hz MS group; ♮ p<0.05 vs. 10 Hz MS group; Two-way ANOVA with Bonferroni post-hoc tests.
3.3. MS differentially affected shorter dendrites and longest neurites in NS-1 cells
Our results show that MS is associated with neuritic arborization, thus we further examined if the effects of MS treatment on neuritic growth were distinguishable between shorter dendrites and longest neuritis (presumably the axon). In the study, NS-1 cells were fixed 4 days after plating and visualized by staining with microtubule-associated protein 2 (MAP2) and Tau I. Despite the axonal features of the longest neurite, cells were MAP2-immunoreactive at this early time point within the 4-day incubation in low density. This was supported by the previous finding that MAP2-positive dendrites and Tau I-positive axons were not clearly segregated in rat cerebral neuronal cultures until day 14 (Kosik and Finch, 1987). Figure 4 examines MS frequency and intensity effects over the lengths of longest neurites and shorter dendrites separately. As seen in figure 4(A), the patterns of both MS frequency and intensity influence mirrored the trends seen in neurite lengths, where 1 Hz MS produced very minor inhibition on the longest neurite growth; 5 Hz MS fostered longest neurite growth; and 10 Hz MS fostered significantly more growth. As shown in figure 4(B), all MS treatments dramatically increased the proportion of longest neurites measuring 100 μm or greater. 10 Hz MS treatments dramatically increased the proportion of processes measuring greater than 150 μm, which replicates trends nearly identical to that of figure 4(A), whereas the vast majority (~70%) of longest neurites in the sham group were <100 μm in length. In other words, higher frequency MS (especially so at 40% MO) leads to more longest neurite counts with lengths greater than 150 μm. With exception to the dramatic influence over longest neurite allocation in 10 Hz, both 1 and 5 Hz at 30% MO show relatively equal distribution over longest neurite length groups. On the other hand, shorter dendrite lengths appear to be wholly unaffected by any MS treatment regardless of frequency or intensity (figure 4(C)).
Figure 4.

Degree of MS influence over longest neurite and shorter dendrite lengths. Neurite outgrowth measurements were broken down into longest neurites and shorter dendrites for further analysis. Graphs show either longest neurite (A) or shorter dendrite (C) lengths measured for NS-1 cells fixed with sham MS treatment (sham) or MS (1, 5 or 10 Hz) at 30% or 40% MO. (B) Further illustrates any trends in the percentage of longest neurites with specified greater length ranges for all test groups. Bars show mean ± SEM values. * p<0.05, ** p <0.01, *** p<0.005 vs. sham MS group; # p<0.05, ## p <0.01, ### p<0.005 vs. 1 Hz MS group; Ω p<0.05, ΩΩ p <0.01 vs. 5 Hz MS group; ♮p<0.05, ♮♮♮ p<0.005 vs. 10 Hz MS group; Two-way ANOVA with Bonferroni post-hoc tests.
3.4. Current-isolation measurements with gridded coverslips
We have further employed the gridded coverslip as an alternative approach to test whether MS treatment effects are dependent on the intensity of the induced current density. The gridded coverslip made it possible to differentially measure NS-1 cells and their growing neuritic arbors in current-isolation zones.
As depicted in figure 4(C), our data showed that MS treatment has little to no effect over shorter dendrite lengths, regardless of frequency or intensity of stimulation. This is further supported by the non-significant changes seen in shorter dendrite length data between zones 1 and 2 for all MS treatment groups compared to the sham group (figure 5(B)). Frequency-dependent effects were consistent between zones except that the magnitude of influence appeared to be severely dampened in Z2. In Z1, 5 and 10 Hz MS produced increases in longest neurite lengths (~25% and ~50%, respectively), but longest neurite lengths were increased less within Z2 (~5% and ~20%, respectively) when compared to the sham group (figure 5(C)). Interestingly, 1 Hz MS showed negligible effects in longest neurite length in Z1, but in Z2 there was a ~20% decrease in longest neurite length. The zonal results (Z1 vs. Z2) seem to suggest that MS with the lower current intensity of Z1 to be more effective. As identified in 2.3 COMSOL Methodology, a minor gradient of induced current density was still present in Z1 (~0–30%), which was addressed in further analysis of Z1i/Z1o differentiation on neurite outgrowth (figure 5(D)). For both longest neurite and shorter dendrite outgrowth, however, no signs of significant changes were observed in either Z1i or Z1o. The combined zonal effects of MS in Z1i, Z1o and Z2 indicates there is an optimal threshold of MS, but not a function of radial distance from the coil center. Figure 5(E) further depicts effects upon specific length groupings within the two zones. Z1, which was significantly more effective in influencing longest neurite length, consistently showed significant changes in longest neurite lengths greater than 150 μm as compared to the sham group; longest neurites between 100–150 μm were non-significantly altered. In Z2, where all MS treatment group effects over longest neurite lengths were essentially mitigated, the same lessened effect was mirrored by no changes over >150 μm longest neurite lengths in all MS treatment groups compared to the sham group. The significant decrease in >150 μm length longest neurites for 1 Hz MS groups in Z2 is reflected by the same decrease in longest neurite length for 1 Hz MS treatment in figure 5(C). Thus MS influence over neurite outgrowth appears to specifically affect longer, more mature neurites, whether or not MS conditions lead to elongating or inhibitory effects.
3.5. MS regulated BDNF expression by NS-1 cells
It has been suggested that rTMS induces LTP-like and LTD-like effects, the molecular mechanisms underlying synaptic plasticity, are modulated by BDNF (Brunoni et al., 2008). Tests of whether MS effects on the longest neurite growth are mediated by BDNF involved measures of MS effects on BDNF expression by NS-1 cells. For measures of BDNF expression, NS-1 cells were plated into conventional culture dishes, treated with MS at 1, 5 or 10 Hz as used for neuritic growth, and harvested after 3 days of MS. ELISAs were used to assess levels of total BDNF protein including a precursor (proBDNF) and mBDNF in cell lysates (figure 6(A)) and mBDNF in culture media (figure 6(B)). As shown in figure 6(A), 10Hz MS significantly increased total BDNF at 30% MO (p<0.05 versus sham) and more so at 40% MO (p<0.01 versus sham). Notably, ELISAs showed similar levels of total BDNF protein in cell lysates (figure 6(A)) but decreased mBDNF in culture media (figure 6(B)) in the 1Hz MS group, compared to the sham group. When compared to the sham group, 10 Hz MS significantly increased mBDNF protein in culture media (figure 6(B)) similar to total BDNF protein in cell lysates (figure 6(A)). This is consistent with the observation that neurite outgrowth is greater in number and length in BDNF-only treated cells, as increasing doses elicits a dose-responsive increase in neurite characteristics (data not shown). Finally, a trend towards a correlation was found between changes in the longest neurite outgrowth and changes in mBDNF levels in all groups before and after MS treatment.
Figure 6.

MS treatment increased BDNF levels in NS-1 cells. NS-1 cells were treated with MS at 1, 5 or 10 Hz and harvested after 3 days for ELISA analysis of BDNF protein content: proBDNF and mBDNF in cell lysates (A) and mBDNF in culture media (B). Bars show mean ± SEM values; n=4; * p<0.05, ** p <0.01, *** p<0.005 vs. sham MS group; # p<0.05, ### p<0.005 vs. 1 Hz MS group; Ω p<0.05, ΩΩ p <0.01 vs. 5 Hz MS group; ♮ p<0.05, ♮♮♮ p<0.005 vs. 10 Hz MS group; Two-way ANOVA with Bonferroni post-hoc tests.
4. Discussion
MS was applied to cultured NS-1 cells in order to characterize the effects of three MS parameters: pulse frequency (1, 5 and 10 Hz), intensity (30 and 40% MO), and induced current density (Z1 and Z2). Changes in neurite lengths and counts per cell were measured to characterize MS effects. Furthermore, neurite data (figures 2 and 3) were further reorganized to distinguish the effects on shorter dendrites and longest neurites (figures 4 and 5). MS had no apparent effects on shorter dendrite outgrowth. Instead, dramatic increases in the longest neurite lengths and neurite counts were seen following 10 Hz MS treatments, which were amplified by increasing MO from 30% to 40%. 5 Hz MS only significantly increased the longest neurite lengths when applied with 40% MO, although still to a lesser degree than 10 Hz MS treatment. 1 Hz MS produced negligible effects in all treatment conditions. In summary, MS-treated coverslips were divided into zones with consistent induced current density distributions to account for rdz (figure 5(A)), minimal (Z1i: <~5% and Z1o: ~10–30%) and maximal (Z2 - ~95%). All instances of longest neurite elongation were highest in Z1 and were dramatically lessened in Z2 (seen in 5 and 10 Hz MS groups). No significant effects were seen in neurite outgrowth between Z1i and Z1o, suggesting that MS effects were likely threshold-based and not graded in relation to intensity. There are a couple of theoretical possibilities to help explain our experimental data (figures 7). First, MS may increase mBDNF expression and thus activate the receptor tyrosine kinase TrkB pathway, which in turn regulates neurite branching and the longest neurite (but not shorter dendrite) growth. These findings support that high (10 Hz and 5 Hz), but not lower (1 Hz), frequency MS increases BDNF expression/signaling, which sculpts axonal arborization/connectivity by positively regulating neuronal activity. Secondly, MS may regulate intracellular calcium levels, by which MS may cause microtubule depolymerization and increased post-synaptic density, resulting in neurite elongation and branch promotion.
Figure 7.

Proposed illustration of the regulation of neurite growth by MS. (A) Stimulation with MS under physiological conditions leads to the neurite branching and longest neurite elongation. A calcium gradient exists under physiological conditions where higher concentrations of calcium are near dendrites and the lowest calcium concentrations are in axons. (B) Overexcitation, such as treatment with high frequency/intensity MS, leads to sustained elevation of intracellular calcium concentrations overwhelming mechanisms to maintain the calcium gradient, thus inhibiting the neurite branching and longest neurite elongation.
4.1. Longest neurites and shorter dendrites are differentially affected
In general, MS effects are dependent on all of its stimulation parameters such as frequency, intensity, pulse pattern and duration (Blackman et al., 1993; Ma et al., 2013; McFarlane et al., 2000; Zhang et al., 2006). This study focuses on frequency and intensity in particular, since it has been demonstrated that these two parameters can significantly modulate MS effects. The results of the present experiments demonstrated a positive correlation between frequency and neurite length at both 30% and 40% MO. Our results were consistent with other studies using frequencies above 15 Hz (Blackman et al., 1993; Macias et al., 2000).
Upon detailed examination, the capability of MS to foster neurite length was observed exclusively in longest neurites but not in shorter dendrites. More specifically, increased neurite branching and the longest neurite growth were all observed after specific MS treatment, but there were no significant changes in shorter dendrite outgrowth. This finding suggests that longest neurites and shorter dendrites are differentially affected by MS, with more effects on longest neurites than on shorter shorter dendrites. Similar results have been reported in other studies and may be attributable to signaling pathways, microtubule composition, glutamate receptor distribution and calcium dynamics that separately affect the development of axons and dendrites (Atwal et al., 2000; Dijkhuizen and Ghosh, 2005; Kuczewski et al., 2009; Kudo et al., 2013; Mattson, 1999).
Immature dynamic microtubules are distributed throughout the structure of a dendrite, whereas axons have a higher content of stable microtubules throughout their structure. Immature microtubules are present mostly on axon growth cones (Kollins et al., 2009). Microtubules in differentiated dendrites and axons are associated with different proteins (MAP2 and Tau I, respectively) which may mediate some of the differences between longest neurite and shorter dendrite growth (Conde and Caceres, 2009; Witte et al., 2008). While the segregation of MAP2 and Tau I is not fully completed in the early time point examined in this experiment, the difference in microtubule composition and stability between axons and dendrites helps explain the increased neurite branching and elongation in the longest neurite measurements, and lack thereof in shorter dendrite outgrowth, post-MS treatment. We speculate that because shorter dendrites have a higher content of immature dynamic microtubules, they quickly reach an equilibrium state of growth and pruning, yielding no net elongation with MS treatment (Conde and Caceres, 2009; Kollins et al., 2009). On the other hand, axon growth is supported by the stabilization of microtubules, which allows axons to elongate and build upon a stable microtubule scaffold from previous growth with MS treatment (figure 7(A)) (Atwal et al., 2000; Shea, 1999).
The lack of MS influence over shorter dendrites could also be explained by the neuronal polarity differences between axons and dendrites, such as: differential distributions of glutamate receptors, voltage-dependent calcium channels (VDCCs), mitochondria, and ion concentration gradients (Kennedy, 1998; Mattson, 1988; Mattson, 1999; Mattson and Partin, 1999). Neuronal polarity is achieved by compartmentalization of domains within neurons to provide different conditions for axon and dendrite growth (Mattson, 1999). Another important distinction between axonal and dendritic compartments in neurons is their post-synaptic densities (Kennedy, 1998). Glutamate receptors are highly concentrated on dendrites because the post-synaptic density provides an anchor for glutamate receptors (Kennedy, 1998). Various studies have shown that glutamate differentially regulates the growth of axons and dendrites, elongating axons and suppressing dendrite elongation, and this is reflected by the subcellular distribution of glutamate receptors (Kennedy, 1998; Mattson, 1988). It is also clear that calcium plays an important role in the differential regulation of axonal and dendritic growth (Mattson, 1988; Mattson, 1999). Increasing intracellular calcium inhibits elongation of both axons and dendrites (Mattson and Kater, 1989). Localized increases in calcium levels in a minor neurite decrease the probability of that neurite becoming an axon, and at the same time leading to the development of an axon from a neurite opposite the site of increased calcium (Mattson et al., 1990). Conversely, locally blocking VDCCs increases the probability of a neurite becoming an axon (Mattson et al., 1990). Further studies revealed that calcium concentration was lowest at sites where axons developed in neurons (Mattson, 1999; Mattson et al., 1990).
It has also been observed that subcellular mitochondrial distribution plays a role in the differential regulation of axonal and dendritic growth (Mattson and Partin, 1999). Mitochondria are concentrated near the base of axons (Mattson and Partin, 1999), which provides a mechanism for supplying ATP required for growth and regulating calcium levels within axon domains (Mattson and Partin, 1999). Mitochondria can thus affect the calcium gradient of neurons and thereby influence the growth of neurites (Mattson et al., 1990; Mattson and Partin, 1999).
4.2. Zonal effects of distinct induced current densities
Due to the properties of the induced electric field/current generated by the circular MS coil, regions of the cell culture coverslips were subject to vastly different electric fields and organized accordingly. Z1 experienced near-minimal induced current densities compared to Z2, which experienced a near-maximal induced current density. Results from these two zones of different electric fields were therefore separately analyzed using gridded coverslips to measure whether different magnitudes of induced current resulted in different effects on neurite outgrowth.
Calcium homeostasis in a neuron has been shown to determine the growth patterns of neurites (Ramakers et al., 2001), maintaining lower calcium levels in axons that support microtubule polymerization, which leads to longest neurite growth (Mattson et al., 1990; Mattson and Partin, 1999; Ramakers et al., 2001). A certain calcium intracellular concentration threshold exists for maximal growth and after intracellular calcium increases beyond this threshold, neurites retract and apoptotic rates are increased (Ramakers et al., 2001). This may explain an increase in longest neurite length in our experiments in Z1, which experienced an electric field of a significantly lower intensity. No differences in MS effects were observed in between Z1i and Z1o, suggesting the threshold requires significant changes in induced current to activate.
Although there are mechanisms to maintain a calcium gradient in neurons, artificially sustaining high levels of calcium risks surpassing the threshold and disrupts calcium homeostasis, leading to neurite regression and cell death (Oertner and Matus, 2005; Ramakers et al., 2001). Such an effect was observed in our study’s greatly diminished effects over longest neurite lengths and neurite counts in Z2’s maximal induced current densities compared to the minimal response in Z1. We speculate that the significantly higher electric field in Z2 was able to disrupt the calcium homeostasis and cross the intracellular concentration threshold, resulting in shorter longest neurites and decreased neurite counts per cell by increasing the rates of depolymerization of microtubules (figure 7(B)).
4.3. MS and BDNF
BDNF has been shown to increase branching and promote neurite growth both in vitro and in vivo (Cui, 2006; Labelle and Leclerc, 2000; Schmidt and Rathjen, 2010). Throughout different neuron populations, BDNF tends to increase branching and stimulate neurite growth through the receptor TrkB, although it does so in varying degrees depending on the specific neurons involved, the presence of other neurotrophins, and the composition of the receptors (Schmidt and Rathjen, 2010).
It is also possible that other neurotrophins are influenced by MS and are critical to elicit a full growth response. However, it is difficult to anticipate the effects of MS treatment on NGF levels, as NS-1 cells were primed for differentiation by NGF at 5 ng/ml and 2 ng/ml before and during the entire course of MS, respectively. The effects of neurotrophins are also modulated by the composition of the receptors in each neuron, since each neurotrophin has different affinities for different receptors (Labelle and Leclerc, 2000; Schmidt and Rathjen, 2010). Neurotrophins other than BDNF include NGF, neurotrophin-4 (NT-4), and neurotrophin-3 (NT-3), which preferentially bind to receptor tyrosine kinases TrkA, TrkB and TrkC respectively, and have little crossover in affinity (Labelle and Leclerc, 2000). We therefore propose that the frequency-dependent neurite growth and increased branching are partially accounted for by the activation of the BDNF signaling pathway. Both proBDNF (32–37 kDa) and mBDNF (14–15 kDa) are released and have trophic activity, but they are reported to preferentially bind the p75NTR and TrkB, respectively (Mowla et al., 2001; Woo et al., 2005) and have opposing actions on several measures (Lu, 2003; Lu et al., 2005) including effects on cell survival, process outgrowth, and activity-dependent LTP (Rex et al., 2006) and LTD (Woo et al., 2005). In particular, mBDNF is the form which supports neurite outgrowth (Tucker, 2002).
As summarized in figure 7, MS regulates mBDNF expression. Activation of the mBDNF-mediated pathway results in elevated intracellular calcium levels via glutamate receptors and/or VDCCs (Ma et al., 2013) or endogenous stores (Gartner and Staiger, 2002), eventually regulating the calcium gradient in neurons that in turn modulates neurite growth and branching (Gartner and Staiger, 2002; Mattson, 1988; Mattson, 1999). During high intensity MS treatment, mechanisms that maintain the calcium gradient in neurons may be overwhelmed by the sustained influx of calcium. As a result, the disruption of calcium homeostasis leads to an inhibition of neurite elongation and branching (Oertner and Matus, 2005; Ramakers et al., 2001). Such an effect was observed in our study, with longest neurites in Z2 having lower average lengths than longest neurites in Z1, as well as decreased neurites per cell in Z2. We speculate that the higher induced electric fields in Z2 were able to disrupt calcium homeostasis, leading to shorter longest neurites and a decrease in neurites per cell by increasing the rates of depolymerization of microtubules. Both glutamate receptors and VDCCs are highly concentrated in dendrites and are sparsely concentrated in axons (Ahlijanian et al., 1990; Gersner et al., 2011; Mattson et al., 1990; Mattson and Partin, 1999). Activity therefore leads to a much higher calcium influx at or near dendrites than in axons (Mattson and Partin, 1999). Another mechanism that maintains a low concentration of calcium in axons is the accumulation of mitochondria at the base of axons, which regulate the influx of calcium into axonal regions because of their ability to absorb calcium (Mattson and Partin, 1999). Calcium inhibits neurite elongation by promoting microtubule depolymerization and promotes branching by increasing post-synaptic density (Oertner and Matus, 2005; Ramakers et al., 2001; Witte et al., 2008; Yoshimura and Rasband, 2014). Maintenance of the aforementioned calcium gradient is required to maintain axonal elongation while limiting dendrite elongation.
5. Conclusion
In conclusion, this study investigated the effects of MS on neuronal arborization and found that MS effects were both frequency- and intensity-dependent. Longest neurite outgrowth was fostered most significantly via 10 Hz MS. In addition, MS-increased longest neurite growth was more effective at 40% MO in Z1 rather than Z2. Notably, our data indicate that mechanisms that establish neuronal polarity and maintain the differential growth patterns of longest neurites and shorter dendrites are regulated by MS in a frequency- and intensity-dependent manner.
Acknowledgments
We thank Dr. Shu-mei Man (Cleveland Clinic (CC), USA) for technical assistance on ELISA and Dr. Christopher Nelson (CC) for editorial assistance and critical reading of the manuscript. This work was supported by grants from the U. S. Department of Defense W81XWH-11-1-0707 and Cleveland Clinic to C.-Y. Lin and U. S. NIH NS069765 to Y.-S. Lee.
References
- Ahlijanian MK, Westenbroek RE, Catterall WA. Subunit structure and localization of dihydropyridine-sensitive calcium channels in mammalian brain, spinal cord, and retina. Neuron. 1990;4:819–832. doi: 10.1016/0896-6273(90)90135-3. [DOI] [PubMed] [Google Scholar]
- Atwal JK, Massie B, Miller FD, Kaplan DR. The TrkB-Shc site signals neuronal survival and local axon growth via MEK and P13-kinase. Neuron. 2000;27:265–277. doi: 10.1016/s0896-6273(00)00035-0. [DOI] [PubMed] [Google Scholar]
- Barker AT, Jalinous R, Freeston IL. Non-invasive magnetic stimulation of human motor cortex. Lancet. 1985;1:1106–1107. doi: 10.1016/s0140-6736(85)92413-4. [DOI] [PubMed] [Google Scholar]
- Blackman CF, Benane SG, House DE. Evidence for direct effect of magnetic fields on neurite outgrowth. FASEB J. 1993;7:801–806. doi: 10.1096/fasebj.7.9.8330687. [DOI] [PubMed] [Google Scholar]
- Bramham CR, Messaoudi E. BDNF function in adult synaptic plasticity: the synaptic consolidation hypothesis. Prog Neurobiol. 2005;76:99–125. doi: 10.1016/j.pneurobio.2005.06.003. [DOI] [PubMed] [Google Scholar]
- Brunoni AR, Boggio PS, Fregni F. Can the ‘yin and yang’ BDNF hypothesis be used to predict the effects of rTMS treatment in neuropsychiatry? Med Hypotheses. 2008;71:279–282. doi: 10.1016/j.mehy.2008.02.011. [DOI] [PubMed] [Google Scholar]
- Conde C, Caceres A. Microtubule assembly, organization and dynamics in axons and dendrites. Nat Rev Neurosci. 2009;10:319–332. doi: 10.1038/nrn2631. [DOI] [PubMed] [Google Scholar]
- Cui Q. Actions of neurotrophic factors and their signaling pathways in neuronal survival and axonal regeneration. Mol Neurobiol. 2006;33:155–179. doi: 10.1385/MN:33:2:155. [DOI] [PubMed] [Google Scholar]
- Dijkhuizen PA, Ghosh A. BDNF regulates primary dendrite formation in cortical neurons via the PI3-kinase and MAP kinase signaling pathways. J Neurobiol. 2005;62:278–288. doi: 10.1002/neu.20100. [DOI] [PubMed] [Google Scholar]
- Dotti CG, Sullivan CA, Banker GA. The establishment of polarity by hippocampal neurons in culture. J Neurosci. 1988;8:1454–1468. doi: 10.1523/JNEUROSCI.08-04-01454.1988. [DOI] [PMC free article] [PubMed] [Google Scholar]
- Fields RD, Nelson PG. Activity-dependent development of the vertebrate nervous system. Int Rev Neurobiol. 1992;34:133–214. doi: 10.1016/s0074-7742(08)60098-7. [DOI] [PubMed] [Google Scholar]
- Gartner A, Staiger V. Neurotrophin secretion from hippocampal neurons evoked by long-term-potentiation-inducing electrical stimulation patterns. Proc Natl Acad Sci U S A. 2002;99:6386–6391. doi: 10.1073/pnas.092129699. [DOI] [PMC free article] [PubMed] [Google Scholar]
- Gersner R, Kravetz E, Feil J, Pell G, Zangen A. Long-term effects of repetitive transcranial magnetic stimulation on markers for neuroplasticity: differential outcomes in anesthetized and awake animals. J Neurosci. 2011;31:7521–7526. doi: 10.1523/JNEUROSCI.6751-10.2011. [DOI] [PMC free article] [PubMed] [Google Scholar]
- Hoogendam JM, Ramakers GM, Di Lazzaro V. Physiology of repetitive transcranial magnetic stimulation of the human brain. Brain stimulation. 2010;3:95–118. doi: 10.1016/j.brs.2009.10.005. [DOI] [PubMed] [Google Scholar]
- Houdayer E, Degardin A, Cassim F, Bocquillon P, Derambure P, Devanne H. The effects of low- and high-frequency repetitive TMS on the input/output properties of the human corticospinal pathway. Exp Brain Res. 2008;187:207–217. doi: 10.1007/s00221-008-1294-z. [DOI] [PubMed] [Google Scholar]
- Huang EJ, Reichardt LF. Neurotrophins: roles in neuronal development and function. Annu Rev Neurosci. 2001;24:677–736. doi: 10.1146/annurev.neuro.24.1.677. [DOI] [PMC free article] [PubMed] [Google Scholar]
- Huerta PT, Volpe BT. Transcranial magnetic stimulation, synaptic plasticity and network oscillations. Journal of neuroengineering and rehabilitation. 2009;6:7. doi: 10.1186/1743-0003-6-7. [DOI] [PMC free article] [PubMed] [Google Scholar]
- Kennedy MB. Signal transduction molecules at the glutamatergic postsynaptic membrane. Brain Res Brain Res Rev. 1998;26:243–257. doi: 10.1016/s0165-0173(97)00043-x. [DOI] [PubMed] [Google Scholar]
- Kollins KM, Bell RL, Butts M, Withers GS. Dendrites differ from axons in patterns of microtubule stability and polymerization during development. Neural development. 2009;4:26. doi: 10.1186/1749-8104-4-26. [DOI] [PMC free article] [PubMed] [Google Scholar]
- Kosik KS, Finch EA. MAP2 and tau segregate into dendritic and axonal domains after the elaboration of morphologically distinct neurites: an immunocytochemical study of cultured rat cerebrum. J Neurosci. 1987;7:3142–3153. doi: 10.1523/JNEUROSCI.07-10-03142.1987. [DOI] [PMC free article] [PubMed] [Google Scholar]
- Kuczewski N, Porcher C, Lessmann V, Medina I, Gaiarsa JL. Activity-dependent dendritic release of BDNF and biological consequences. Mol Neurobiol. 2009;39:37–49. doi: 10.1007/s12035-009-8050-7. [DOI] [PMC free article] [PubMed] [Google Scholar]
- Kudo TA, Kanetaka H, Shimizu Y, Abe T, Mori H, Mori K, Suzuki E, Takagi T, Izumi S. Induction of neuritogenesis in PC12 cells by a pulsed electromagnetic field via MEK-ERK1/2 signaling. Cell structure and function. 2013;38:15–20. doi: 10.1247/csf.12030. [DOI] [PubMed] [Google Scholar]
- Labelle C, Leclerc N. Exogenous BDNF, NT-3 and NT-4 differentially regulate neurite outgrowth in cultured hippocampal neurons. Brain Res Dev Brain Res. 2000;123:1–11. doi: 10.1016/s0165-3806(00)00069-9. [DOI] [PubMed] [Google Scholar]
- Lu B. BDNF and activity-dependent synaptic modulation. Learn Mem. 2003;10:86–98. doi: 10.1101/lm.54603. [DOI] [PMC free article] [PubMed] [Google Scholar]
- Lu B, Pang PT, Woo NH. The yin and yang of neurotrophin action. Nat Rev Neurosci. 2005;6:603–614. doi: 10.1038/nrn1726. [DOI] [PubMed] [Google Scholar]
- Ma J, Zhang Z, Su Y, Kang L, Geng D, Wang Y, Luan F, Wang M, Cui H. Magnetic stimulation modulates structural synaptic plasticity and regulates BDNF-TrkB signal pathway in cultured hippocampal neurons. Neurochem Int. 2013;62:84–91. doi: 10.1016/j.neuint.2012.11.010. [DOI] [PubMed] [Google Scholar]
- Macias MY, Battocletti JH, Sutton CH, Pintar FA, Maiman DJ. Directed and enhanced neurite growth with pulsed magnetic field stimulation. Bioelectromagnetics. 2000;21:272–286. [PubMed] [Google Scholar]
- Mattson MP. Neurotransmitters in the regulation of neuronal cytoarchitecture. Brain Res. 1988;472:179–212. doi: 10.1016/0165-0173(88)90020-3. [DOI] [PubMed] [Google Scholar]
- Mattson MP. Establishment and plasticity of neuronal polarity. J Neurosci Res. 1999;57:577–589. [PubMed] [Google Scholar]
- Mattson MP, Kater SB. Excitatory and inhibitory neurotransmitters in the generation and degeneration of hippocampal neuroarchitecture. Brain Res. 1989;478:337–348. doi: 10.1016/0006-8993(89)91514-x. [DOI] [PubMed] [Google Scholar]
- Mattson MP, Murain M, Guthrie PB. Localized calcium influx orients axon formation in embryonic hippocampal pyramidal neurons. Brain Res Dev Brain Res. 1990;52:201–209. doi: 10.1016/0165-3806(90)90236-r. [DOI] [PubMed] [Google Scholar]
- Mattson MP, Partin J. Evidence for mitochondrial control of neuronal polarity. J Neurosci Res. 1999;56:8–20. doi: 10.1002/(SICI)1097-4547(19990401)56:1<8::AID-JNR2>3.0.CO;2-G. [DOI] [PubMed] [Google Scholar]
- McFarlane EH, Dawe GS, Marks M, Campbell IC. Changes in neurite outgrowth but not in cell division induced by low EMF exposure: influence of field strength and culture conditions on responses in rat PC12 pheochromocytoma cells. Bioelectrochemistry. 2000;52:23–28. doi: 10.1016/s0302-4598(00)00078-7. [DOI] [PubMed] [Google Scholar]
- Mowla SJ, Farhadi HF, Pareek S, Atwal JK, Morris SJ, Seidah NG, Murphy RA. Biosynthesis and post-translational processing of the precursor to brain-derived neurotrophic factor. J Biol Chem. 2001;276:12660–12666. doi: 10.1074/jbc.M008104200. [DOI] [PubMed] [Google Scholar]
- Oertner TG, Matus A. Calcium regulation of actin dynamics in dendritic spines. Cell Calcium. 2005;37:477–482. doi: 10.1016/j.ceca.2005.01.016. [DOI] [PubMed] [Google Scholar]
- Ogiue-Ikeda M, Kawato S, Ueno S. The effect of repetitive transcranial magnetic stimulation on long-term potentiation in rat hippocampus depends on stimulus intensity. Brain Res. 2003;993:222–226. doi: 10.1016/j.brainres.2003.09.009. [DOI] [PubMed] [Google Scholar]
- Pashut T, Wolfus S, Friedman A, Lavidor M, Bar-Gad I, Yeshurun Y, Korngreen A. Mechanisms of magnetic stimulation of central nervous system neurons. PLoS computational biology. 2011;7:e1002022. doi: 10.1371/journal.pcbi.1002022. [DOI] [PMC free article] [PubMed] [Google Scholar]
- Ramakers GJ, Avci B, van Hulten P, van Ooyen A, van Pelt J, Pool CW, Lequin MB. The role of calcium signaling in early axonal and dendritic morphogenesis of rat cerebral cortex neurons under non-stimulated growth conditions. Brain Res Dev Brain Res. 2001;126:163–172. doi: 10.1016/s0165-3806(00)00148-6. [DOI] [PubMed] [Google Scholar]
- Rex CS, Lauterborn JC, Lin CY, Kramar EA, Rogers GA, Gall CM, Lynch G. Restoration of long-term potentiation in middle-aged hippocampus after induction of brain-derived neurotrophic factor. J Neurophysiol. 2006;96:677–685. doi: 10.1152/jn.00336.2006. [DOI] [PMC free article] [PubMed] [Google Scholar]
- Ruohonen J. Background physics for magnetic stimulation. Supplements to Clinical neurophysiology. 2003;56:3–12. doi: 10.1016/s1567-424x(09)70204-1. [DOI] [PubMed] [Google Scholar]
- Salinas FS, Lancaster JL, Fox PT. Detailed 3D models of the induced electric field of transcranial magnetic stimulation coils. Physics in medicine and biology. 2007;52:2879–2892. doi: 10.1088/0031-9155/52/10/016. [DOI] [PubMed] [Google Scholar]
- Schmidt H, Rathjen FG. Signalling mechanisms regulating axonal branching in vivo. Bioessays. 2010;32:977–985. doi: 10.1002/bies.201000054. [DOI] [PubMed] [Google Scholar]
- Shea TB. Selective stabilization of microtubules within the proximal region of developing axonal neurites. Brain Res Bull. 1999;48:255–261. doi: 10.1016/s0361-9230(98)00019-7. [DOI] [PubMed] [Google Scholar]
- Szapacs ME, Mathews TA, Tessarollo L, Ernest Lyons W, Mamounas LA, Andrews AM. Exploring the relationship between serotonin and brain-derived neurotrophic factor: analysis of BDNF protein and extraneuronal 5-HT in mice with reduced serotonin transporter or BDNF expression. J Neurosci Methods. 2004;140:81–92. doi: 10.1016/j.jneumeth.2004.03.026. [DOI] [PubMed] [Google Scholar]
- Thickbroom GW. Transcranial magnetic stimulation and synaptic plasticity: experimental framework and human models. Exp Brain Res. 2007;180:583–593. doi: 10.1007/s00221-007-0991-3. [DOI] [PubMed] [Google Scholar]
- Thickbroom GW, Byrnes ML, Edwards DJ, Mastaglia FL. Repetitive paired-pulse TMS at I-wave periodicity markedly increases corticospinal excitability: a new technique for modulating synaptic plasticity. Clin Neurophysiol. 2006;117:61–66. doi: 10.1016/j.clinph.2005.09.010. [DOI] [PubMed] [Google Scholar]
- Thoenen H. The changing scene of neurotrophic factors. Trends Neurosci. 1991;14:165–170. doi: 10.1016/0166-2236(91)90097-e. [DOI] [PubMed] [Google Scholar]
- Tucker KL. Neurotrophins and the control of axonal outgrowth. Panminerva medica. 2002;44:325–333. [PubMed] [Google Scholar]
- Van Ooyen A, Van Pelt J, Corner MA. Implications of activity dependent neurite outgrowth for neuronal morphology and network development. Journal of theoretical biology. 1995;172:63–82. doi: 10.1006/jtbi.1995.0005. [DOI] [PubMed] [Google Scholar]
- Waterhouse EG, Xu B. New insights into the role of brain-derived neurotrophic factor in synaptic plasticity. Mol Cell Neurosci. 2009;42:81–89. doi: 10.1016/j.mcn.2009.06.009. [DOI] [PMC free article] [PubMed] [Google Scholar]
- Witte H, Neukirchen D, Bradke F. Microtubule stabilization specifies initial neuronal polarization. J Cell Biol. 2008;180:619–632. doi: 10.1083/jcb.200707042. [DOI] [PMC free article] [PubMed] [Google Scholar]
- Woo NH, Teng HK, Siao CJ, Chiaruttini C, Pang PT, Milner TA, Hempstead BL, Lu B. Activation of p75NTR by proBDNF facilitates hippocampal long-term depression. Nat Neurosci. 2005;8:1069–1077. doi: 10.1038/nn1510. [DOI] [PubMed] [Google Scholar]
- Yeyeodu ST, Witherspoon SM, Gilyazova N, Ibeanu GC. A rapid, inexpensive high throughput screen method for neurite outgrowth. Current chemical genomics. 2010;4:74–83. doi: 10.2174/1875397301004010074. [DOI] [PMC free article] [PubMed] [Google Scholar]
- Yoshimura T, Rasband MN. Axon initial segments: diverse and dynamic neuronal compartments. Curr Opin Neurobiol. 2014;27C:96–102. doi: 10.1016/j.conb.2014.03.004. [DOI] [PMC free article] [PubMed] [Google Scholar]
- Zhang Y, Ding J, Duan W. A study of the effects of flux density and frequency of pulsed electromagnetic field on neurite outgrowth in PC12 cells. Journal of biological physics. 2006;32:1–9. doi: 10.1007/s10867-006-6901-2. [DOI] [PMC free article] [PubMed] [Google Scholar]
- Zheng J, Li L, Huo X. Analysis of Electric Field in Real Rat Head Model during Transcranial Magnetic Stimulation. Conference proceedings: … Annual International Conference of the IEEE Engineering in Medicine and Biology Society IEEE Engineering in Medicine and Biology Society Conference; 2005. pp. 1529–1532. [DOI] [PubMed] [Google Scholar]